

Abstract
Information on protein-protein interactions is of central importance for many areas of biomedical research. Currently no method exists to systematically and experimentally assess the quality of individual interactions reported in interaction mapping experiments. To provide a standardized confidence-scoring method that can be applied to tens of thousands of protein interactions we have developed an interaction tool-kit consisting of four complementary high-throughput (HT) protein interaction assays. These assays were benchmarked against positive and random reference sets (PRS and RRS) consisting of well documented human interaction pairs and randomly chosen protein pairs, respectively. A logistic regression model was trained using the PRS/RRS data to combine the assay outputs and calculate the probability that any novel interaction pair is a true biophysical interaction once it has been tested in the tool-kit. This general approach will allow a systematic and empirical assignment of confidence scores to all individual protein-protein interactions in interactome networks.
Physical protein-protein interactions are an elementary constituent of biological systems and discovering interaction networks is a major goal in systems biology. There are two complementary branches of protein interaction analysis. Analysis of protein complexes using affinity purification followed by mass spectrometry (AP/MS) identifies directly and indirectly associated proteins. Direct, binary interactions have been discovered via HT yeast-two-hybrid (Y2H) analyses, although smaller datasets have recently emerged from other methods1.
As binary interaction mapping has grown, dataset quality has rightly, been scrutinized. A first study which compared several interaction datasets to a gold standard of MIPS protein-complexes suggested that HT-Y2H data have poor quality2. A more recent analysis showed that MIPS complexes are inappropriate for evaluating Y2H data, and that HT-Y2H data are of high quality when compared against a gold standard of directly interacting proteins3.
Given the importance of protein interactions and the demand for better and more comprehensive maps, standardized experimental methods for quality control (QC) are crucial. These are particularly important for determining all the direct, physical interactions between human proteins in the context of a human interactome project as they will enable the scientific community to evaluate assay implementations under a universally interpretable quality standard.
Methods for quality control can be categorized according to the evidence analyzed, and whether the quality of the dataset as a whole or the quality of individual interactions is evaluated (Supplementary Fig. 1 online). Early quality assessments have used the strength of a correlation with indirect secondary data, such as co-expression or functional annotation, mostly to measure the overall dataset quality2,4–6. However, knowledge about biological roles of proteins is limited for most proteins. Furthermore, expression of interacting proteins need not be correlated over many conditions and conversely protein pairs with correlated expression patterns do not necessarily physically interact. Although a correlation with secondary data increases confidence in interaction data, no conclusion can be drawn from the absence of such correlations. This is particularly true for HT data that does not have a sociological investigation bias and is more likely to contain unexpected connections. For rigorous quality assessment it is important to use protein interaction evidence.
Several approaches assign confidence scores based on experimental data. The frequency with which interactions are found in HT datasets has been used to inform error models for the combined data7. This approach does not provide a quality assessment for individual interactions however. To prioritize individual interactions several groups have calculated a confidence score based on their experimental data, e.g. how often a given interaction was recovered in Y2H screens8,9, how reliably a protein was identified in an AP/MS experiment10,11 or combinations of such primary experimental data with secondary data12. These scores are strongly influenced by biases of the particular experimental set-up, and are therefore interpretable only within this context. A more universal confidence scoring approach is therefore desirable.
Previously we and others experimentally assessed dataset quality by testing a subset of newly identified interactions in an orthogonal interaction assay3,13,14. This experimental approach confirmed only a fraction of all interactions. Because every method has inherent limitations and because performance depends on stringency of the implementation, unconfirmed interactions may be merely false negatives of the second assay.
To individually confirm most ‘true’ biophysical interactions found in a HT screen, we pursued a strategy to retest every candidate interaction in a panel of several interaction assays. If the assay performances are benchmarked against a common reference, the data from these retesting experiments can be quantitatively integrated into a confidence score as illustrated in Fig. 1. In future interaction mapping experiments it will then be possible to report a probability for every protein interaction along with the experimental evidence and the underlying benchmarking data for every assay.
Figure 1.
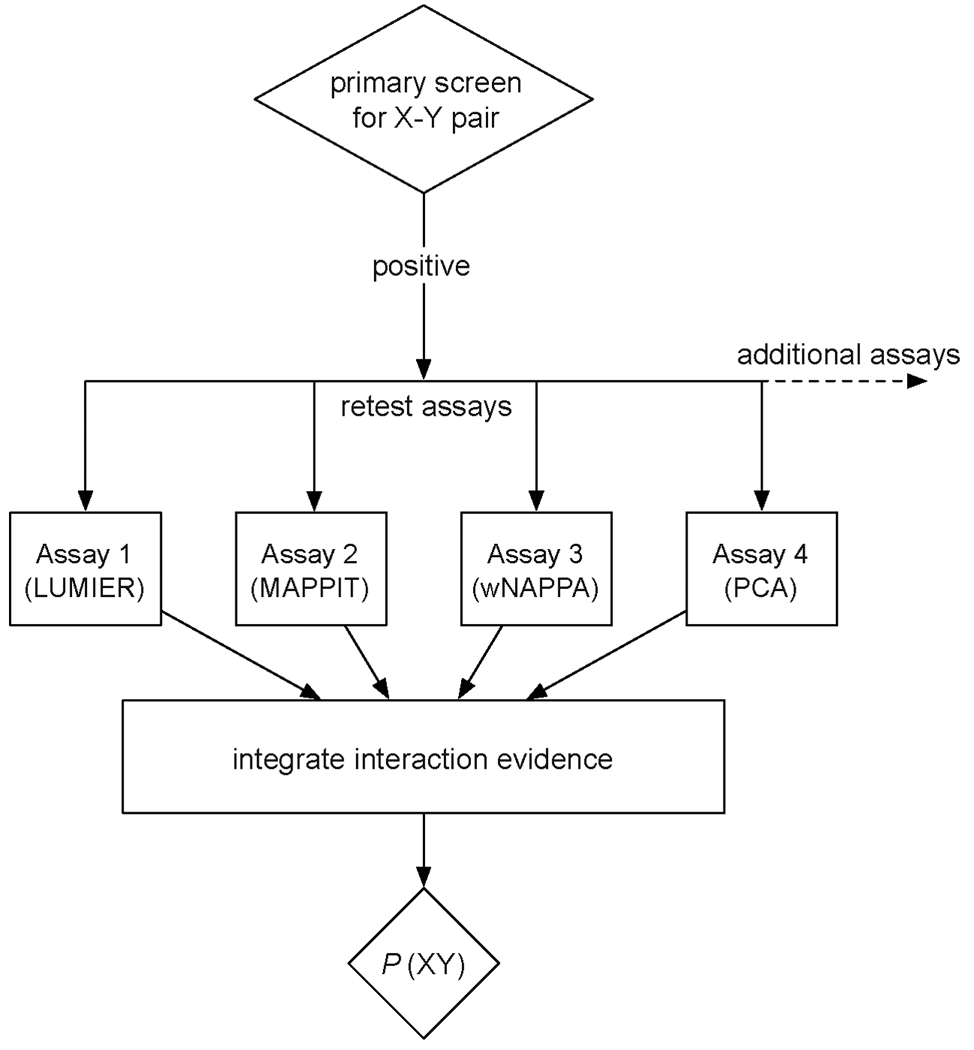
Strategy for deriving a confidence score for individual protein-protein interactions after HT screening using data from several complementary follow-up interaction assays. After initial screening using a HT platform, for example Y2H, all positives are evaluated using secondary tool-kit assays that have been benchmarked by PRS/RRS. The resulting raw data are integrated using a model trained on the PRS/RRS calibration data to derive a confidence based on the experimental support for each interaction (see text for details).
RESULTS
Compiling an interaction assay tool-kit
To establish a confidence scoring methodology we first compiled and characterized a panel of protein interaction assays implemented in HT format. The assays are based on complementary principles and expression systems (Fig. 2): Yeast-2-hybrid (Y2H)15,16; Mammalian Protein-Protein Interaction Trap (MAPPIT)17; LUminescence-based Mammalian IntERactome (LUMIER)1; Yellow Fluorescent Protein (YFP) Protein Complementation Assay (PCA)18; and a modified version of the Nucleic Acid Programmable Protein Array (wNAPPA)19. Because the assays are compatible with recombinational cloning and performed in 96-well format hundreds of thousands of interactions identified in HT screens can be tested at a reasonable cost (Supplementary Data online).
Figure 2.

Schematic description of complementary tool-kit assays for binary protein interaction. (a) Yeast-2-hybrid: The Gal4 transcription factor is reconstituted to activate one or more independent reporter genes in S. cerevisiae. (b) MAPPIT: A bait-protein is fused to a hybrid erythropoietin-leptin receptor and the prey is fused to gp130. Upon stimulation with erythropoietin JAK2 molecules trans-phosphorylate each other and if bait and prey interact the activated JAKs will phosphorylate gp130, which in turn recruits and subsequently activates STAT3, which then activates transcription of a reporter (c) PCA: Two YFP fragments fused to bait and prey proteins reconstitute a fluorescent protein if brought in close proximity by two proteins that physically interact. (d) LUMIER: A luciferase tagged bait is co-expressed with a Flag-tagged prey in HEK-293T cells. The association between these proteins is determined by co-immunoprecipitation using an anti-Flag antibody and the presence of the bait is detected via its luciferase activity. (e) wNAPPA: Plasmids encoding GST-bait and HA-prey are mixed in a coupled transcription/translation reticulocyte lysate to express protein. Subsequently, the bait-GST is captured on the bottom of 96-well plate coated with anti-GST antibodies. If the proteins are interacting, the HA-prey can be immunologically detected.
Benchmarking tool-kit assays using reference sets
To develop a confidence score, we characterized assay performance using a positive reference set (PRS) and a random reference set (RRS) for protein interactions20. Our first version of a human PRS (hsPRS-v1) contain 92 interacting human protein pairs for which we found more than one peer-reviewed publication in multiple manually curated databases21–25 (details in Supplementary Methods online). Apart from verification of the curation reports26 and ensuring ORF availability in the human ORFeome1.127, we applied no additional filters, so interactions between membrane proteins, ligand-receptor pairs or those dependent on post-translational modifications (PTMs) were all included. HsPRS-v1 thus constitutes a reasonable representation of well-established human binary interactions. For our first version of a human RRS (hsRRS-v1), 92 protein pairs were chosen randomly from the human ORFeome1.1 (108 pairwise combinations) after removing all previously described interacting pairs21–25. Because there is no available gold standard for non-interacting proteins and because randomly chosen protein pairs are unlikely a priori to interact, our RRS serves as a negative control set. Alternative approaches for choosing negative training examples are possible, but introduce unacceptable biases28,29.
We tested all pairs of the reference sets by tool-kit assays evaluating the effect of assay stringency on the detection of PRS and RRS pairs (Supplementary Fig. 2 online). The use of 184 controls, as opposed to the small number usually used to characterize interaction assays, increases robustness. The receiver-operating characteristics (ROC) curve of four tool-kit assays illustrating the tradeoff between true and false positive rates as a function of stringency are shown in Fig. 3a. For the analysis of assay performance we used a threshold that maximized detection of PRS while maintaining a low number of positive scoring RRS.
Figure 3.

Evaluation of assay performance at different stringencies using hsPRS-v1 and hsRRS-v1. (a) The tradeoff between true and false positive rate at different stringencies of the tool-kit assays. For different applications, different thresholds may be used. (b) Y2H assay performance in different scoring protocols (one vs. two reporters) and different bait and prey expression levels (high vs. low copy plasmid, y-axis). 3-AT (3-amino-1,2,4-triazole) is a competitive inhibitor of the HIS3 gene product and was included to reduce background in one set of experiments.
For Y2H we measured activation of one or more reporter genes using both high and low copy plasmids to alter DB-X and AD-Y expression levels 15,30. Most implementations involve the Y8800/8930 yeast strains (Y-strain) currently used for screening at CCSB3, and we included one implementation with the MaV103/20330 strains (MaV-strain) for comparison20. The standard implementation for HT-Y2H screening at CCSB (low copy plasmids, both reporters activated3) detects 16% of hsPRS-v1 pairs and no hsRRS-v1 pairs, while relaxation of the scoring criteria (either reporter activated) leads to an increase in assay sensitivity to 25%, while not affecting RRS detection (Fig. 3b). Raising protein levels increases Y2H assay-sensitivity to >40% at the expense of detecting four hsRRS-v1 pairs. The profile of detected individual interactions differs between Y2H implementations (Supplementary Fig. 3 online). When the same search space of the human interactome was interrogated using two different yeast strains many interactions were uniquely detected by each implementation. Hence, different implementations of the same technology can lead to different results, which may partially explain why datasets acquired by different groups exhibit limited overlap.
The performance of each assay on PRS and RRS reveals the ability to report true protein interactions under the respective assay conditions (Fig. 4a). The approach provides a method for benchmarking different assays on a standardized set of controls. Surprisingly, assay-sensitivity of all methods fell in a similar range of ~20%–35%.
Figure 4.

Performance of assays against positive and random reference sets (PRS and RRS). (a) Quantitation of assay sensitivity and specificity with standard error using hsPRS-v1 and hsRRS-v1. (b) Detection of individual hsPRS-v1 and hsRRS-v1 pairs by the tool-kit assays: Top panel: detected hsPRS-v1 pairs are indicated by green squares. Bottom panel detected hsRRS-v1 pairs are indicated by red squares. Phosphorylation dependent interactions are indicated by solid black frames. Thresholds used for the assays in this figure can be found in the Materials and Methods section.
LUMIER
The LUMIER pull-down assay (Fig. 2d) had the highest assay-sensitivity as demonstrated by the detection of 36% of hsPRS-v1 pairs and four negative control hsRRS-v1 pairs at the chosen scoring threshold (Fig. 4a). LUMIER recovered one phosphorylation-dependent interaction (Fig. 4b). Post-translational modification dependent interactions, like that between SMAD1 and SMAD4, are likely to be detected only after proper activation of specific signaling cascades1.
MAPPIT
MAPPIT generates a ligand-dependent semi-quantitative luciferase read-out in mammalian cells without enrichment steps (Fig. 2b). The scoring conditions detected 33% of hsPRS-v1 pairs and two positive hsRRS-v1 pairs (Fig. 4a). Like Y2H and PCA, MAPPIT detected two phosphorylation-dependent interactions (Fig. 4b). The detection of other PTM dependent interactions may require additional stimulation or use of the heteromeric MAPPIT variant31.
Y2H
The Y2H system (Fig. 2a) had an assay-sensitivity of 25% and no hsRRS-v1 pairs were detected (Fig. 4a). Contrary to common perception, the detection of interactions involving nuclear proteins was not greater in Y2H than in other assays (Supplementary Fig. 4 online). We also detected phosphorylation dependent interactions (PTK2-SRC, SMAD1-SMAD4) (Fig. 4b), so Y2H, like the other assays, can detect a subset of PTM-dependent interactions.
PCA
The YFP reconstitution of the PCA assay (Fig. 2c) gave such strong signals that stringent criteria had to be applied to decrease the number of hsRRS-v1 interactions that scored positive. High signal strength may be due to the irreversible nature of YFP refolding. After optimization, PCA had an assay-sensitivity of 23% with two positive scoring RRS pairs (Fig. 4a).
wNAPPA
The completely in vitro performed wNAPPA (Fig. 2e) has an assay-sensitivity of 21% under conditions in which three hsRRS-v1 pairs were detected (Fig. 4a). Interestingly 7 out of 16 interactions between two membrane proteins scored positive (43%) (Supplementary Fig. 4), in contrast to none of the seven hsRRS-v1 membrane protein pairs.
Detection of hsPRS-v1 interaction pairs
A total of 55 out of the 92 (59%) hsPRS-v1 interactions were detected by at least one of the tool-kit assays. Remarkably, the five very complementary assays failed to detect ~40% of hsPRS-v1 (Fig. 4b). We investigated possible systematic reasons for this finding (Supplementary Data). A combination of different reasons explains detection failure, including PTM-dependence, steric geometry of fusion proteins (Supplementary Fig. 5b online), and protein families that are impervious to detection such as extracellular proteins (Supplementary Fig. 4). The use of different sequence isoforms likely also has an effect. The methods originally used to describe the hsPRS-v1 interactions had no detectable influence on the insensitivity.
Detection of RRS protein pairs
In all assays except Y2H, the threshold values chosen led to several hsRRS-v1 pairs scoring positive. Such small numbers of detected RRS in these experiments cannot extrapolate directly to false-positive rates expected in large-scale screens1. Large-scale screens would need to be carried out at increased stringency relative to these confirmatory assays, but this may come at the expense of detecting fewer real interactions.
Several hsRRS-v1 pairs were positive in one (seven pairs) or in two different assays (ITPA/WDR62 and MCCC1/GALK1) (Fig. 4b). The protein pairs were picked randomly and because current knowledge about interaction networks is incomplete, these pairs may be real yet unknown interactors. It is unlikely that all nine detected hsRRS-v1 pairs (10%) fall into this category. Some interactions may be “pseudo-interactions”, i.e., valid biophysical interactions which never occur in vivo because the involved proteins are separated spatially or temporally. Artifactual interactions may occur at a given frequency as a consequence of the particular conditions of the respective assay (expression levels + fusion tags + mechanics of the assay). While interactions detected by only a single assay should be interpreted with caution, one quarter (22) of the well-documented hsPRS-v1 were detected by just a single assay. As such, protein pairs detected by a single method cannot be dismissed outright. Such interactions emphasize the need to integrate the outcome of several assays into a quantitative confidence score.
Integrative analysis of assay outcome
The PRS/RRS characterization quantitatively benchmarks protein interaction assays against a standardized reference and thus measures the reliability of a positive result in each assay. The tool-kit assays in conjunction with the PRS/RRS benchmarking data can therefore be used for confidence scoring, with all interactions identified in large-scale primary screens retested by the tool-kit. The confidence assigned to each interaction is then adjusted according to the outcome of these retests (Fig. 1).
We modeled the probability that a given protein pair is truly interacting with a Bayesian framework. Traditionally, the continuously-valued raw data of each assay are converted into a binary (“yes” or “no”) call for each protein pair, but much information is lost this way and there is the potential to ‘over fit’ the thresholds used to make a binary call. Instead we used normalized raw data (for LUMIER, MAPPIT, wNAPPA, and PCA) across hsPRS-v1 and hsRRS-v1 to train a logistic regression model that computes a probabilistic confidence score for each potential interaction. This confidence scoring method will not be applied to randomly chosen protein pairs, but to candidate interactions identified for example in HT-Y2H screens. We used the 23 Y2H-positive hsPRS-v1 pairs as positive examples to train the regression model. Our approach is not limited to evaluating Y2H interactions however, and can easily be adapted to other screening platforms. To account for training example bias (the ratio of positive to negative samples), we used a Bayesian correction incorporating the prior probability that the interactions are ‘true’ before considering additional evidence from the tool-kit assays. We used the 78% precision previously estimated for HT-Y2H interactions in the CCSB-HI1 human interactome dataset (details in Supplementary Methods)14.
We evaluated predictive performance of the integrated model, i.e., sensitivity vs. specificity analysis, based on relative ranks using leave-one-out cross-validation (LOO-CV) (Supplementary Fig. 6 online). The beta parameter for each assay indicates the contribution of this assay to the final score. The large values for LUMIER and MAPPIT indicate that these two assays provide most information to the final confidence score (Table A in Supplementary Methods). Thus, the beta parameters can be used to optimize the tool-kit for greatest value, i.e, most complementary assay implementations, which would lead to similar beta-parameters for the different assays. Features that could be optimized include eliminating less informative assays, replacing one assay with a more informative assay, or changing details an existing assay implementation, i.e., use of different constructs.
The most important feature of our integrative analysis is that it calculates a confidence score for each candidate interaction, based on the results of a consistently benchmarked panel of tool-kit assays. We demonstrated the concept by calculating the LOO-CV confidence score for the Y2H positive hsPRS-v1 pairs (Fig. 5a). In future interactome maps such confidence scores can be provided along with the underlying experimental evidence for every reported interaction (Fig. 5b).
Figure 5.

Application of the integrated confidence score. (a) Application of the confidence scoring scheme to the Y2H-positive hsPRS-v1 to exemplify the process. Probabilities for pairs within each assay (middle panel) are computed using LOO-CV and a single-assay logistic regression model, trained identically to the combined-assay regression model. (b) Every reported interaction reported in future protein-protein interaction mapping experiments can be assigned a confidence score based on the tool-kit assay data for each individual protein pair.
DISCUSSION
Our confidence scoring method crucially uses a PRS and RRS to benchmark interaction assays. The reference sets in hand enabled standardized calibration of different interaction assays and implementations. This calibration can be expanded to other binary interaction assays and facilitates optimization and interpretation of protein interaction experiments. Establishment and widespread use of more reference sets would enhance the ability to compare and interpret data acquired in different studies.
These first version reference sets suffer from small size, but growing knowledge about protein interactions and increased ORF availability will enable construction of larger and more representative PRS and RRS versions. One potential bias in PRSs could be towards ‘better behaved’ interactions that are more easily detected by different assays. Such a bias could lead to artificially low confidence scores. We did not find that interactions supported by multiple methods in the curation are more easily detected by the tool-kit. Even after retesting in several assays three Y2H-positive hsPRS-v1 interactions received a low confidence score (Fig. 5a). Even among low scoring interactions valid pairs can be found, so the experimentally determined scoring parameters may be conservative.
In contrast to conventional assumptions, under our assay conditions Y2H (i) is not more prone to detect false positives than other binary assays, (ii) does not favor detection of interactions among nuclear proteins and (iii) is not blind to detecting PTM-dependent interactions. Mammalian cell-based assays will nonetheless be better suited for focused studies of context-dependent interactions and may provide time-resolved information1,18. Increasing protein expression in Y2H significantly increased the number of detected hsPRS-v1 pairs, albeit at the expense of more positive-scoring hsRRS-v1 pairs. Once a confidence scoring scheme becomes established, primary screening stringency can be relaxed, boosting the number of detected interactions while reporting the high accuracy of all published interactions.
Our linear regression model calculates, based on the tool-kit data, a quantitative confidence score for any interaction pair. This model can be adapted to other assays, implementations, and to different primary screening methods, so long as assays are benchmarked using PRS/RRS and the false discovery rate for screening methods is estimated. Thus, this method for assessing confidence in protein-protein interactions is universal.
A standardized and transferable approach for calculating confidence scores will impact interaction mapping in several ways. The ability to discriminate between “exceedingly likely” and “possible” interactions will be invaluable for triaging follow-up studies. Quantitative scores assessing confidence in protein interaction may be readily integrated with other types of genomic data to predict functional relationships. Now the scientific community can set quality standards and compare datasets generated by different protein interaction mapping methods.
METHODS
Construction of the first version of a human positive reference set (hsPRSv1)
To measure the performance of the interaction tool-kit assays we sought to compile a diverse panel of very well documented high quality interactions from the literature as a positive reference set. Within the space of approximately 7000 × 7000 ORFs (Space-I) defined by the human ORFeome 1.1 collection available at that time 4,067 direct binary interactions were reported by five manually curated databases (MINT, HPRD, BIND, MIPS and DIP). To ensure high quality interactions we required 2 publications describing each interaction to obtain 275 interaction pairs. After elimination of homodimers we were left with 188 interactions, which were manually recurated by rereading all publications reported by the databases as supporting these interactions. Surprisingly, one result of this recuration was that 38% of “curation-units” (one experiment supporting one interaction reported by any one database) were wrong, thus validating the insistence on multiple papers and multiple databases supporting each interaction. Of the 111 interactions supported by >1 verified publication 92 were among full-length proteins thus constituting hsPRS v1. All interaction pairs and a standardized description of the methods by which the interactions have been described can be found in supplementary table 1.
Y2H
The yeast two-hybrid assay was done using a modified retesting protocol3. Haploid yeast expressing individual AD and DB constructs were mated, diploids were selected, and HIS+ and ADE+ phenotypes were scored after incubation for 4 days at 30°C. The same protocol was used for the high-copy 2 micron (2µ) Y2H vectors (pVV212 (DB) and pVV213 (AD)30). MaV103/203 experiments were performed as described20 The genotype of the Y-strains is: GAL2::ADE2 LYS2::GAL1-HIS3 met2::GAL7-lacZ cyhR ura3–52 leu2–3 trp1–901 his3D200 gal4D gal80D. The genotype of the MaV strains is: SPAL10::Ura3 GAL1::LacZ GAL1::HIS3@LYS2 can1R cyhR ura3–52 leu2–3 trp1–901 his3D200 ade2–101 gal4D gal80D. For the experiments in Figure 4, CYH sensitive activation of either HIS3 or ADE2 in either tested configuration (Supplementary Fig. 5) was used as criteria for positive interactions using CEN plasmids in the Y-strain. A detailed step-by-step protocol can be found in Supplementary Protocol 1 online.
MAPPIT
MAPPIT experiments were performed as described32 with minor changes. Briefly, HEK-293T cells were transfected in 96-well plates. Twenty-four hours after transfection cells were stimulated with ligand (Epo) or left untreated for an additional 24 hours, followed by measurement of luciferase activity in triplicate. All interactions were tested in two configurations (Supplementary Fig. 5) and in two independent trials. For the data in Figure 4 pairs were scored positive if the fold-induction value was 12 times higher or equal to the ones obtained with both the irrelevant bait and the irrelevant prey in either of the two tested configurations. A detailed step-by-step protocol can be found in Supplementary Protocol 2 online.
LUMIER
LUMIER assays were as previously described 1. All configurations were tested in duplicate. HEK-293T cells were transfected in 96-well plates. Forty-eight hours after transfection cells were lysed and 70% of lysate was processed for immunoprecipitation. Expression of RLUC-tagged baits was measured in 10% of the cell lysates. LIR values were obtained as described before1 for the immunoprecipitates (LIR-IP), and calculated similarly for the total lysates (LIR TOT). NLIR was calculated as the ratio LIR-IP/LIR-TOT. The corresponding NLIR value for each Flag-tagged prey with RLUC (no fusion) was subtracted. These final NLIR values were used to generate the ROC curve. The data in Figure 4 were calculated by requiring an average NLIR score of >33.2 in either of the tested configurations (Supplementary Fig. 5). A detailed step-by-step protocol can be found in Supplementary Protocol 3 online.
PCA
Baits were fused to the F1 fragment and preys to F2 fragments of YFP using Gateway LR reactions. Both plasmids were transfected in 96-well format into CHO-K1 cells. CFP encoding plasmid was included to identify transfected cells. 18hrs post-transfection cells were washed, trypsinized at room temperature and analyzed using FACS. For Figure 4 protein pairs were scored as positive when in any tested configuration (Supplementary Fig. 5) at least 30% of transfected cells in that well showed YFP signal above background and the YFP/CFP ratio was at least twice as high as the ratio of the average YFP signal over the average CFP ratio on that plate. A detailed step-by-step protocol can be found in Supplementary Protocol 4 online.
wNAPPA
The used protocol was modified from Ramachandran et al. (ref. 24). Bait and prey fusion proteins were expressed in coupled transcription translation mix. After protein expression GST-tagged bait proteins were captured at the bottom of a 96-well plate coated with anti-GST antibody. Interactions were detected using anti-HA ascites using standard immunochemical protocols. Signal was visualized using chemiluminescence. Signal was manually assigned a score between 0 and 5 and interactions that scored >2 in either configuration were scored positive (Supplementary Fig. 5 online). A detailed step-by-step protocol can be found in Supplementary Protocol 5 online.
Calculation of Confidence Score
A complete and detailed description of the statistical methods can be found in Supplementary Methods.
Supplementary Material
ACKNOWLEDGMENTS
We thank Drs. Stephen Michnick and Niroshan Ramachandran for reagents and technical help for the PCA and wNAPPA assays, respectively. We thank Dr. Alessandro Datti, Thomas Sun and Frederick Vizeacoumar from the SMART Robotics Facility at the Samuel Lunenfeld Research Institute for help implementing the robotics for the LUMIER assay. We thank all members of the Vidal, Tavernier, Roth, and Wrana laboratories for helpful discussions, Agencourt Biosciences for sequencing assistance, and Abigail Bird and Deborah Maher for administrative assistance. This work was supported by contributions from the W.M. Keck Foundation awarded to M.V., F.P.R., and D.E.H.; by the Ellison Foundation awarded to M.V.; by Institute Sponsored Research funds from the Dana-Farber Cancer Institute Strategic Initiative awarded to M.V. and CCSB; by National Institutes of Health grants 5P50HG004233 and 2R01HG001715 awarded to M.V., F.P.R., and D.E.H., R01 ES015728 awarded to M.V., 5U54CA112952 awarded to J. Nevins, Duke University, M.V. subcontract, 5U01CA105423 awarded to S.H. Orkin, DFCI, M.V. project, R01 HG003224 awarded to F.P.R., and F32 HG004098 awarded to M.T.; by an University of Ghent grant GOA12051401 and the Fund for Scientific Research Flanders grant FWO-V G.0031.06 awarded to J.T.; I.L. is a postdoctoral fellow with the FWO-V; and by a grant from Genome Canada with funds from the Ontario Genomics Institute awarded to J.L.W. M.V. is a "Chercheur Qualifié Honoraire" from the Fonds de la Recherche Scientifique (FRS-FNRS, French Community of Belgium).
Footnotes
AUTHOR CONTRIBUTIONS
P.B., M.T. and M.D. coordinated experiments and data analysis. P.B., M.D., J.M.S., J.F.R., R.R.M. and H.Y, performed high-throughput Gateway cloning. P.B., H.Y. and J.M.S. implemented, developed and analyzed wNAPPA and PCA experiments. J.F.R., K.V. and M.C. established PRSv1.0 and RRS reference sets. I.L., A.-S. de S., J.T. and K.V. coordinated, performed and analyzed MAPPIT experiments. M.B.R., L. R. and J.L.W. coordinated, performed and analyzed LUMIER experiments. M.T. and F.P.R. developed the regression model. M.V. conceived the project. M.V., T.P. J.L.W. and D.E.H. developed the concepts underlying the overall strategy. D.E.H, F.P.R., M.V. co-directed the project
REFERENCES
- 1.Barrios-Rodiles M, et al. High-throughput mapping of a dynamic signaling network in mammalian cells. Science. 2005;307:1621–1625. doi: 10.1126/science.1105776. [DOI] [PubMed] [Google Scholar]
- 2.von Mering C, et al. Comparative assessment of large-scale data sets of protein-protein interactions. Nature. 2002;417:399–403. doi: 10.1038/nature750. [DOI] [PubMed] [Google Scholar]
- 3.Yu H, et al. High-quality binary protein interaction map of the yeast interactome network. Science. 2008;322:104–110. doi: 10.1126/science.1158684. [DOI] [PMC free article] [PubMed] [Google Scholar]
- 4.Deane CM, Salwinski L, Xenarios I, Eisenberg D. Protein interactions: two methods for assessment of the reliability of high throughput observations. Mol Cell Proteomics. 2002;1:349–356. doi: 10.1074/mcp.m100037-mcp200. [DOI] [PubMed] [Google Scholar]
- 5.Ramani AK, Bunescu RC, Mooney RJ, Marcotte EM. Consolidating the set of known human protein-protein interactions in preparation for large-scale mapping of the human interactome. Genome Biol. 2005;6:R40. doi: 10.1186/gb-2005-6-5-r40. [DOI] [PMC free article] [PubMed] [Google Scholar]
- 6.Ramani AK, et al. A map of human protein interactions derived from co-expression of human mRNAs and their orthologs. Mol Syst Biol. 2008;4:180. doi: 10.1038/msb.2008.19. [DOI] [PMC free article] [PubMed] [Google Scholar]
- 7.Chiang T, et al. Coverage and error models of protein-protein interaction data by directed graph analysis. Genome Biol. 2007;8:R186. doi: 10.1186/gb-2007-8-9-r186. [DOI] [PMC free article] [PubMed] [Google Scholar]
- 8.Ito T, et al. A comprehensive two-hybrid analysis to explore the yeast protein interactome. Proc Natl Acad Sci U S A. 2001;98:4569–4574. doi: 10.1073/pnas.061034498. [DOI] [PMC free article] [PubMed] [Google Scholar]
- 9.Sato S, et al. A large-scale protein protein interaction analysis in Synechocystis sp. PCC6803. DNA Res. 2007;14:207–216. doi: 10.1093/dnares/dsm021. [DOI] [PMC free article] [PubMed] [Google Scholar]
- 10.Gavin AC, et al. Proteome survey reveals modularity of the yeast cell machinery. Nature. 2006;440:631–636. doi: 10.1038/nature04532. [DOI] [PubMed] [Google Scholar]
- 11.Krogan NJ, et al. Global landscape of protein complexes in the yeast Saccharomyces cerevisiae. Nature. 2006;440:637–643. doi: 10.1038/nature04670. [DOI] [PubMed] [Google Scholar]
- 12.Stelzl U, et al. A human protein-protein interaction network: a resource for annotating the proteome. Cell. 2005;122:957–968. doi: 10.1016/j.cell.2005.08.029. [DOI] [PubMed] [Google Scholar]
- 13.Li S, et al. A map of the interactome network of the metazoan C. elegans. Science. 2004;303:540–543. doi: 10.1126/science.1091403. [DOI] [PMC free article] [PubMed] [Google Scholar]
- 14.Rual JF, et al. Towards a proteome-scale map of the human protein-protein interaction network. Nature. 2005;437:1173–1178. doi: 10.1038/nature04209. [DOI] [PubMed] [Google Scholar]
- 15.Vidalain PO, et al. Increasing specificity in high-throughput yeast two-hybrid experiments. Methods. 2004;32:363–370. doi: 10.1016/j.ymeth.2003.10.001. [DOI] [PubMed] [Google Scholar]
- 16.Walhout AJ, Vidal M. High-throughput yeast two-hybrid assays for large-scale protein interaction mapping. Methods. 2001;24:297–306. doi: 10.1006/meth.2001.1190. [DOI] [PubMed] [Google Scholar]
- 17.Eyckerman S, et al. Design and application of a cytokine-receptor-based interaction trap. Nat Cell Biol. 2001;3:1114–1119. doi: 10.1038/ncb1201-1114. [DOI] [PubMed] [Google Scholar]
- 18.Nyfeler B, Michnick SW, Hauri HP. Capturing protein interactions in the secretory pathway of living cells. Proc Natl Acad Sci U S A. 2005;102:6350–6355. doi: 10.1073/pnas.0501976102. [DOI] [PMC free article] [PubMed] [Google Scholar]
- 19.Ramachandran N, et al. Next-generation high-density self-assembling functional protein arrays. Nat Methods. 2008;5:535–538. doi: 10.1038/nmeth.1210. [DOI] [PMC free article] [PubMed] [Google Scholar]
- 20.Venkatesan K, et al. An empirical framework for binary interactome mapping. 2008 doi: 10.1038/nmeth.1280. in press. [DOI] [PMC free article] [PubMed] [Google Scholar]
- 21.Bader GD, Betel D, Hogue CW. BIND: the Biomolecular Interaction Network Database. Nucleic Acids Res. 2003;31:248–250. doi: 10.1093/nar/gkg056. [DOI] [PMC free article] [PubMed] [Google Scholar]
- 22.Chatr-aryamontri A, et al. MINT: the Molecular INTeraction database. Nucleic Acids Res. 2007;35:D572–D574. doi: 10.1093/nar/gkl950. [DOI] [PMC free article] [PubMed] [Google Scholar]
- 23.Mishra GR, et al. Human protein reference database--2006 update. Nucleic Acids Res. 2006;34:D411–D414. doi: 10.1093/nar/gkj141. [DOI] [PMC free article] [PubMed] [Google Scholar]
- 24.Pagel P, et al. The MIPS mammalian protein-protein interaction database. Bioinformatics. 2005;21:832–834. doi: 10.1093/bioinformatics/bti115. [DOI] [PubMed] [Google Scholar]
- 25.Salwinski L, et al. The Database of Interacting Proteins: 2004 update. Nucleic Acids Res. 2004;32:D449–D451. doi: 10.1093/nar/gkh086. [DOI] [PMC free article] [PubMed] [Google Scholar]
- 26.Cusick ME, et al. Literature-curated protein interaction datasets. 2008 doi: 10.1038/nmeth.1284. in press. [DOI] [PMC free article] [PubMed] [Google Scholar]
- 27.Rual JF, et al. Human ORFeome version 1.1: a platform for reverse proteomics. Genome Res. 2004;14:2128–2135. doi: 10.1101/gr.2973604. [DOI] [PMC free article] [PubMed] [Google Scholar]
- 28.Ben-Hur A, Noble WS. Choosing negative examples for the prediction of protein-protein interactions. BMC Bioinformatics. 2006;7(Suppl 1):S2. doi: 10.1186/1471-2105-7-S1-S2. [DOI] [PMC free article] [PubMed] [Google Scholar]
- 29.Qi Y, Bar-Joseph Z, Klein-Seetharaman J. Evaluation of different biological data and computational classification methods for use in protein interaction prediction. Proteins. 2006;63:490–500. doi: 10.1002/prot.20865. [DOI] [PMC free article] [PubMed] [Google Scholar]
- 30.Vidal M, et al. Reverse two-hybrid and one-hybrid systems to detect dissociation of protein-protein and DNA-protein interactions. Proc Natl Acad Sci U S A. 1996;93:10315–10320. doi: 10.1073/pnas.93.19.10315. [DOI] [PMC free article] [PubMed] [Google Scholar]
- 31.Lemmens I, et al. Heteromeric MAPPIT: a novel strategy to study modification-dependent protein-protein interactions in mammalian cells. Nucleic Acids Res. 2003;31:e75. doi: 10.1093/nar/gng075. [DOI] [PMC free article] [PubMed] [Google Scholar]
- 32.Lemmens I, Lievens S, Eyckerman S, Tavernier J. Reverse MAPPIT detects disruptors of protein-protein interactions in human cells. Nat Protoc. 2006;1:92–97. doi: 10.1038/nprot.2006.14. [DOI] [PubMed] [Google Scholar]
Associated Data
This section collects any data citations, data availability statements, or supplementary materials included in this article.