

Abstract
Organized vibration of the vocal folds is critical to high quality voice production. When the vocal folds oscillate, the superficial tissue of the vocal fold is displaced in a wave-like fashion, creating the so called “mucosal wave”. Because the mucosal wave is dependent on vocal fold structure, physical alterations of that structure cause mucosal wave abnormalities. Visualization and quantification of mucosal wave properties have become useful parameters in diagnosing and managing vocal fold pathology. Mucosal wave measurement provides information about vocal fold characteristics that cannot be determined with other assessment techniques. Here, we discuss the benefits, disadvantages, and clinical applicability of the different mucosal wave measurement techniques, such as electroglottography (EGG), photoglottography (PGG), and ultrasound and visualization techniques that include videokymography (VKG), stroboscopy, and high-speed digital imaging (HSDI). The various techniques and their specific uses are reviewed with the intention of helping researchers and clinicians choose a method for a given situation and understand its limitations as well as its potential applications. Recent applications of these techniques for quantitative assessment demonstrate that additional research must be conducted to realize the full potential of these tools. Evaluations of existing research and recommendations for future research are given to promote both the quantitative study of the mucosal wave through accurate and standardized measurement of mucosal wave parameters and the development of reliable methods with which physicians can diagnose vocal disorders.
INTRODUCTION
Airflow through the trachea and larynx induces vocal fold vibration. This vibration consists of medial and lateral movements that produce the mucosal wave as they travel from the lower to upper vocal fold lips (Figure 1). The term was coined by Matsushita1 because the successive movements of the vocal folds, either medially or laterally, resemble waves in a fluid medium.
Figure 1.

Diagram of mucosal wave. 1. Vocal folds in closed position. 2. Air pressure column from lungs forces bottom of vibrating vocal folds to open. 3. Air pressure column continues to flow through, opening top of vocal folds. 4. “Bernouli effect” produced by air pressure column leads to closure of bottom of vocal folds. 1. Top of vocal folds also closes, and air pressure column is released through top; column converts to sound and is released as voice.
The mucosal wave is initiated by subglottal pressure against the lower vocal folds. This pressure splits open the lower vocal fold lips and continues upward until the upper lips separate. The structural properties of the vocal folds, namely the body and cover relationship, allow the mucosal wave to propagate vertically. The body consists of the thyroarytenoid muscle and lower lamina propria, while the cover consists of the mucosal epithelium and the upper lamina propria.2 In the opening phase, the deformation of the cover by the subglottal pressure allows air to pass through the vocal folds and induces the lateral movement that creates the mucosal wave. Because the lower vocal fold lips deform and move laterally before the air reaches the upper vocal fold lips, a phase difference occurs.1,3 The amplitude, phase difference, and velocity of lateral vocal fold lip movement can be measured as mucosal wave parameters.
When the upper vocal folds open, the subglottal air pressure is quickly released upward, creating a decreased pressure in the subglottal space and pulling the lower vocal folds closed, which is exacerbated by Bernoulli’s effect. The upper vocal folds follow soon after, completing the closing phase of the mucosal wave.1,4,5 During the closing phase, the elastic properties of the tissue allow the vocal folds to revert back to the glottal midline.3,6 This creates a wave that propagates in the vertical and medial directions. Mucosal wave measurement captures these movements in both the vertical and lateral planes, providing information about vocal fold characteristics that is neglected by other assessment techniques. Vocal tract irregularities or vocal fold pathologies such as vocal fold nodules, polyps, and paralysis can cause abnormalities in the mucosal wave.7,8 Irregularities in laryngeal resistance lead to abnormal pressure and flow, which may also influence mucosal wave. Thus, measuring mucosal wave parameters can help diagnose vocal fold pathology and suggest necessary treatments.
Mucosal wave may be measured through indirect imaging techniques such as electroglottography (EGG), photoglottography (PGG), and ultrasound and visualization techniques that include videokymography (VKG), stroboscopy, and high-speed digital imaging (HSDI). The advantages and disadvantages of these methods are considered, and clinical applicability is discussed. Improvements in methods, combinations of techniques, and the quantification of mucosal wave parameters in pathological vocal folds are suggested.
MUCOSAL WAVE MEASUREMENT TECHNIQUES
Indirect Imaging Techniques
Photoglottography (PGG) is a semi-invasive technique measuring glottal area.9 By measuring transillumination through a vibrating glottal aperture with a supraglottal (either transnasal or transoral) light source and a subglottal photosensor placed on the surface of the skin below the cricoid cartilage, PGG records the change in glottal area in real-time10 and thus can determine glottal opening and closing phases.11 Although transoral light sources may be relatively comfortable for the patient,12 the use of semi-invasive transnasal and pharyngeal light sources limits the clinical feasibility of PGG. The waveform measured by PGG cannot be used to describe how the upper and lower vocal fold lips or the right and left vocal folds are moving relative to one another. Thus, PGG alone does not provide information about the four vocal fold lips (upper-left, upper-right, lower-left, lower-right) and cannot determine asymmetries between them, common irregularities that are present in vocal fold pathologies. It also cannot measure mucosal wave amplitude at a certain point along the glottis because it obtains a glottal area waveform of the cumulative total of light passing through the glottis. Therefore, it cannot detect anterior-posterior asymmetry in mucosal wave motion.
Electroglottography (EGG) is a non-invasive technique that measures changes in electrical resistance between electrodes placed on the skin over the thyroid cartilage. Electrical impedance decreases as the area of vocal fold contact increases, thus EGG measures the amount of contact between the vocal folds.9,13 EGG waveforms (also called a Lx waveform) describe the duration, coordination, and relative contact patterns within the glottal cycle (Figure 2). When synchronized with videostroboscopy in normal speakers, EGG can detect the onset of glottal opening along the inferior surface of the vocal folds, which is otherwise hidden from view because it is covered by the upper vocal fold.14 When used with high-speed imaging and acoustic analysis, EGG is able to analyze irregular vibratory patterns, demonstrating its clinical applicability in analysis of pathological voice.15 Although EGG waveforms are unaffected by other activity in the vocal tract or environmental noise, they may be difficult to interpret clinically because the waveforms are easily affected by normal variations, such as mucous string across the glottis.16,17 Like PGG, EGG cannot measure mucosal wave amplitude or anterior-posterior asymmetry because it is a cumulative measure of vocal fold contact for all points along the glottis. Also, EGG and PGG do not have the ability to distinguish between the left and right vocal folds, rendering both unable to determine the direct cause of an irregularity.
Figure 2.

Filtered EGG waveform of normal subject phonation.
Color Doppler Imaging (CDI) is a non-invasive in vivo method used to measure mucosal wave velocity. The non-invasive nature of CDI makes it a clinically applicable method for measuring mean mucosal wave velocity and its relation to fundamental frequency and vocal fold stiffness.2 CDI produces color images of the mucosa-air interface, from which wavelength, fundamental frequency, and mean vertical mucosal wave velocity can be derived. By tracing the ultrasound images of the vibrating vocal fold tissue, CDI depicts the mucosal wave velocity at a specific location on the vocal folds. Vibratory disorders caused by masses on the vocal folds present irregular vibrations and disrupted mucosal wave velocities at certain points that can be measured by CDI.2
The major benefit of indirect imaging techniques over direct visualization techniques is their comparable cost-effectiveness. When used alone, indirect imaging techniques are not as useful for quantifying mucosal wave parameters as visualization techniques. However, they often provide additional information when used in conjunction with visualization techniques. For example, when synchronized with a visualization technique such as stroboscopy or HSDI, EGG can determine the initiation of the open phase,14,18,19 a parameter that is undetectable using visualization techniques alone due to hindrance by the closed upper vocal folds. In this manner, indirect imaging techniques can enhance understanding of the mucosal wave.
Visualization Techniques
Stroboscopy vs. HSDI vs. VKG
In each of the three visualization techniques discussed here, the clinician uses a rigid endoscope placed superiorly to the vocal folds to record images of vocal fold vibration (Figure 3). However, each of the techniques records vibration at a different frame rate because of the varying amounts of pixel data that they collect (Table 1). The differences between the techniques lie in the types of cameras that are used in each and how the data is analyzed after recording.
Figure 3.
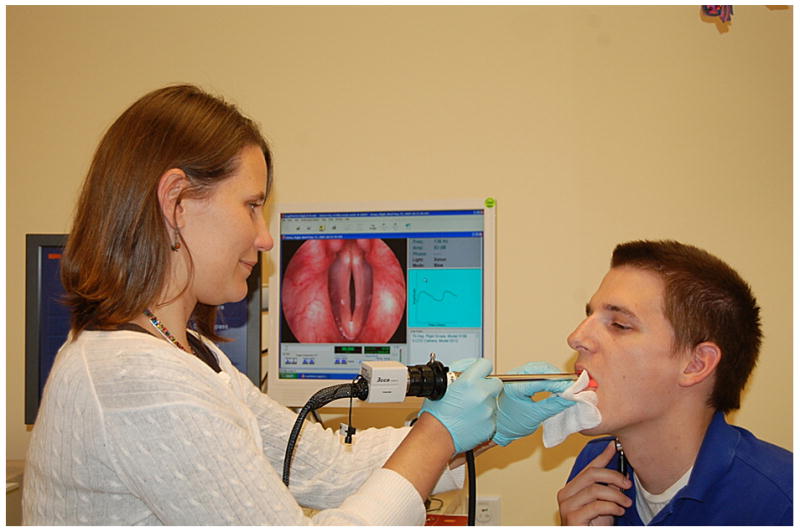
Clinical setting for endoscopic examination.
Table 1.
Comparison of current mucosal wave imaging techniques. Rows refer to different techniques, while columns describe attributes. Compared cost includes maintenance and long-term use; compared cost and compared resolution are based on a scale of 0 (least costly, lowest resolution) to 3 (most costly, highest resolution).
| Purpose | Compared Cost | Frame Rate | Compared Resolution | Best Use | |
|---|---|---|---|---|---|
| Stroboscopy | Visualization of periodic vocal fold vibration, mucosal wave patterns | 1 | 30 frames per second | 3 | Initial evaluation |
| Videokymography (VKG) | Quantitative and qualitative description of periodic and aperiodic vocal fold vibration, mucosal wave patterns | 2 | 8,000 lines per second | 1 | Supplement to stroboscopy |
| High Speed Digital Imaging (HSDI) | Detailed visualization of periodic and aperiodic vocal fold vibration, mucosal wave patterns | 3 | 4,000 frames per second | 2 | Supplement to stroboscopy |
| Electroglottography | Describes duration, coordination, relative contact patterns within glottal cycle; detects onset of glottal opening, analyzes irregular vibratory patterns | 0 | n/a | n/a | In tandem with VKG, or HSDI |
Stroboscopy is the most commonly used method to visualize vocal fold vibration.20 Stroboscopic exams are currently one of the first means used to diagnose the pathological voice because the advances in digital strobe technology have made endoscopy/stroboscopy systems highly clinically applicable. Some systems can be operated by a single clinician (KayPentax Digital Video Stroboscopy System, Model 9295; ATMOS Stroboscopy System; Medtronic ENT-5000 Video Endoscopy System). The low cost, quickness, and utility of stroboscopy make it an effective tool for first evaluation of patients. Although improved stroboscopic light sources and increased sensitivity of video cameras to light have made videostroboscopy clinically valuable, videostroboscopy has limitations that only allow it to measure mucosal wave in certain cases. Capturing 30 frames per second (fps), stroboscopy creates a slow motion illusion of vocal fold vibration by compiling images at different points of each vibratory cycle (Figure 4).21 The camera is synchronized with a strobe light so that when the light flashes, the camera captures an image of the vocal folds. Because it creates a composite image averaged over several vibratory cycles, stroboscopy can only be used to record periodic vocal fold vibration. Furthermore, because the strobe light and camera are programmed at a slightly different frequency in order to image successive points in the glottal cycle, the activation of the strobe light relies on a stable acoustic phonation frequency.22,23
Figure 4.

Montage of stroboscopic images obtained from successive points in several glottal cycles.
Another notable drawback of this system is that many voice disorders are marked by either aperiodicity or fluctuating frequency and therefore cannot be visualized with stroboscopy.24 Furthermore, because of the subjective nature of stroboscopic parameter rating systems, stroboscopists must be well trained in order to reduce variation and bias. They also must be able to detect the presence of potential pitch tracking errors of the strobe light that may result in blurry and inaccurate image sequences.23 Studies that use qualitative rating systems may not necessarily use the same rating scale. For example, one may use a five point scale to characterize the degree of presence of the mucosal wave, while another may use a three point scale. This makes it difficult to compare parameters from patients examined in different studies by different physicians, and it reduces the reliability and standardization of diagnosis of voice disorders using stroboscopy.
High speed digital imaging (HSDI) has recently become a more widely used method of mucosal wave visualization. Unlike the illusion created by videostroboscopy, the high frame rate of HSDI allows for detailed visualization of the mucosal wave (Figure 5), capturing multiple images from a single glottal cycle (Figure 6). HSDI records at a frame rate between 2000 and 5000 fps,15,20,25,26 which is significantly greater than the frequency of vocal fold vibration (100 to 300 Hz), allowing for observation of aperiodic vibration. Color HSDI systems with increased clarity and the option to record in black and white for increased sensitivity are now available, providing a more accurate image of the mucosal wave. Although the higher frame rate and number of images recorded by HSDI make it more time-consuming and costly to analyze, the visualization created by HSDI is frequency independent and therefore more effective in diagnosing aperiodic, pathological vocal fold vibrations.
Figure 5.

Montage from high speed video at 2000 frames per second. Image courtesy of KayPentax.
Figure 6.

A comparison of the sampling of images of the same mucosal wave by stroboscopy (top) and HSDI (bottom).
Several studies have been conducted to compare mucosal wave parameters extracted from images recorded using HSDI or stroboscopy, using qualitative rating systems. When comparing the accuracy of the two methods for visualizing periodic vibrations, no significant differences were found.20 However, when voice disorders were studied, including disorders resulting in aperiodic voices, HSDI proved to be significantly more accurate and interpretable than stroboscopy.24,27,28 Also, HSDI allowed for observation of phase asymmetry when stroboscopy did not. Although qualitative differences have been found between results from HSDI and stroboscopy, such assessments are susceptible to inaccuracy. The difference between the reliability of visual ratings and objective measures creates a need for quantitative measurement of mucosal wave parameters.27 A quantitative comparison of HSDI and stroboscopy may also further elucidate differences between them.
The advent of digital kymography (DKG) used along with HSDI was a major improvement to HSDI because it introduced the ability to more effectively study and potentially quantify vibration and mucosal wave parameters through kymograms. DKG uses the full frame images obtained by HSDI at 2000-5000 fps and analyzes them with computer software.27-31 This software allows the user to select a desired pixel line perpendicular to the glottal axis that is extracted from each successive frame in the video (Figure 7A). Post-recording line extraction allows for angle correction and the ability to check for blockage of the camera view by the epiglottis or arytenoid cartilage before a pixel line is selected. Once the pixel lines are extracted, they are configured consecutively side by side based on frame number. This creates a kymogram that visualizes the motion of the mucosal wave, showing the open and closed phases, periodicity, left-right symmetry, phase difference, and amplitude (Figure 7B). DKG used with HSDI provides a faster and more reliable way to obtain quantitative and qualitative results describing mucosal wave parameters than analyzing glottal cycles frame by frame with HSDI alone. Curve fitting techniques can also be used to create sine waves based on the kymogram that quantitatively describe vocal fold motion in terms of mucosal wave amplitude, phase difference, and frequency.8,31 The application of DKG to HSDI expanded the possibilities for comparing quantitative mucosal wave parameters in voice disorders exhibiting abnormal aerodynamic parameters and asymmetry.
Figure 7.

A. An image of line-scan placement at the widest section of the glottis in DKG. B. Kymogram of periodic vibration obtained using DKG. Images obtained from: Zhang Y, Krausert CR, Kelly MP, Jiang JJ. Typing vocal fold vibratory patterns in excised larynx experiments via digital kymography. Ann Otol Rhinol Laryngol. 2009;118:598-605.
Videokymography (VKG) is a more time-efficient method of measuring the mucosal wave than HSDI or DKG coupled with HSDI. VKG is conceptually similar to DKG and creates kymograms to describe mucosal wave movement. However, in VKG, charged couple device (CCD) sensor technology records a single pixel line of the overall frame perpendicular to the glottal axis (Figure 8). Unlike DKG, this single pixel line must be selected prior to recording.32 The single pixel line recorded by VKG has a much lower resolution than a typical full frame image recorded by HSDI or DKG with HSDI. The resolution of the recorded video data usually determines the frame rate.21 Because VKG does not record as much data as HSDI, and due to the low resolution of the one pixel line recorded by the CCD, the frame rate can increase substantially. The frame rate for a CCD that records y-amount of vertical pixels in one pixel line is x times faster than a camera that records y-amount of vertical pixels over x-amount of pixel lines of the frame.33 Frame rates in CCDs used in VKG reach almost 8000 fps.7,8,33-35 VKG was introduced in 1994 as a new high speed method capable of visualizing vocal fold vibration.34 Studies have qualitatively compared kymograms from several voice disorders based on left-right asymmetry, open and closed phases, propagation of mucosal wave, phase difference, amplitude, and frequency.7,34-36 Svec et al.34 demonstrated that VKG is capable of describing the vibration of hoarse or unstable voices and visualizing structural irregularities on the vocal folds. The kymogram for the hoarse voice showed prolonged glottal closure and left-right asymmetry, suggesting a partial innervations disorder on the left vocal fold. Svec et al.7 classified voice disorders into several categories based on kymogram results of vocal fold vibration characteristics. For example, they used kymograms to show how laryngeal paralysis may result in left-right amplitude asymmetry and a phase difference between the left and right vocal folds. Although these studies claim that VKG is suitable for quantitative analysis, they have only studied mucosal wave parameters qualitatively with VKG.7,31,37 Because VKG has a higher frame rate than HSDI, it can record more pictures per glottal cycle, resulting in more accurate kymograms and analysis of mucosal wave parameters (Figure 9). The single pixel line selection in VKG makes the method financially and clinically feasible because analysis is rapid. However, recording only a single pixel line while DKG with HSDI captures the entire glottal image renders VKG unable to measure anterior-posterior symmetry. Furthermore, because VKG does not record full frame images, it is impossible to observe the motion of the endoscope relative to the vocal folds. Therefore, differentiating endoscopic motion from irregular vibration displayed in the kymogram can be difficult. The drawbacks of both DKG and VKG must be considered and compared to determine which method is best suited for clinical use and diagnosis of voice disorders.
Figure 8.

Image obtained by VKG camera (left) compared with images from VKG with high-speed mode, where a single line selected from the standard image is displayed approximately 8000 times per second. Image couresy of KayPentax.
Figure 9.

VKG images of vocal folds with asymmetrical vibration (left), onset of phonation (center), and aperiodic phonation (right), examples of VKG’s ability to produce images regardless of phonatory behavior. Images courtesy of KayPentax.
Anterior-Posterior Symmetry/Multi-slice kymograms
Because VKG and single-line DKG can only select and analyze one pixel line in a kymogram, several techniques were established to study the vibration at multiple pixel lines across the glottis. In 1999, videostrobokymography was introduced when Sung et al. used digitized stroboscopic images to extract multiple pixel lines from any point of interest perpendicular to the glottal midline.38 Each selected line was used to create a kymogram, and the kymograms were analyzed to obtain open and closed quotients. The study compared open and closed quotients at different points along the anterior-posterior length of the glottis. However, the frame rate used in this method is only 30 fps. To account for the low frame rate in videostrobokymography but still maintain the benefits of visualizing vibration at several points on the glottis, multislice DKG was developed.21,29 Multislice DKG uses full frame images obtained from HSDI at 2000-5000 fps and extracts several pixel lines from each frame with computer software (Figure 10). Anterior-posterior symmetry can be measured by comparing the kymograms from each selected line.28 If the maximum glottal widths of the anterior and posterior kymograms occur at the same time, the kymograms will line up when stacked vertically, indicating that there is anterior-posterior symmetry. This expanded the ability of DKG to measure not only left-right symmetry (as is possible with VKG and single line DKG), but anterior-posterior symmetry as well. Due to its high frame rate, multislice DKG more effectively measures anterior-posterior symmetry than videostrobokymography because it can visualize aperiodic vibration. Videostrobokymography cannot create kymograms of aperiodic vibration due to its use of a stroboscope and dependence on consistent vocal fold frequency. The development of multislice DKG has created possibilities for the quantification of mucosal wave parameters at different points along the glottis as well as the diagnosis of voice disorders such as vocal fold scarring that affect motion along the anterior-posterior direction of the vocal folds.
Figure 10.

Line-scan placement at several points perpendicular to the anterior-posterior axis of the glottis and the resulting kymograms for each point obtained using multislice DKG. Image created using KayPentax KIPS Model 9181, Version 1.11.
Clinical Applicability of DKG and VKG
The normal range of fundamental frequency of vocal fold vibration is 85-155 Hz in adult males and 165-255 Hz in adult females.39 A useful imaging system that provides multiple picture frames per glottal cycle must have a much higher frame rate than the frequency of vocal fold vibration. A frame rate of 2000 fps is the minimum that is sufficient for observing vocal fold motion clearly using such a system.21 However, according to Shaw et al.40, 2000 fps is not sufficient for measuring the mucosal wave of frequencies above 200 Hz based on findings that the presence of the mucosal wave in females is detected less often than in males. Difficulty observing the mucosal wave in females occurs because less intracycle information is available due to their higher fundamental frequency. Therefore, frame rates above 2000 fps must be used for fundamental frequencies greater than 200 Hz.
Although VKG records at about 8000 fps and provides more intracycle information than any other technique, DKG frame rates between 2000 and 4000 fps21,31,40 have proven to be adequate for recording the whole range of fundamental frequencies of vocal fold vibration.21 Considering that the frame rate threshold for frequencies approaching 200 Hz is 2000 fps (10 frames per cycle),21 we can assume that 2550 fps can effectively visualize frequencies up to 255 Hz, the typical upper limit of female fundamental frequency.
Clinical applicability is determined by multiple aspects, including time efficiency, cost, and diagnostic value. Although VKG is more financially feasible and time efficient than DKG, its diagnostic value and in vivo applicability are inferior. Unlike DKG, VKG cannot create multiple kymograms of different pixel lines on the glottis simultaneously, and it does not have the luxury of post-recording angle adjustment or line selection to avoid camera blockage by the epiglottis or arytenoids cartilage. A less-expensive ($3000) high-speed system has been recently proposed with a recording speed of 1200 fps, but a relatively low resolution (336 × 96 pixels).41 This is a step towards a more clinically applicable high-speed system, although it has not yet been perfected. The quality of data that can be analyzed from images obtained using this technique has not been determined. However, the frame rate does not appear to be appropriate for analyzing the mucosal wave because the intracycle glottal information would not be definitive enough to establish accurate parameters.40
Consideration and Correction of Endoscopic Motion
All in vivo imaging techniques are susceptible to endoscopic motion that skews kymograms, causing them to shift up or down. Although one may be able to distinguish endoscopic motion from vocal fold motion through qualitative observation, these shifts would severely interrupt quantitative measurement of mucosal wave parameters with curve fitting techniques. Such errors must be corrected so that these shifts are not misinterpreted as a vocal disorder or irregular vibration. Several studies have introduced new techniques to minimize the effect of endoscopic motion and differentiate it from vocal fold motion. In 2006, Qiu and Schutte42 used two CCDs in a technique that was coined new generation VKG. One CCD, used to perform the laryngoscopy, was designated as an area CCD with a frame rate of 25 fps. The other CCD, used to perform videokymography, was designated as a line scan CCD with a frame rate of 7200 fps. The camera performing laryngoscopy showed the movement of the glottis relative to the camera, which explained the corresponding vertical shifts in the kymogram. This may prove useful in a clinical setting, because it prevents mistaken diagnosis of endoscopic motion as laryngeal pathology. However, this method does not provide more information than DKG, and it does not compensate for endoscopic motion and correct it.
DKG records the full frame images of the vocal folds and selects a pixel line to scan after the recording. Therefore, it has both the laryngoscopic images and kymograms that new generation VKG provides. In addition, DKG provides a clearer laryngoscopic image series because its frame rate is higher than that of new generation VKG’s area CCD camera. Although new generation VKG can qualitatively account for the endoscopic motion that is responsible for skewed kymograms, DKG may be more effective at compensating for endoscopic motion. In 2005, Deliyski et al.43 used endoscopic motion compensation with DKG to minimize average mean displacement and displacement range of frames (in pixels) in the anterior-posterior and left-right directions. This method allows videos to be edited to digitally negate endoscopic motion so that vocal fold vibration can be measured accurately without influence from external factors, resulting in more accurate diagnosis of voice disorders. This gives DKG a clinical advantage over VKG and new generation VKG which simply acknowledge the presence of endoscopic motion but do not correct it. Currently, this method takes between 5 and 7 minutes to perform using a 2 second video at 2000 fps. When it is commercially optimized for speed performance, it is expected to take between 6 and 30 seconds.43
FUTURE STUDIES
EGG has been used with stroboscopy to detect the opening phase of the bottom vocal fold.14,18 DKG, a more accurate visualization technique than stroboscopy because of its higher frame rate, used in synchrony with EGG15 would allow clinicians to determine the initiation of the opening phase of the mucosal wave. EGG would be especially useful in cases where an irregular vocal fold vibration initiates in the lower vocal fold, such as in cases of certain nodules, cysts and cancers, as HSDI does not provide accurate visualization of this behavior. DKG has the ability to determine which lips exhibit asymmetry, and multi-slice DKG is able to detect anterior-posterior asymmetries. These capabilities of DKG coupled with EGG’s ability to determine the vibratory patterns of the lower vocal fold lips may increase understanding of the mucosal wave and help determine the underlying causes of vibratory irregularities.
Visualization techniques have been the preferred method of diagnosis of vocal fold pathologies because they allow the physician to observe the physical structure and vibration patterns of the vocal folds. While indirect imaging techniques may provide useful quantitative information about mucosal wave velocity or glottal opening and closing patterns, this information alone may not be enough to diagnose vocal fold disorder. The observational power of visualization techniques allows physicians to detect the presence and better determine the cause of potentially abnormal patterns by observing mucosal wave behavior and the activity of each individual vocal fold along the length of the glottal axis. Visualization techniques may allow physicians to more easily use their training and judgment skills to determine the presence and identity of voice disorders. Stroboscopy is widely used in the clinic to qualitatively diagnose voice disorders.44-46 Qualitative rating systems have been used with HSDI and stroboscopy to compare mucosal wave parameters in both normal human vocal folds and those with pathologies.20,24,27,28 Mucosal wave parameters and vibration patterns have also been qualitatively described for several voice conditions in humans using kymograms derived by VKG.7,34,35 Although these methods are useful for noninvasively diagnosing voice disorders by qualitatively measuring mucosal wave patterns, they are subject to variation and human error, making results difficult to replicate and compare. For this reason, quantifying mucosal wave parameters may be a useful step towards the standardization of mucosal wave analysis, potentially providing more accurate diagnosis of voice disorders.
Jiang et al.25 quantitatively measured mucosal wave amplitude and phase difference with HSDI from an infraglottic view at 5000 fps, allowing for visualization of the mucosal upheaval on an excised larynx model. The upper and lower vocal fold positions were fitted to a curve, and the effects of thyroarytenoid contraction, changing vocal fold length, and airflow on mucosal wave amplitude, frequency, and phase difference were studied. In a similar study, Jiang et al.33 quantitatively measured the effects of elongation and subglottal pressure on mucosal wave amplitude, frequency, and phase difference using VKG with an excised larynx model. Kymograms were curve-fitted with sine waves for the upper and lower vocal fold lips to determine these parameters.
Unlike previous studies that only fitted curves to the upper and lower vocal fold lips, Jiang et al.31 used a least-squares curve fitting method for all four vocal fold lips in an excised larynx model with kymograms derived by DKG to extract the mucosal wave amplitude, frequency, and phase difference under varying subglottal pressures and line-scan positions. The ability to quantify mucosal wave parameters and test for significant differences and linear correlations between these parameters make quantitative mucosal wave measurement techniques consistent, repeatable, and valuable for distinguishing between voice disorders in a clinical setting. The curve fitting of all four vocal fold lips should be considered in future studies that quantify mucosal wave parameters with kymograms because it accounts for potential differences in mucosal wave vibration between the four vocal fold lips.
Berry et al.47 measured the vertical mucosal wave propagation and quantified the medio-lateral amplitude at different sutured tracked fleshpoints spaced 1 mm apart vertically, using HSDI and an excised canine hemilarynx. This technique, along with the previously mentioned excised larynx techniques of Jiang et al., provides valuable methods for quantitatively analyzing mucosal wave parameters under varying voice conditions, but are either too invasive to be applied to routine clinical assessment25,47 or have yet to be tested in the clinic.31,33
Svec et al.7 have qualitatively classified voice disorders based on mucosal wave parameters by comparing patient kymograms typical of each disorder. Similar classification has been done quantitatively by Qiu et al.8, who used VKG and automatic curve fitting for the upper and lower vocal fold lips. This study quantitatively measured mucosal wave amplitude, frequency, and open and closed quotients in patients with disorders including vocal fold polyps, nodules, and paralysis.8 They found much higher amplitude asymmetry values in vocal folds with disorders such as Reinke’s edema and vocal fold paralysis compared to normal vocal folds. Normal voices showed greater periodicity and more consistent speed quotients and open and closed quotients when compared to pathological voices. Such studies should be conducted with DKG, endoscopic motion compensation, and curve fitting of all four vocal fold lips. Outside of Qiu’s study, the lack of quantitative research about mucosal wave parameters, especially in clinically applicable methods, necessitates further study in which DKG and VKG are used to quantitatively visualize human vocal fold vibration. DKG is the most comprehensive form of the visualization techniques because of its high frame rate coupled with its multislice capabilities with a prerecorded high speed video. Its digital features allow it to correct for endoscopic motion and select line scan position.
Because the mucosal wave propagates in both vertical and horizontal directions, quantifying the vertical displacement is crucial for understanding the effect of pathologies on the mucosal wave. Stroboscopy, VKG, and HSDI only provide a two-dimensional image of the mucosal wave, while DKG can be used with a laser line-triangulation endoscope that is compatible with a high-speed camera to provide a complete three-dimensional profile of vocal fold vibration dynamics.48 The laser measures the absolute values of vertical and horizontal amplitude, the length and width of the vocal folds, and the opening and closing velocities of both periodic and aperiodic vibrations. The triangulation device makes use of a high-speed camera with a frame rate of 4000 fps instead of a stroboscope. This system takes advantage of HSDI’s ability to visualize complex vibrations such as those seen in paralyzed vocal folds and vocal folds affected by hoarse voice. In addition, a clinician can easily control the position of the laser line on the vocal folds by tilting the endoscope. This provides a method for determining the size of vocal fold nodules, polyps, and cysts in three dimensions48, making the triangulation device a useful tool for examinations before and after phonosurgical treatments. Future studies with this device could focus on the influence of polyps, cysts, and nodules on vocal fold vibration, such that the effects of each of these pathologies could be generalized, allowing this device to be clinically applicable as a tool to be used with phonosurgical treatments.
CONCLUSIONS
Mucosal wave behavior is a useful indicator of the quality of voice production and the presence of voice disorders. Therefore, effective measurement of the mucosal wave may help clinicians diagnose the voice conditions of their patients. Indirect imaging techniques are cost effective and enhance the understanding of the mucosal wave by providing information about mucosal wave velocity and the opening and closing patterns of the vocal folds. Because visualization techniques cannot detect the opening phase of the lower vocal fold lips, EGG may be useful in combination with them. However, the inability to differentiate between the right and left vocal folds and to assess vocal fold structure and motion along the glottal axis may render these indirect imaging techniques unable to diagnose voice disorders alone. Stroboscopy is currently the most popular clinical method of mucosal wave visualization because it can provide real-time information about abnormal vocal fold vibration. Although stroboscopy is the cheapest and most efficient method, stroboscopic examinations rely on qualitative judgments by the physician. This qualitative nature of stroboscopy, combined with potential pitch tracking errors, differences in rating scales, and the need for both periodic motion and a stable acoustic phonation frequency, hinders the establishment of objective standards to assess mucosal wave function and voice disorder using stroboscopy. DKG has the potential to overcome these limitations through its ability to quantify mucosal wave parameters by combining the high frame rate of HSDI with the kymography technique of VKG while incorporating curve fitting analysis, multiple line-scan selection, and endoscopic motion correction using its own digital features. However, in order to broaden this tool’s clinical potential, there is a need for additional research using DKG with quantitative analysis. Furthermore, if the time required to analyze high speed video is reduced, DKG may become a useful tool for physicians to accurately and objectively diagnose voice disorders.
Acknowledgments
This research was supported by NIH grant number R01 DC008850 from the National Institute on Deafness and Other Communication Disorders.
Footnotes
Publisher's Disclaimer: This is a PDF file of an unedited manuscript that has been accepted for publication. As a service to our customers we are providing this early version of the manuscript. The manuscript will undergo copyediting, typesetting, and review of the resulting proof before it is published in its final citable form. Please note that during the production process errors may be discovered which could affect the content, and all legal disclaimers that apply to the journal pertain.
References
- 1.Matsushita H. The vibratory mode of the vocal folds in the excised larynx. Folia Phoniatr (Basel) 1975;27:7–18. doi: 10.1159/000263963. [DOI] [PubMed] [Google Scholar]
- 2.Shau YW, Wang CL, Hsieh FJ, Hsiao TY. Noninvasive assessment of vocal fold mucosal wave velocity using color doppler imaging. Ultrasound Med Biol. 2001;27:1451–1460. doi: 10.1016/s0301-5629(01)00453-7. [DOI] [PubMed] [Google Scholar]
- 3.Berke GS, Gerratt BR. Laryngeal biomechanics: an overview of mucosal wave mechanics. J Voice. 1993;7:123–128. doi: 10.1016/s0892-1997(05)80341-8. [DOI] [PubMed] [Google Scholar]
- 4.Yumoto E, Kadota Y. Pliability of the vocal fold mucosa in relation to the mucosal upheaval during phonation. Arch Otolaryngol Head Neck Surg. 1998;124:897–902. doi: 10.1001/archotol.124.8.897. [DOI] [PubMed] [Google Scholar]
- 5.Yumoto E, Kadota Y, Mori T. Vocal fold vibration viewed from the tracheal side in living human beings. Otolaryngol Head Neck Surg. 1996;115:329–334. doi: 10.1016/S0194-5998(96)70047-5. [DOI] [PubMed] [Google Scholar]
- 6.Titze IR. Comments on the myoelastic - aerodynamic theory of phonation. J Speech Hear Res. 1980;23:495–510. doi: 10.1044/jshr.2303.495. [DOI] [PubMed] [Google Scholar]
- 7.Svec JG, Sram F, Schutte HK. Videokymography in voice disorders: what to look for? Ann Otol Rhinol Laryngol. 2007;116:172–180. doi: 10.1177/000348940711600303. [DOI] [PubMed] [Google Scholar]
- 8.Qiu Q, Schutte HK, Gu L, Yu Q. An automatic method to quantify the vibration properties of human vocal folds via videokymography. Folia Phoniatr Logop. 2003;55:128–136. doi: 10.1159/000070724. [DOI] [PubMed] [Google Scholar]
- 9.Baer T, Lofqvist A, McGarr NS. Laryngeal vibrations: a comparison between high-speed filming and glottographic techniques. J Acoust Soc Am. 1983;73:1304–1308. doi: 10.1121/1.389279. [DOI] [PubMed] [Google Scholar]
- 10.Habermann W, Jiang J, Lin E, Hanson DG. Correlation between glottal area and photoglottographic signal in normal subjects. Acta Otolaryngol. 2000;120:778–782. doi: 10.1080/000164800750000342. [DOI] [PubMed] [Google Scholar]
- 11.Lin E, Jiang J, Hone S, Hanson DG. Photoglottographic measures in Parkinson’s disease. J Voice. 1999;13:25–35. doi: 10.1016/s0892-1997(99)80058-7. [DOI] [PubMed] [Google Scholar]
- 12.Gerratt BR, Hanson DG, Berke GS, Precoda K. Photoglottography: a clinical synopsis. J Voice. 1991;5:98–105. [Google Scholar]
- 13.Howard DM. Electroglottography/Electrolaryngography. In: Fried, Ferlito, editors. The Larynx. 3. San Diego, Oxford, and Brisbane: Plural Publishing; 2009. pp. 227–240. [Google Scholar]
- 14.Anastaplo S, Karnell MP. Synchronized videostroboscopic and electroglottographic examination of glottal opening. J Acoust Soc Am. 1988;83:1883–1890. doi: 10.1121/1.396472. [DOI] [PubMed] [Google Scholar]
- 15.Saito M, Imagawa H, Sakakibara K, Tayama N, Nibu K, Amatsu M. High-speed digital imaging and electroglottography of tracheoesophageal phonation by Amatsu’s method. Acta Otolaryngol. 2006;126:521–525. doi: 10.1080/00016480500415613. [DOI] [PubMed] [Google Scholar]
- 16.Childers DG, Krishnamurthy AK. A critical review of electroglottography. Crit Rev Biomed Eng. 1985;12:131–161. [PubMed] [Google Scholar]
- 17.Childers DG, Hicks DM, Moore GP, Eskenazi L, Lalwani AL. Electroglottography and vocal fold physiology. J Speech Hear Res. 1990;33:245–254. doi: 10.1044/jshr.3302.245. [DOI] [PubMed] [Google Scholar]
- 18.Hertegard S, Gauffin J. Glottal area and vibratory patterns studied with simultaneous stroboscopy, flow glottography, and electroglottography. J Speech Hear Res. 1995;38:85–100. doi: 10.1044/jshr.3801.85. [DOI] [PubMed] [Google Scholar]
- 19.Qin X, Wang S, Wan M. Improving reliability and accuracy of vibration parameters of vocal folds based on high speed video and electroglottography. IEEE Trans Biomed Eng. 2009;56:1744–1754. doi: 10.1109/TBME.2009.2015772. [DOI] [PubMed] [Google Scholar]
- 20.Kendall KA. High-speed laryngeal imaging compared with videostroboscopy in healthy subjects. Arch Otolaryngol Head Neck Surg. 2009;135:274–281. doi: 10.1001/archoto.2008.557. [DOI] [PubMed] [Google Scholar]
- 21.Wittenberg T, Tigges M, Mergell P, Eysholdt U. Functional imaging of vocal fold vibration: digital multislice high-speed kymography. J Voice. 2000;14:422–442. doi: 10.1016/s0892-1997(00)80087-9. [DOI] [PubMed] [Google Scholar]
- 22.Bless DM, Hirano M, Feder RJ. Videostroboscopic evaluation of the larynx. Ear Nose Throat J. 1987;66:289–296. [PubMed] [Google Scholar]
- 23.Bless DM, Patel RS, Connor N. Laryngeal Imaging: Strobosocpy, High-Speed Digital Imaging, and Kymography. In: Fried, Ferlito, editors. The Larynx. 3. San Diego, Oxford, and Brisbane: Plural Publishing; 2009. pp. 182–191. [Google Scholar]
- 24.Patel R, Dailey S, Bless D. Comparison of high-speed digital imaging with stroboscopy for laryngeal imaging of glottal disorders. Ann Otol Rhinol Laryngol. 2008;117:413–424. doi: 10.1177/000348940811700603. [DOI] [PubMed] [Google Scholar]
- 25.Jiang JJ, Yumoto E, Lin SJ, Kadota Y, Kurokawa H, Hanson DG. Quantitative measurement of mucosal wave by high-speed photography in excised larynges. Ann Otol Rhinol Laryngol. 1998;107:98–103. doi: 10.1177/000348949810700203. [DOI] [PubMed] [Google Scholar]
- 26.Zhang Y, Jiang JJ, Tao C, Bieging E, MacCallum JK. Quantifying the complexity of excised larynx vibrations from high-speed imaging using spatiotemporal and nonlinear dynamic analyses. Chaos. 2007;17:043114. doi: 10.1063/1.2784384. [DOI] [PubMed] [Google Scholar]
- 27.Bonilha HS, Deliyski DD. Period and glottal width irregularities in vocally normal speakers. J Voice. 2008;22:699–708. doi: 10.1016/j.jvoice.2007.03.002. [DOI] [PubMed] [Google Scholar]
- 28.Bonilha HS, Deliyski DD, Gerlach TT. Phase asymmetries in normophonic speakers: visual judgments and objective findings. Am J Speech Lang Pathol. 2008;17:367–376. doi: 10.1044/1058-0360(2008/07-0059). [DOI] [PMC free article] [PubMed] [Google Scholar]
- 29.Tigges M, Wittenberg T, Mergell P, Eysholdt U. Imaging of vocal fold vibration by digital multi-plane kymography. Comput Med Imaging Graph. 1999;23:323–330. doi: 10.1016/s0895-6111(99)00030-0. [DOI] [PubMed] [Google Scholar]
- 30.Deliyski DD, Petrushev PP, Bonilha HS, Gerlach TT, Martin-Harris B, Hillman RE. Clinical implementation of laryngeal high-speed videoendoscopy: challenges and evolution. Folia Phoniatr Logop. 2008;60:33–44. doi: 10.1159/000111802. [DOI] [PubMed] [Google Scholar]
- 31.Jiang JJ, Zhang Y, Kelly MP, Bieging ET, Hoffman MR. An automatic method to quantify mucosal waves via videokymography. Laryngoscope. 2008;118:1504–1510. doi: 10.1097/MLG.0b013e318177096f. [DOI] [PMC free article] [PubMed] [Google Scholar]
- 32.Svec JG, Sram F, Schutte HK. Videokymography. In: Fried, Ferlito, editors. The Larynx. 3. San Diego, Oxford, and Brisbane: Plural Publishing; 2009. pp. 253–271. [Google Scholar]
- 33.Jiang JJ, Chang CI, Raviv JR, Gupta S, Banzali FM, Jr, Hanson DG. Quantitative study of mucosal wave via videokymography in canine larynges. Laryngoscope. 2000;110:1567–1573. doi: 10.1097/00005537-200009000-00032. [DOI] [PubMed] [Google Scholar]
- 34.Svec JG, Schutte HK, Miller DG. On pitch jumps between chest and falsetto registers in voice: data from living and excised human larynges. J Acoust Soc Am. 1999;106:1523–1531. doi: 10.1121/1.427149. [DOI] [PubMed] [Google Scholar]
- 35.Svec JG, Schutte HK. Videokymography: high-speed line scanning of vocal fold vibration. J Voice. 1996;10:201–205. doi: 10.1016/s0892-1997(96)80047-6. [DOI] [PubMed] [Google Scholar]
- 36.Schutte HK, Svec JG, Sram F. First results of clinical application of videokymography. Laryngoscope. 1998;108:1206–1210. doi: 10.1097/00005537-199808000-00020. [DOI] [PubMed] [Google Scholar]
- 37.Qiu Q, Schutte H. Real-time kymographic imaging for visualizing human vocal-fold vibratory function. Rev Sci Instrum. 2007;78:024302. doi: 10.1063/1.2430622. [DOI] [PubMed] [Google Scholar]
- 38.Sung MW, Kim KH, Koh TY, Kwon TY, Mo JH, Choi SH, Lee JS, Park KS, Kim EJ, Sung MY. Videostrobokymography: a new method for the quantitative analysis of vocal fold vibration. Laryngoscope. 1999;109:1859–1863. doi: 10.1097/00005537-199911000-00027. [DOI] [PubMed] [Google Scholar]
- 39.Baken RJ, Orlikoff RF. Clinical Measurement of Speech and Voice. 2. San Diego, CA: Singular Publishing Group; 2000. [Google Scholar]
- 40.Shaw HS, Deliyski DD. Mucosal wave: a normophonic study across visualization techniques. J Voice. 2008;22:23–33. doi: 10.1016/j.jvoice.2006.08.006. [DOI] [PubMed] [Google Scholar]
- 41.Sekimoto S, Tsunoda K, Kaga K, Makiyama K, Tsunoda A, Kondo K, Yamasoba T. Commercially available high-speed system for recording and monitoring vocal fold vibrations. Acta Otolaryngol. 2009;13:1–3. doi: 10.3109/00016480802691168. [DOI] [PubMed] [Google Scholar]
- 42.Qiu Q, Schutte HK. A new generation videokymography for routine clinical vocal fold examination. Laryngoscope. 2006;116:1824–1828. doi: 10.1097/01.mlg.0000233552.58895.d0. [DOI] [PubMed] [Google Scholar]
- 43.Deliyski DD. Endoscope motion compensation for laryngeal high-speed videoendoscopy. J Voice. 2005;19:485–496. doi: 10.1016/j.jvoice.2004.07.006. [DOI] [PubMed] [Google Scholar]
- 44.Hartnick CJ. Pediatric video laryngo-stroboscopy. Int J Pediatr Otorhinolaryngol. 2005;69:215–219. doi: 10.1016/j.ijporl.2004.08.021. [DOI] [PubMed] [Google Scholar]
- 45.Mirza N. Laryngeal findings in users of combination corticosteroid and bronchodilator therapy. Larygoscope. 2004;114:1566–1569. doi: 10.1097/00005537-200409000-00012. [DOI] [PubMed] [Google Scholar]
- 46.Haben CM, Kost K, Papagiannis G. Mucosal wave asymmetries in the clinical voice laboratory. J Otolaryngol. 2002;31:275–280. doi: 10.2310/7070.2002.43298. [DOI] [PubMed] [Google Scholar]
- 47.Berry A, Foin O, Szabo JP. Three-dimensional elasticity model for a decoupling coating on a rectangular plate immersed in a heavy fluid. J Acoust Soc Am. 2001;109:2704–2714. doi: 10.1121/1.1372224. [DOI] [PubMed] [Google Scholar]
- 48.George NA, de Mul FF, Qiu Q, Rakhorst G, Schutte HK. Depth kymography: high-speed calibrated 3D imaging of human vocal fold vibration dynamics. Phys Med Biol. 2008;53:2667–2675. doi: 10.1088/0031-9155/53/10/015. [DOI] [PubMed] [Google Scholar]