Abstract
In fibroblasts, beryllium salt causes activation of the p53 transcription factor and induction of a senescence-like state. It is not known whether Be2+ can affect the proliferation of cancer cells, which are generally unsusceptible to senescence. A172 glioblastoma and RKO colon carcinoma cell lines each have wildtype p53, so these cell types have the potential to be responsive to agents that activate p53. In A172 cells, BeSO4 produced a G0/G1-phase cell cycle arrest and increased expression of senescence-associated β-galactosidase, an enzymatic marker of senescence. BeSO4 caused phosphorylation of serine-15 of p53, accumulation of p53 protein, and expression of p21, the cyclin-dependent kinase inhibitor that is prominent during senescence. BeSO4 inhibited A172 growth with an IC50 = 4.7 µM in a 6-day proliferation assay. In contrast, BeSO4 had no effect on RKO cells, even though Be2+ uptake was similar for the two cell types. This differential responsiveness marks BeSO4 as a reagent capable of activating a separable branch of the p53 signaling network. A172 and RKO cells are known to exhibit p53-dependent upregulation of p21 in response to DNA damage. The RKO cells produced high levels of p21 when exposed to DNA damaging agents, yet failed to express p21 when treated with BeSO4. Conversely, BeSO4 did not cause DNA damage in A172 cells, yet it was a potent inducer of p21 expression. These observations indicate that the growth control pathway affected by BeSO4 is distinct from the DNA damage response pathway, even though both ultimately converge on p53 and p21.
Keywords: Beryllium sulfate, Cell cycle arrest, Senescence, p53, Glioma
Introduction
Replicative senescence occurs when cells reach a certain “age”, beyond which they cease dividing. Telomere structure serves as the basis for the molecular clock that determines cellular age in this context. Telomere length decreases with successive rounds of cell division in most somatic cells, because the ends of the chromosome cannot be completely replicated. The ensuing changes in telomere structure activate a signaling cascade that triggers p53-dependent senescence (Itahana et al. 2001). One of the major targets of the p53 transcription factor is the CDKN1A gene, whose product p21 is a cyclin-dependent kinase inhibitor that blocks cell cycle progression (Bartek and Lukas 2001). p21 is highly elevated in senescent cells (Noda et al. 1994). Senescence-associated β-galactosidase activity (SA-β-gal) is a biomarker used to aid identification of the senescent state. SA-β-gal can be observed histochemically (Dimri et al. 1995) or quantified via enzymatic assay (Coates et al. 2007; Gary and Kindell 2005).
Beryllium salts inhibit fibroblast cell division when added to standard culture medium at low micromolar concentration (Hart et al. 1982). The senescence markers p53, p21, p16, and SA-β-gal are expressed in young human fibroblasts after treatment with BeSO4 (Coates et al. 2007; Lehnert et al. 2001). Chromatin immunoprecipitation experiments show that Be2+ causes p53 to associate with the promoter region of the CDKN1A gene (Coates et al. 2007). These results suggest that Be2+ may effect p53 activation in a manner similar to that seen during senescence. Senescence occurs spontaneously when fibroblasts age, so this cell type is prone to this type of growth control. Thus far, the cytostatic effects of Be2+ have been studied in fibroblasts only. It is not known how other cell types would respond to this agent. Most cultured cell lines are derived from tumors. Such cells do not undergo spontaneous senescence, because they express telomerase (Shay and Gazdar 1997), which counteracts telomere shortening.
Depending on the circumstances leading to its activation, p53 can direct cellular physiology toward senescence, apoptosis, or the DNA damage response. However, there appears to be considerable crosstalk between the upstream pathways leading to p53 activation, because sometimes DNA damage triggers apoptosis or senescence. Cells with wildtype p53 were used to investigate tumor cell responsiveness to beryllium. RKO human colon carcinoma cells possess a wildtype p53 gene sequence (Liu and Bodmer 2006), and show a typical p53 response when challenged with genotoxins. The presence of a normal DNA damage response shows that at least a portion of the p53 network is operational, increasing the likelihood that the senescence-related functions of the network could be activated as well. RKO cells respond to a variety of DNA damaging agents and other physiological stresses via p53-dependent apoptosis or p53-dependent upregulation of p21 and cell cycle arrest (Beard et al. 1996; Li et al. 2001; Potapova et al. 2000; Wang et al. 2000; Zhan et al. 1993). Different types of DNA damage are created by ionizing radiation (IR), which produces DNA strand breaks and oxidative damage, and ultraviolet (UV) light, which creates cyclobutane pyrimidine dimers. In RKO cells, the cell cycle effects produced by IR and UV treatment are p53-dependent (DeWeese et al. 1997; Franken et al. 2004; Gorospe et al. 1998; Kessis et al. 1993; Seol et al. 1999). A172 human glioblastoma cells were also selected for study, because they have a wildtype p53 gene sequence (Ishii et al. 1999; Mirzayans et al. 2005) and they exhibit wildtype p53 activity in a genetic functional assay (Jia et al. 1997). Like RKO cells, A172 cells increase p53 and p21 levels in response to IR (Hara et al. 2008; Kubota et al. 2000; Mirzayans et al. 2005).
In this report, it is shown that low concentrations of BeSO4 elicit a senescence-like cell cycle arrest in A172 cells. In contrast, RKO cells were found to be impervious to Be2+, demonstrating that the Be2+-sensitive pathway is not operational in some cell types. The failure of RKO cells to respond to Be2+ despite the presence of functional DNA damage signaling indicates that Be2+ and UV/IR operate through distinct and separable routes that lead to p53 activation and p21 transcription.
Materials and methods
Cell lines and reagents
RKO (human colon carcinoma) and A172 (human glioblastoma) cells were from ATCC (Manassas, VA). Cells were grown in RPMI 1640 with Gluta-MAX and 25 mM HEPES (Invitrogen-Gibco) supplemented with 10% FBS (HyClone) and 1× Antibiotic–Antimycotic (Invitrogen-Gibco) at 37°C in a 5% CO2 atmosphere, with passage or media change every 2–3 days. Cell counts were done using a Beckman Coulter Z1 counter. BeSO4·4H2O was from Fluka (a division of Sigma-Aldrich).
mRNA measurement by RT-PCR
UV light was delivered from a calibrated 254 nm source. Ionizing radiation was delivered from a Faxitron RX-650 system (Faxitron X-Ray LLC). RNA from treated cells was isolated on an RNeasy column, cDNA was synthesized using reverse transcriptase, and Real Time-PCR was conducted using QuantiTect SYBR Green PCR reagents with primer sets QT00095431, QT00079247, QT00062090 for human beta-actin, human GAPDH, and human p21(CDKN1A), respectively, (all from Qiagen) on a Bio-Rad iCycler. For each gene-specific primer set, PCR efficiency was determined empirically and used to calculate the Starting Quantity (SQ) of gene-specific mRNA in each sample. Experimental mRNAs (p21 and GAPDH) were normalized against actin mRNA, which served as a reference gene. Because ratios (e.g. SQexp/SQactin) do not yield normal distributions, the SQ values were transformed to a log scale (Gilsbach et al. 2006), and the value of the difference (log SQexp − log SQactin) was used for statistical analysis. The term [(log SQexp − log SQactin)treated − average of (log SQexp − log SQactin)control] was used as the basis for calculations of the means and standard deviations of treated samples, expressed as percent of control. After statistical analysis, antilogs were taken for (mean), (mean + SD), and (mean − SD) to back-transform the results to the original scale (SQexp/SQactin, i.e. quantity of actin-normalized mRNA) for graphical display. Due to the ratio nature of the y-axis, error bars generated in this way are not equidistant above and below the mean. In such a system, it is recommended that the variation be reported as a confidence interval in the original scale (Bland and Altman 1996; Olivier et al. 2008). A 77% confidence interval was chosen because this corresponds to the mean ± one SD for experiments where n = 3, according to the equation for small-sample confidence interval (Mendenhall 1983): CI = mean ± (tα/2) (SD/n1/2). This equations shows that CI = mean ± SD when (tα/2) = n1/2. When n = 3, n1/2 = 1.73. For a system with 2° of freedom, the t score = 1.73 when (α/2) = 0.113. Therefore, α = 0.226, which corresponds to a confidence interval of approximately 77%.
Measurement of protein expression by western blotting
Cells were grown in 100 mm plates, treated, washed, and lysed by addition of 300 µl of M-PER (Mammalian Protein Extraction Reagent, Pierce) supplemented with protease and phosphatase inhibitors. An aliquot of lysate was set aside for determination of total protein concentration using a bicinchoninic acid (BCA) assay (Pierce). A constant amount of protein (typically 30 µg protein/well) was run on SDS-PAGE and transferred to PVDF, and immunoblotting was conducted using anti-p53 mouse monoclonal (sc-126, clone DO-1), anti-p21 mouse monoclonal (sc-6246, clone F-5), anti-actin goat polyclonal (sc-1615) antibodies (Santa Cruz Biotechnology), or anti-phospho (Ser15)p53 rabbit polyclonal antibody (#9284, Cell Signaling Technology), with appropriate HRP-conjugated secondary antibodies. Blots were developed with ECL Plus reagent (GE Healthcare) and imaged on a Typhoon Variable Mode Imager set to scan in fluorescence mode with a 457 nm laser and emission at 520 nm. For histone analysis, cells were lysed in phosphate buffered saline containing 0.5% Triton X-100 with protease and phosphatase inhibitors. The low speed pellet was washed, then histones were released by acid extraction using an overnight incubation in 0.2 M HCl at 4°C. Total protein was measured using the BCA assay, and samples were neutralized with Tris base prior to electrophoresis. The nuclear extracts (5 µg total protein per lane) were analyzed by Western blotting using anti-γ-H2AX rabbit polyclonal antibody (# DR1017, Calbiochem).
SA-β-gal assay
Protein-normalized SA-β-gal activity was quantified using the fluorogenic substrate 4-methylumbelliferyl-β-D-galactopyranoside as previously described (Gary and Kindell 2005), except that the BCA assay was used for protein normalization.
Cell cycle analysis by flow cytometry
Cells were fixed with 70% ethanol, permeabilized with 1% Triton X-100, treated with RNase, and stained with 50 µg/ml propidium iodide (PI). Cellular DNA content was determined from PI fluorescence intensity using a Becton–Dickinson FACSCalibur flow cytometer and ModFit data analysis software for cell cycle determination.
DNA synthesis rate and total DNA content
Cellular DNA synthesis rate was measured from the incorporation of 5-bromo-2′-deoxyuridine (BrdU), a thymidine analog, as assessed using an in situ ELISA assay. Cells were grown in the presence or absence of BeSO4 for 72 h. For the first 64 h, the cells were grown in 100 mm plates (n = 3/dosage group). Next, the cells were collected by trypsinization, counted, and re-seeded into 96-well plates at 27,000 cells per well. Each sample was re-plated as two sets of triplicate wells (one set for BrdU assay, the other set for total DNA assay). During re-plating, the concentration of BeSO4 was maintained. The cells were given 8 h at 37°C to attach in the 96-well plates, making 72 h total treatment time. At 72 h, the culture medium in one of the triplicate sets was replaced with fresh medium lacking Be2+ and containing the BrdU label. BrdU incorporation over the next 3.5 h at 37°C was measured using a Cell Proliferation Assay (EMD Biosciences/Calbiochem). Cells were washed, fixed, incubated with anti-BrdU primary and enzyme-linked secondary antibodies, then reacted with a fluorogenic substrate. The fluorescence was measured using a plate reader set to 340 nm excitation, 465 nm emission. Each triplicate was averaged to give a single value for each of the original 100 mm plates (n = 3). Total DNA content was analyzed similarly, after staining the other sets of triplicate wells with the CyQuant fluorescent DNA-binding dye (Invitrogen) and reading at 485 nm excitation, 535 nm emission.
Immunofluorescence microscopy
A172 cells were grown in chamber slides, and treated with BeSO4 or etoposide for 24 h. Cells were fixed with 4% formaldehyde, permeabilized with 0.5% Triton X-100, blocked with normal goat serum, and incubated with 1:400 anti-γ-H2AX antibody (Calbiochem # DR1017), a rabbit polyclonal that recognizes phosphorylation at Ser139 of human H2AX. FITC-conjugated goat anti-rabbit IgG (sc-2012, Santa Cruz Biotechnology) was used as the secondary antibody, and fluorescence images were photographed using a digital camera on a Nikon Eclipse TE2000-U microscope.
Elemental analysis by ICP-MS
Cells were grown in 100 mm dishes at 37°C in RPMI complete medium spiked with BeSO4 and MnSO4 (n = 3/dose) for either 1 min, 24 h, or 48 h. The cells were washed three times with serum-free RPMI, three times with PBS, then lysed with 300 µl of M-PER. The lysate was centrifuged at 16,000×g for 10 min, then 250 µl of supernatant was mixed with 19.75 ml of ultrapure water. Each sample was passed through a pre-rinsed 0.45 µm GHP Acrodisc GF 25 mm syringe filter (Pall Life Sciences) and analyzed by Inductively Coupled Plasma Mass Spectrometry (ICP-MS) on a Perkin-Elmer ELAN 6100 equipped with a Dynamic Reaction Cell. The concentrations of Be-9 and Mn-55 in each sample were determined from BeSO4 and MnSO4 standards that were used to generate a standard curve. An aliquot from each clarified supernatant was analyzed for total protein content using the BCA protein assay. Data were expressed as pmol of Be or Mn per µg of total protein.
Statistical analysis
Data sets involving only two groups per timepoint (control versus treated) were analyzed as pairwise comparisons using a two-tailed unpaired t-test with Bonferroni correction. Data sets involving more than two groups per timepoint were evaluated using one-way ANOVA (P < 0.05 considered significant) with a post-hoc Tukey multiple comparison test (Graph-Pad Prism v5.0) to obtain P values comparing each dosage group to its corresponding control group. For actin-normalized mRNA ratios, the log-transformed values were used for the statistical analysis.
Results
Beryllium inhibits proliferation in a cell type-specific manner
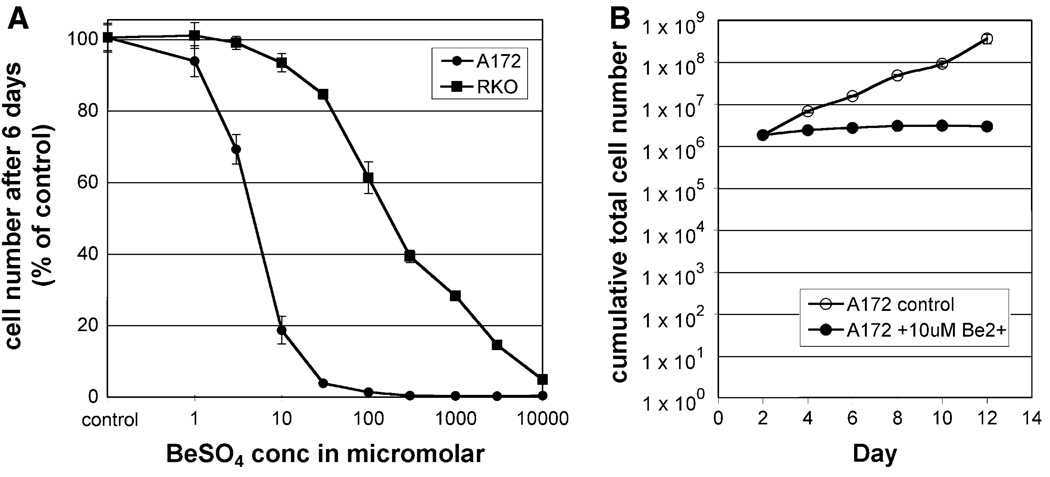
For A172 cells, adding low micromolar concentrations of Be2+ to the culture medium caused a marked inhibition of growth (Fig. 1a). In contrast, RKO cells were much less sensitive to this agent. In this 6-day proliferation assay, the A172 IC50 was 4.7 µM, and the RKO IC50 was 172 µM. The shape of the dose–response curve was steeper for A172 than for RKO, reflecting a relative tolerance for high Be2+ concentrations in the latter. For example, in order to produce an effect equivalent to 10 µM in A172 cells, a 300× higher concentration (3 mM) was needed for RKO cells. When A172 cells were exposed to 10 µM BeSO4, they grew slightly during the first 48 h, then cumulative cell number remained fairly constant over a 2–12 day period (Fig. 1b, filled circles), indicating a cytostatic effect. In contrast, when A172 cells were exposed to etoposide, a cytotoxic drug, cumulative cell number declined over time in this assay (Supplementary Fig. S1). As expected, untreated cells grew at a logarithmic rate (Fig. 1b, open circles).
Fig. 1.
Low concentration BeSO4 inhibits the proliferation of A172 cells, but not RKO cells. a A172 (circles) and RKO (squares) were cultured in the presence of 0, 1, 3, 10, 30, 100, 300, 1000, 3000, or 10000 µM BeSO4 for 6 days, then cells were counted and expressed as percent of untreated cell number (mean ± SD). b A172 cells were grown in the absence (open circles) or presence (filled circles) of 10 µM BeSO4 for 12 days, with cumulative cell number (mean ± SD) determined every 2 days. Cytostasis requires a day or two to develop fully, so the cells were re-seeded on Day 2 using matched cell numbers for each group
Beryllium induces the p21 cell cycle inhibitor
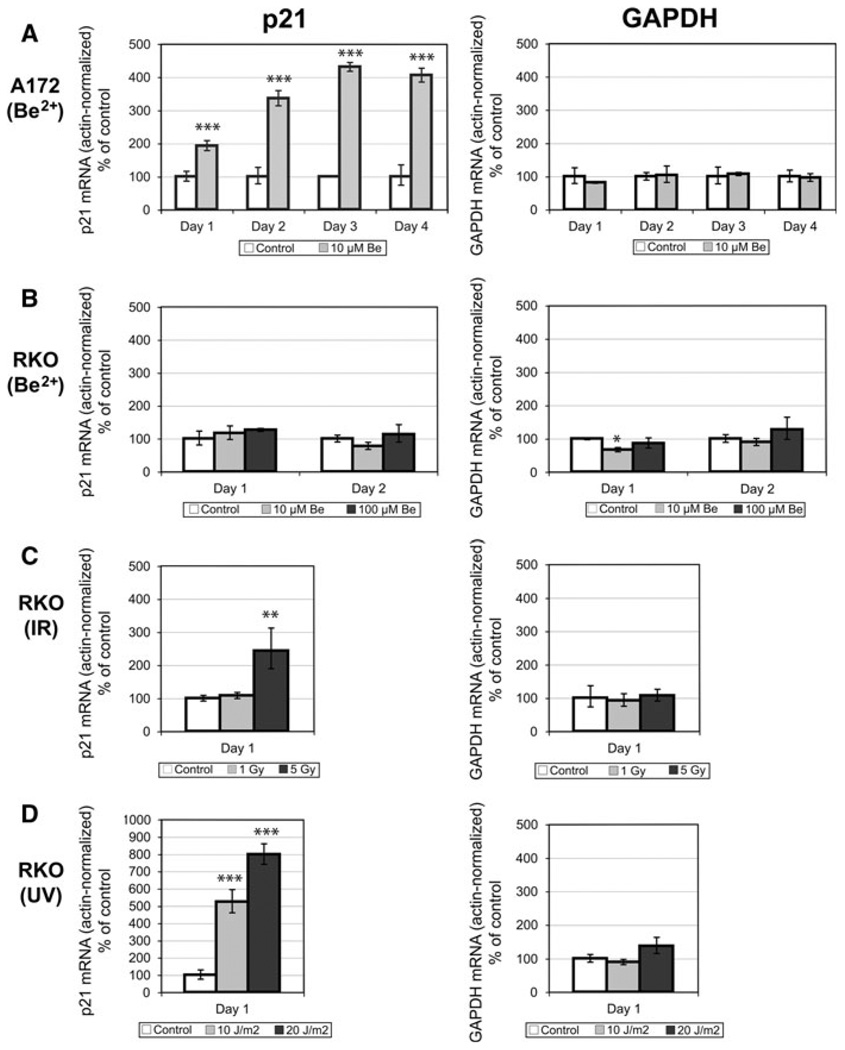
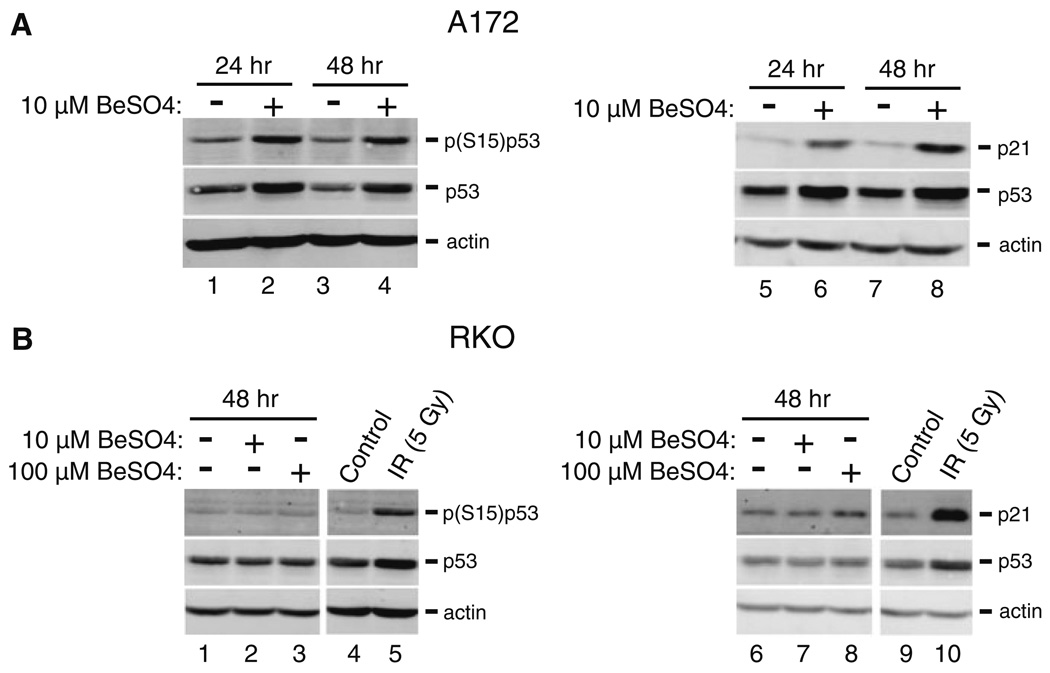
Treatment of A172 cells with 10 µM BeSO4 caused p21 mRNA levels to increase 2-fold by 24 h, and to remain elevated over several days with up to 4-fold increases (Fig. 2a). For comparison, mRNA for glyceraldehyde-3-phosphate dehydrogenase (GAPDH), a glycolytic enzyme that is usually produced at a constant rate, showed no changes in the same set of samples. Phosphorylation of serine-15 is a modification that stabilizes p53 protein against degradation. Beryllium treatment caused increases in total p53, phosphorylated p53, and p21 protein levels in A172 cells (Fig. 3a). In contrast, RKO cells displayed no changes in p21 or p53 when treated with 10 or even 100 µM BeSO4 (Figs. 2b, 3b). To confirm that the RKO cells were capable of responding with p21 induction when challenged with the appropriate stimuli, these cells were exposed to ionizing radiation or UV light. Each of these treatments caused large increases in p21 mRNA (Fig. 2c, d). There was no change in GAPDH mRNA in these samples. Additionally, RKO cells were exposed to 5 Gy of IR to check protein expression and the expected increases in p21 and p53 protein levels were observed (Fig. 3b).
Fig. 2.
BeSO4 induces production of p21 mRNA in A172 cells, but not in RKO cells. a A172 cells were cultured in the presence of 0 or 10 µM BeSO4 for 24, 48, 72, or 96 h, then mRNA levels of p21, GAPDH, and actin in each sample were quantified using RT-PCR. Actin and GAPDH are considered to be “housekeeping” genes whose mRNA amount per cell is expected to remain relatively constant. p21 and GAPDH mRNA quantities were normalized relative to actin mRNA by dividing the former by the latter. Results are reported as percent of the untreated control. Error bars bracket a confidence interval that is equivalent to the mean ± SD (explained in the “Methods” section). b RKO cells were cultured in the presence of 0, 10, or 100 µM BeSO4 for 24 or 48 h, then mRNA levels of p21, GAPDH, and actin in each sample were quantified using RT-PCR and expressed as actin-normalized values. c RKO cells were either sham-irradiated (control) or exposed to 1 or 5 Gy of ionizing radiation (IR), then actin-normalized p21 and GAPDH mRNA were quantified 24 h later. d RKO cells were either sham-irradiated (control) or exposed to 10 or 20 J/m2 of ultraviolet light (UV), then mRNA levels were quantified 24 h later. Treatments that were significantly different from control are indicated (* P < 0.05, ** P < 0.01, *** P < 0.001)
Fig. 3.
BeSO4 induces stabilization of p53 and expression of p21 in A172 cells, but not in RKO cells. a A172 cells were grown in the absence (lanes 1, 3, 5, and 7) or presence (lanes 2, 4, 6, and 8) of 10 µM BeSO4 for 24 or 48 h. Protein levels of p21, total p53, serine-15 phosphorylated p53, and actin were analyzed by Western blotting. The same amount of total protein was loaded in each lane; actin serves as a loading control. b RKO cells were grown in 0 (lanes 1 and 6), 10 (lanes 2 and 7) or 100 µM (lanes 3 and 8) BeSO4 for 48 h. Alternatively, RKO cells were either sham-irradiated (lanes 4 and 9) or exposed to 5 Gy of ionizing radiation (lanes 5 and 10)
Characterization of beryllium-arrested cancer cells
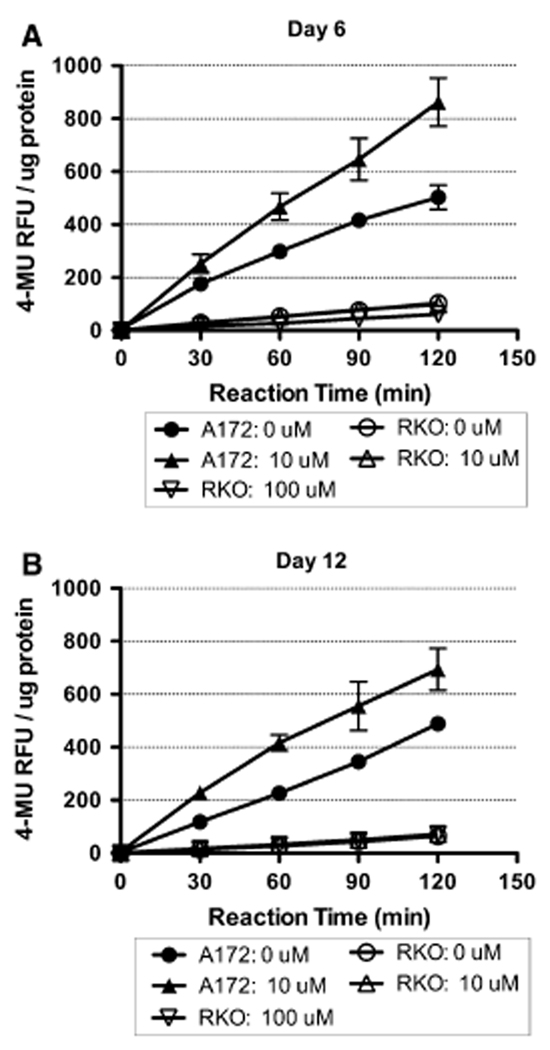
BeSO4 caused an increase in the senescence marker SA-β-gal in A172 cells (Fig. 4). During the enzyme assay, product formation was linear with reaction time over the first 60 min, then the reaction rate declined slightly in some samples due to the onset of substrate depletion. Therefore, reaction rate over the first hour was used as the basis for reporting activity. After 6 days of culture, A172 cells displayed a 56% increase in SA-β-gal activity in response to 10 µM BeSO4 (control = 299 ± 14; Be2+-treated = 467 ± 51 RFU h−1 µg−1). After 12 days of culture, there was an 84% increase in activity with 10 µM BeSO4 (control = 226 ± 21; Be2+-treated = 416 ± 30 RFU h−1 µg−1). In contrast, basal activity in RKO cells was quite low (ranging from 30 to 50 RFU h−1 µg−1), and was not stimulated by treatment with 10 or 100 µM BeSO4.
Fig. 4.
BeSO4 treatment causes expression of SA-β-gal in A172 cells, but not in RKO cells. a A172 cells were cultured in the presence of 0 or 10 µM BeSO4 for 6 days. RKO cells were cultured in the presence of 0, 10, or 100 µM BeSO4 for 6 days. The cells were lysed, and the activity of SA-β-gal was assayed by measuring the production of the fluorescent product 4-methylumbelliferone (4-MU) at 30 min intervals during the reaction. Data are expressed as mean ± SD in relative fluorescence units (RFU) of product per microgram of total protein. b SA-β-gal activity measured in A172 and RKO cells after 12 days of treatment
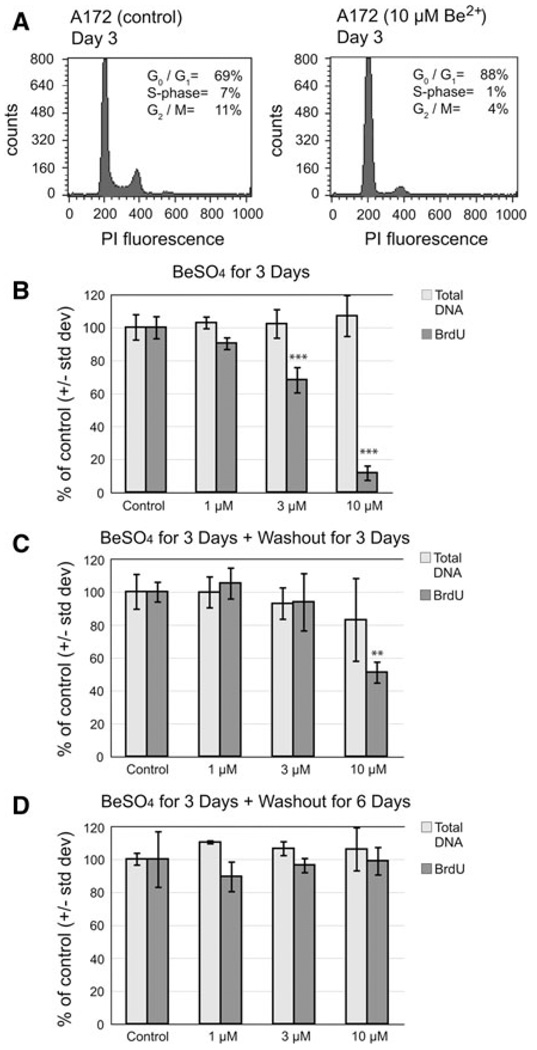
For A172 cells, 10 µM BeSO4 was found to be an effective concentration with respect to cell growth (Fig. 1), p21 mRNA and protein induction (Figs. 2, 3), and SA-β-gal expression (Fig. 4). Flow cytometry was used to analyze the effects of this treatment on cell cycle progression (Fig. 5a). The Be2+-arrested cells displayed an increase in the proportion of cells in G0/G1-phase and a decrease in S and G2-phases, consistent with a block at the G1-to-S transition. A172 cells were treated for 3 days with various concentrations of BeSO4, then the thymidine analog BrdU was added and its rate of incorporation into newly synthesized DNA was measured (Fig. 5b). Exposure to 3 µM BeSO4 lowered the DNA synthesis rate to 68 ± 8% of control (mean ± SD), while 10 µM BeSO4 lowered the rate to 12 ± 4% of control. Measurement of total DNA content confirmed that similar numbers of cells were analyzed for each dosage group. To determine whether the cells would resume DNA synthesis after beryllium is removed, samples of surplus unused cells from the 3-day BeSO4 treatments were re-plated into fresh medium without BeSO4 and allowed to grow for three more days (Fig. 5c). After this period, the cells that had been exposed to 10 µM BeSO4 only partially recovered their ability to synthesize DNA, with a rate of 51 ± 6% compared to cells that had never been exposed to BeSO4. After 6 days of recovery in Be-free media, the cells finally returned to their normal rate of DNA synthesis, at 99 ± 8% (Fig. 5d).
Fig. 5.
BeSO4 exposure causes sustained depression of DNA synthesis in A172 cells. a Cell cycle analysis was conducted on A172 cells treated for 3 days with 0 µM (left panel) or 10 µM (right panel) BeSO4. Cells were stained with propidium iodide (PI) and fluorescence measured by flow cytometry. A total of 40,000 events were recorded per sample. Representative histograms are shown. G1 and G2 peaks were centered at approximately 200 and 400 PI fluorescence units, respectively. b A172 cells were cultured in the presence of 0, 1, 3, or 10 µM BeSO4 for 3 days. A standard number of cells from each treatment group were analyzed for total DNA content using a fluorescent DNA-binding dye, and DNA synthesis rate using BrdU incorporation. c A172 cells were cultured in the presence of 0, 1, 3, or 10 µM BeSO4 for 3 days, then BeSO4 was washed out and all cells were cultured for three additional days in the absence of beryllium. At the end of the 3-day recovery period, cells were analyzed for total DNA content and BrdU incorporation rate. d A172 cells were cultured in the presence of 0, 1, 3, or 10 µM BeSO4 for 3 days, then grown for six additional days without beryllium. Data are expressed as mean ± SD, relative to the untreated control cells. Treatments that were significantly different from control are indicated (* P < 0.05, ** P < 0.01, *** P < 0.001)
Beryllium does not cause DNA damage
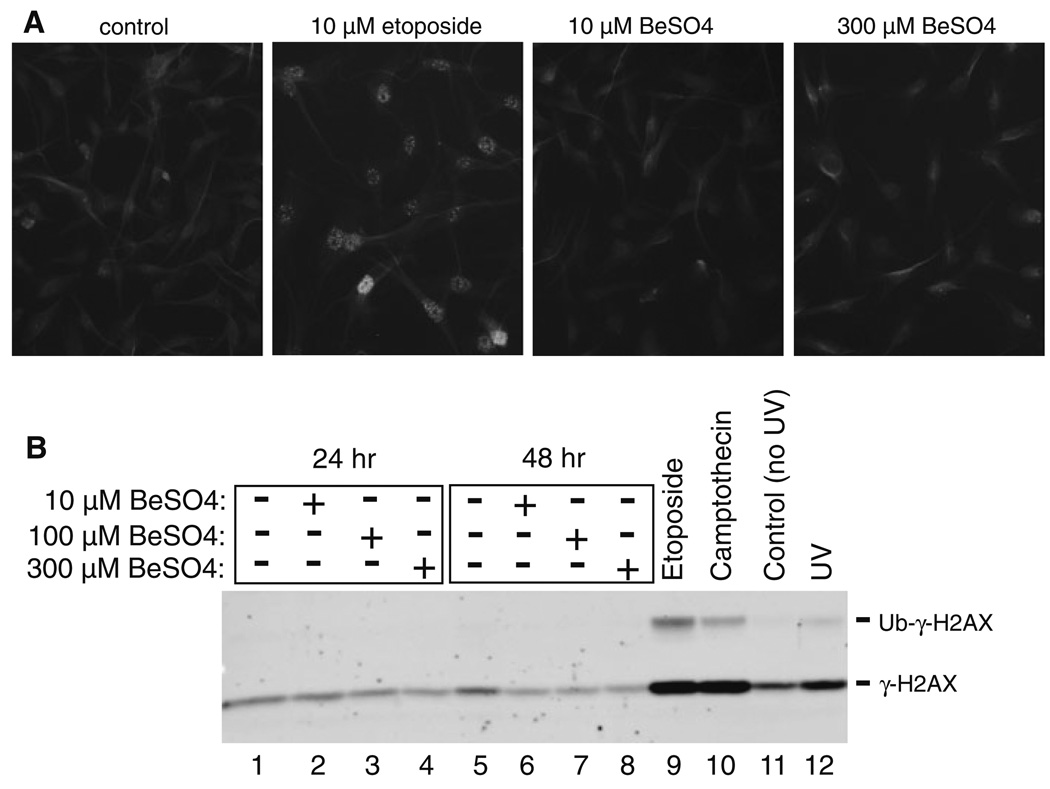
DNA damage causes histone H2AX to become phosphorylated on serine-139. This modified histone form is called γ-H2AX, which can be observed by immunofluorescence microscopy or by Western blot (Fig. 6). Etoposide, camptothecin, and UV treatments were used as positive controls to demonstrate that γ-H2AX is produced in A172 cells following DNA damage. In contrast, BeSO4 did not elicit increased γ-H2AX at 10 µM (an effective cytostatic concentration), 100 µM, or 300 µM (the highest concentration tested).
Fig. 6.
BeSO4 treatment does not cause DNA damage. a Immunofluorescence microscopy using γ-H2AX antibody on untreated A172 cells or cells exposed to 10 µM etoposide, 10 µM BeSO4, or 300 µM BeSO4 for 24 h. The punctate nuclear staining pattern observed in etoposide-treated cells is characteristic of foci induced by DNA damage. b A172 cells were grown in the presence of 0, 10, 100, or 300 µM BeSO4 for 24 or 48 h, or 10 µM etoposide or 10 µM camptothecin for 24 h. Alternatively, A172 cells were either sham-irradiated (UV control) or exposed to 10 J/m2 of UV at 3 h prior to analysis. Nuclei were isolated and histones were released by acid extraction. The nuclear extracts (5 µg total protein per lane) were analyzed by Western blotting using the γ-H2AX antibody. The positions of γ-H2AX (15 kD) and ubiquitinated-γ-H2AX (24 kD) are indicated
Beryllium uptake
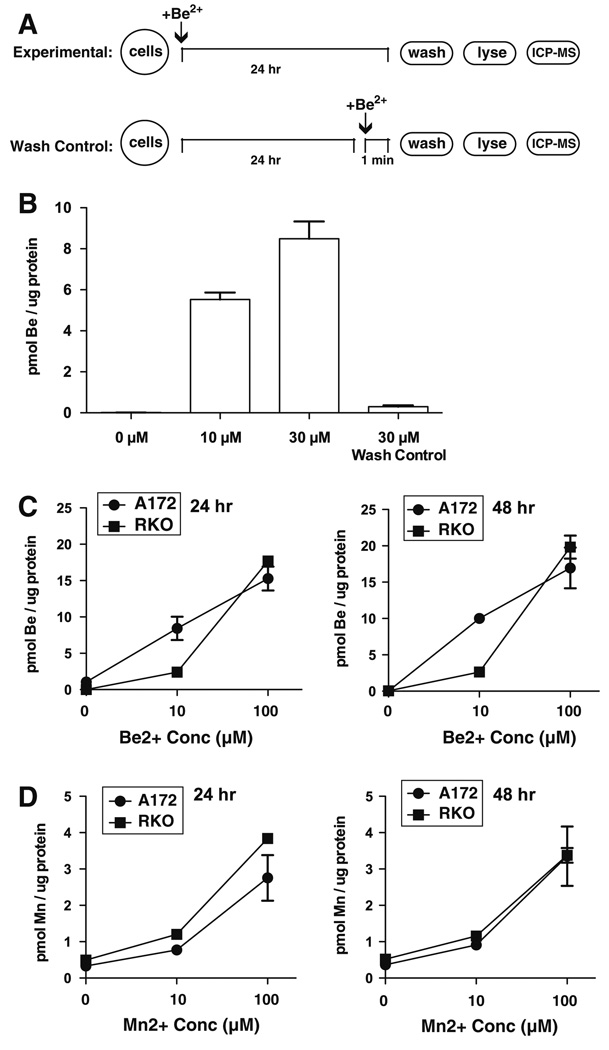
Because A172 and RKO cells responded very differently to extracellular BeSO4, an assay was developed to determine whether these two cell types differ in their abilities to import Be2+ (Fig. 7a). A172 cells exhibited concentration-dependent and time-dependent cellular uptake of Be2+ (Fig. 7b). A 1 min exposure to 30 µM BeSO4 yielded negligible levels of intracellular beryllium compared to a 24 h exposure to the same concentration, showing that uptake was time-dependent rather than instantaneous. The 1 min exposure also served as a wash control, which demonstrated that the washing steps were adequate to prevent extracellular fluid from contaminating the sample. A172 and RKO cells acquired intracellular Be2+ equally well when exposed to 100 µM BeSO4 for 24 or 48 h (Fig. 7c). At 10 µM BeSO4, A172 cells were more efficient than RKO at sequestering Be2+ intracellularly. As a reference standard, the uptake of a different divalent cation was analyzed simultaneously. Manganese was chosen as a suitable standard for this comparison, because background levels of manganese in culture media with serum are quite low. There was little difference in the uptake of Mn2+ by the two cell types (Fig. 7d). The Mn2+ data further strengthen the conclusion that there are not great differences in divalent cation uptake efficiency between the two cell types. In addition, the use of Mn2+ as a reference allowed the protein normalization step to be independently validated, because similar trends are observed whether one reports Be/total protein (Fig. 7) or Be/Mn ratios (not shown).
Fig. 7.
Be-sensitive and Be-resistant human tumor cells exhibit comparable uptake of extracellular Be2+ and Mn2+. a Schematic of experimental protocol and wash control. b The procedures outlined in schematic A were used to evaluate the effectiveness of plate washing in eliminating extracellular contributions to signal. A172 cells were treated with 0, 10, or 30 µM BeSO4 for 24 h, or 30 µM BeSO4 for only 1 min as a wash control. Extracellular BeSO4 was removed by washing, and intracellular Be content was analyzed by ICP-MS. c A172 and RKO cells were treated with 0, 10, and 100 µM BeSO4 for 24 h (left panel) or 48 h (right panel), then intracellular Be was measured by ICP-MS. d A172 and RKO cells were treated with 0, 10, and 100 µM MnSO4 for 24 h (left panel) or 48 h (right panel), then intracellular Mn was measured by ICP-MS. All points show mean ± SD
Discussion
It might seem surprising that beryllium could inhibit the growth of cancer cells, because beryllium is classified as a carcinogen. However, this classification is based mainly on reports that beryllium metal and beryllium oxide cause lung cancer in rodents after inhalation of the airborne particulates (Gordon and Bowser 2003). It is less clear whether beryllium salts are also carcinogenic, but beryllium in the form of Be2+ does not appear to be mutagenic. BeSO4 is non-mutagenic in the Ames assay (Ashby et al. 1990). No DNA damage is observed when Jurkat lymphocyte cells are exposed to 50–1,000 µM BeCl2 (Caicedo et al. 2008). In A172 cells, 10 µM BeSO4 produced cytostasis, yet no DNA damage was seen with BeSO4 up to 300 µM, the highest concentration tested (Fig. 6). BeSO4 is non-clastogenic to Chinese hamster lung cells at 3.5 mM and lower (Ashby et al. 1990). On the other hand, 0.5–2.0 mM BeSO4 causes some increase in the transformation frequency of BALB/c-3T3 cells (Keshava et al. 2001), but these concentrations are orders of magnitude greater than needed to cause cell cycle arrest in susceptible cell types. Thus, the carcinogen literature is probably not relevant to the low concentration cytostatic effects reported here.
Previous studies of the cytostatic effects of beryllium have not looked at cancer cells. Here it is shown that BeSO4 inhibits the proliferation of A172 human glioma cells (Fig. 1). These cells responded to Be2+ with increased p53 protein and increased p21 mRNA and protein (Figs. 2, 3). In fibroblasts, Be2+ treatment increases p53 protein but not p53 mRNA levels (Coates et al. 2007). To follow up on this observation, phosphorylation of serine-15 of p53 was examined and found to be increased by BeSO4 treatment in A172 cells (Fig. 3). This modification prevents the interaction of p53 with MDM2, the ubiquitin-ligase that targets p53 for proteosomal degradation (Shieh et al. 1997). Serine-15 phosphorylation occurs during senescence (Webley et al. 2000), and in other situations in which p53 protein becomes stabilized and transcriptionally active (Shieh et al. 1997). BeSO4 also caused an increase in SA-β-gal in A172 cells (Fig. 4). The increases in p53, p21, and SA-β-gal, the cytostatic nature of the effect on growth (Fig. 1b), and the G0/G1-phase of the cell cycle arrest (Fig. 5) are consistent with a senescence-like response. Like most tumor cells, A172 express telomerase activity (Komata et al. 2000), which means that these cells lack telomere-initiated signals for senescence. The point of action of Be2+ in this system may be downstream of telomere-initiated signals, which are absent, and upstream of p53, which becomes activated by the treatment.
After 3 days of exposure to 10 µM BeSO4, A172 cells nearly ceased synthesizing new DNA (Fig. 5b). This matches the decline in the S-phase cell population observed by flow cytometry at the same dose and time (Fig. 5a). Cells treated in this way had a 4-fold increase in p21 mRNA (Fig. 2), so a strong p21-mediated cell cycle blockade that stops DNA replication is to be expected. A “drug washout” variation of this experiment demonstrated that the proliferation arrest created by Be2+ exposure persists for several days. Three days after BeSO4 removal, the DNA synthesis rate per cell remained significantly depressed (P < 0.01), attaining only 51% of control values (Fig. 5c). With longer recovery time, the Be2+-induced cytostasis eventually dissipated. Although senescence is often regarded to be “irreversible”, even senescent fibroblasts require persistent signaling through p53 to maintain the cytostatic state (Gire and Wynford-Thomas 1998).
Whereas A172 responded strongly to 10 µM BeSO4, RKO cells failed to respond to either 10 or 100 µM BeSO4 with respect to p21 mRNA induction (Fig. 2), p21 and p53 protein induction (Fig. 3), and SA-β-gal induction (Fig. 4). Although they differ in Be2+ responsiveness, A172 and RKO cell lines have similar p53-dependent DNA damage responses. For example, A172 cells exposed to 6 Gy of IR produce p21, but p21 induction is lost when the cells are transfected with a dominant negative mutant of p53 (Kubota et al. 2000). Likewise, RKO cells exposed to 4 Gy of IR produce p21, but this response is absent after p53 inactivation (Franken et al. 2004). To check whether there might be something unusual about the specific RKO cells used in the present study, the ability of the RKO cells to upregulate p21 in response to UV- or IR-induced DNA damage was examined and confirmed (Figs. 2, 3).
A172 and RKO cells exposed to 100 µM BeSO4 accumulated intracellular Be2+ equally well at both 24 and 48 h (Fig. 7c). This shows that the relative failure of RKO cells to respond to 100 µM BeSO4 (Figs. 1, 2, 3, 4) cannot be due to insufficient uptake of Be2+, because similar intracellular levels were more than sufficient to cause large effects in A172 cells. Interestingly, when a lower concentration (10 µM) of BeSO4 was added to the medium, A172 cells accumulated the metal ion to a greater extent than RKO cells. Conceivably, this might indicate the presence of high affinity intracellular binding sites for Be2+ that are present in A172 cells and absent in RKO cells. Little is known regarding putative Be2+-binding targets; subcellular fractionation studies suggest that Be2+ binds preferentially to a protein fraction that is present in nuclei (Parker and Stevens 1979; Witschi and Aldridge 1968).
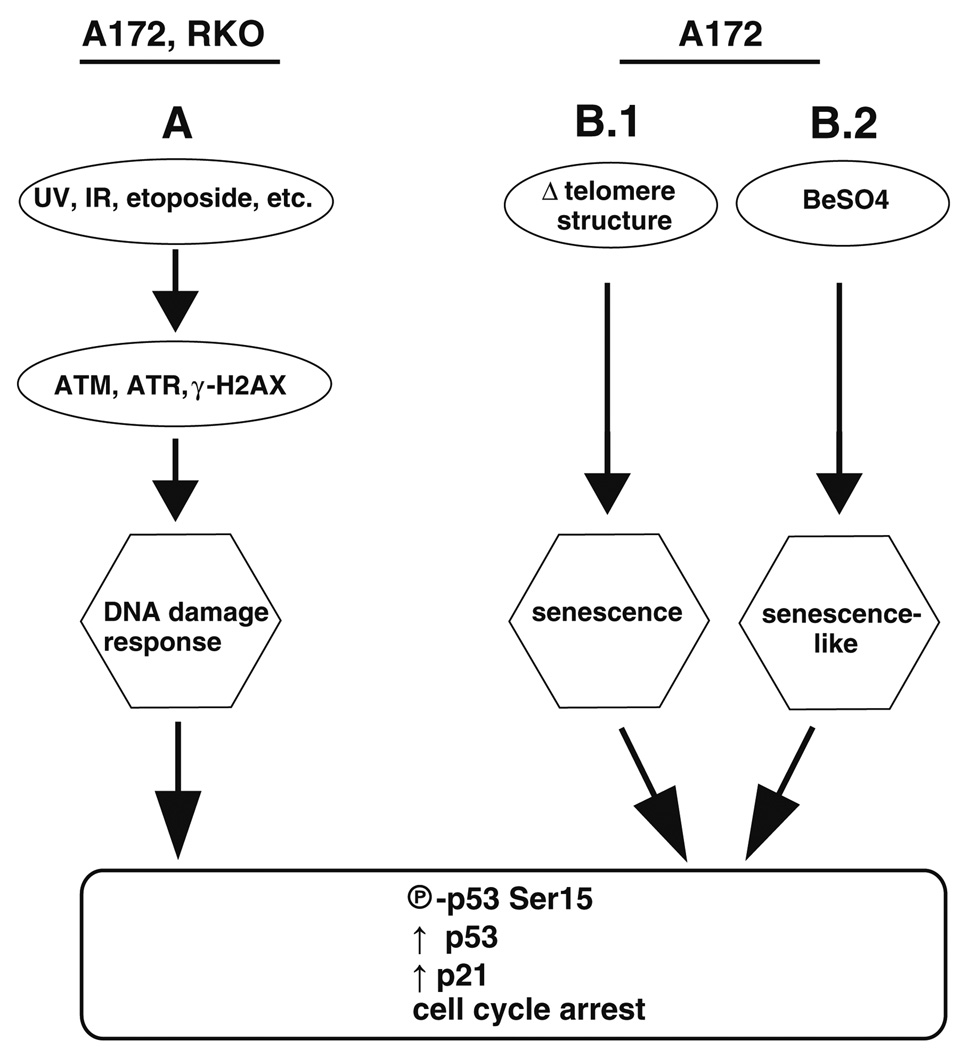
The signaling pathways that lead to senescence-like responses are diverse (Ben-Porath and Weinberg 2005). The kinases ATM and, to a lesser extent, ATR are important in sensing the telomeric changes that initiate senescence (Bakkenist et al. 2004; Ben-Porath and Weinberg 2005; Herbig et al. 2004). These kinases are best known for their roles in IR- and UV-induced DNA damage recognition (Helt et al. 2005; Hill et al. 2008; Lakin and Jackson 1999), so there is considerable overlap between senescence-signaling and DNA damage response-signaling with respect to upstream activators (such as ATM and ATR) and downstream effectors (such as p53 and p21). Nonetheless, it appears that Be2+ affects a senescence-like signaling process that is distinct from the DNA damage pathways, because RKO cells respond to DNA damage but fail to respond to Be2+ (Fig. 8). Mutation of any component of the pathway targeted by Be2+ could render cells resistant. A172 cells possess a wildtype p53, but p16INK4a and p14ARF are deleted in this cell line (Ishii et al. 1999). Comprehensive analyses of glioblastoma genotypes found that TP53 is mutated or deleted in 35–40% of cases, and the CDKN2A gene locus, which codes for both p16 and p14, suffers homozygous deletion in 50% (The Cancer Genome Atlas Research Network 2008; Parsons et al. 2008). p16 is a CDK4/CDK6 inhibitor that halts cell cycle progression by preventing phosphorylation of pRB. p21 and p16 are the two cyclin-dependent kinase inhibitors that are characteristically elevated during senescence. In replicative senescence, p21 is the major player during the early stages of senescence, and p16 increases later (Stein et al. 1999). BeSO4 treatment of fibroblasts causes a large, rapid increase in p21 and a smaller, temporally delayed increase in p16 (Coates et al. 2007). The A172 results show that Be2+-inducible cell cycle arrest can occur even in the complete absence of p16. p14 antagonizes MDM2, which is a negative regulator of p53 (Stott et al. 1998). In this way, p14 can bring about p53-dependent cell cycle arrest (Stott et al. 1998; Weber et al. 2002). However, Be2+ cannot be acting through p14 because p14 is not present in A172 cells.
Fig. 8.
Two pathways to p53 activation. The DNA damage-responsive pathway (a) is functional in RKO cells, whereas the BeSO4-responsive pathway (b.2) is nonfunctional in this cell type. In A172 cells, beryllium causes cell cycle arrest without causing DNA damage. The resultant cytostatic state (b.2) shares features with senescence (b.1)
Depending on the tissue origin and genotype, senescence signaling pathways may lie dormant but intact in some cancer cell types, such as A172. BeSO4 appears to turn on senescence-related growth control pathways in susceptible cells. As such, BeSO4 may become a useful tool to dissect senescence signaling in both normal and cancerous cells.
Supplementary Material
Acknowledgements
We thank Dr. Bruce Lehnert, Dr. David Ward, and Dr. Hokwon Cho for helpful discussions, and Ms. Swapna Mudireddy for pilot studies to evaluate the feasibility of quantifying intracellular beryllium by ICP-MS. This work was funded by National Institutes of Health grant P20 RR-016464 from the INBRE Program of the National Center for Research Resources.
Footnotes
Electronic supplementary material The online version of this article (doi:10.1007/s10534-010-9352-y) contains supplementary material, which is available to authorized users.
References
- Ashby J, Ishidate M, Jr, Stoner GD, Morgan MA, Ratpan F, Callander RD. Studies on the genotoxicity of beryllium sulphate in vitro and in vivo. Mutat Res. 1990;240:217–225. doi: 10.1016/0165-1218(90)90061-6. [DOI] [PubMed] [Google Scholar]
- Bakkenist CJ, Drissi R, Wu J, Kastan MB, Dome JS. Disappearance of the telomere dysfunction-induced stress response in fully senescent cells. Cancer Res. 2004;64:3748–3752. doi: 10.1158/0008-5472.CAN-04-0453. [DOI] [PubMed] [Google Scholar]
- Bartek J, Lukas J. Pathways governing G1/S transition and their response to DNA damage. FEBS Lett. 2001;490:117–122. doi: 10.1016/s0014-5793(01)02114-7. [DOI] [PubMed] [Google Scholar]
- Beard SE, Capaldi SR, Gee P. Stress responses to DNA damaging agents in the human colon carcinoma cell line, RKO. Mutat Res. 1996;371:1–13. doi: 10.1016/s0165-1218(96)90089-0. [DOI] [PubMed] [Google Scholar]
- Ben-Porath I, Weinberg RA. The signals and pathways activating cellular senescence. Int J Biochem Cell Biol. 2005;37:961–976. doi: 10.1016/j.biocel.2004.10.013. [DOI] [PubMed] [Google Scholar]
- Bland JM, Altman DG. Transformations, means, and confidence intervals. BMJ. 1996;312:1079. doi: 10.1136/bmj.312.7038.1079. [DOI] [PMC free article] [PubMed] [Google Scholar]
- Caicedo M, Jacobs JJ, Reddy A, Hallab NJ. Analysis of metal ion-induced DNA damage, apoptosis, and necrosis in human (Jurkat) T-cells demonstrates Ni2 + and V3 + are more toxic than other metals: Al3+, Be2+, Co2+, Cr3+, Cu2+, Fe3+, Mo5+, Nb5+, Zr2+ J Biomed Mater Res A. 2008;86:905–913. doi: 10.1002/jbm.a.31789. [DOI] [PubMed] [Google Scholar]
- Coates SS, Lehnert BE, Sharma S, Kindell SM, Gary RK. Beryllium induces premature senescence in human fibroblasts. J Pharmacol Exp Ther. 2007;322:70–79. doi: 10.1124/jpet.106.118018. [DOI] [PubMed] [Google Scholar]
- DeWeese TL, Walsh JC, Dillehay LE, Kessis TD, Hedrick L, Cho KR, Nelson WG. Human papillomavirus E6 and E7 oncoproteins alter cell cycle progression but not radiosensitivity of carcinoma cells treated with low-dose-rate radiation. Int J Radiat Oncol Biol Phys. 1997;37:145–154. doi: 10.1016/s0360-3016(96)00448-8. [DOI] [PubMed] [Google Scholar]
- Dimri GP, Lee X, Basile G, Acosta M, Scott G, Roskelley C, Medrano EE, Linskens M, Rubelj I, Pereira-Smith O, et al. A biomarker that identifies senescent human cells in culture and in aging skin in vivo. Proc Natl Acad Sci USA. 1995;92:9363–9367. doi: 10.1073/pnas.92.20.9363. [DOI] [PMC free article] [PubMed] [Google Scholar]
- Franken NA, Van Bree C, Haveman J. Differential response to radiation of TP53-inactivated cells by overexpression of dominant-negative mutant TP53 or HPVE6. Radiat Res. 2004;161:504–510. doi: 10.1667/rr3160. [DOI] [PubMed] [Google Scholar]
- Gary RK, Kindell SM. Quantitative assay of senescence-associated beta-galactosidase activity in mammalian cell extracts. Anal Biochem. 2005;343:329–334. doi: 10.1016/j.ab.2005.06.003. [DOI] [PubMed] [Google Scholar]
- Gilsbach R, Kouta M, Bonisch H, Bruss M. Comparison of in vitro and in vivo reference genes for internal standardization of real-time PCR data. Biotechniques. 2006;40:173–177. doi: 10.2144/000112052. [DOI] [PubMed] [Google Scholar]
- Gire V, Wynford-Thomas D. Reinitiation of DNA synthesis and cell division in senescent human fibroblasts by microinjection of anti-p53 antibodies. Mol Cell Biol. 1998;18:1611–1621. doi: 10.1128/mcb.18.3.1611. [DOI] [PMC free article] [PubMed] [Google Scholar]
- Gordon T, Bowser D. Beryllium: genotoxicity and carcinogenicity. Mutat Res. 2003;533:99–105. doi: 10.1016/j.mrfmmm.2003.08.022. [DOI] [PubMed] [Google Scholar]
- Gorospe M, Wang X, Holbrook NJ. p53-dependent elevation of p21Waf1 expression by UV light is mediated through mRNA stabilization and involves a vanadate-sensitive regulatory system. Mol Cell Biol. 1998;18:1400–1407. doi: 10.1128/mcb.18.3.1400. [DOI] [PMC free article] [PubMed] [Google Scholar]
- Hara T, Omura-Minamisawa M, Kang Y, Cheng C, Inoue T. Flavopiridol potentiates the cytotoxic effects of radiation in radioresistant tumor cells in which p53 is mutated or Bcl-2 is overexpressed. Int J Radiat Oncol Biol Phys. 2008;71:1485–1495. doi: 10.1016/j.ijrobp.2008.03.039. [DOI] [PubMed] [Google Scholar]
- Hart BA, Absher M, Sylwester D. The effect of beryllium on the growth of human lung fibroblasts. Environ Res. 1982;27:150–158. doi: 10.1016/0013-9351(82)90065-2. [DOI] [PubMed] [Google Scholar]
- Helt CE, Cliby WA, Keng PC, Bambara RA, O’Reilly MA. Ataxia telangiectasia mutated (ATM) and ATM and Rad3-related protein exhibit selective target specificities in response to different forms of DNA damage. J Biol Chem. 2005;280:1186–1192. doi: 10.1074/jbc.M410873200. [DOI] [PubMed] [Google Scholar]
- Herbig U, Jobling WA, Chen BP, Chen DJ, Sedivy JM. Telomere shortening triggers senescence of human cells through a pathway involving ATM, p53, and p21(CIP1), but not p16(INK4a) Mol Cell. 2004;14:501–513. doi: 10.1016/s1097-2765(04)00256-4. [DOI] [PubMed] [Google Scholar]
- Hill R, Bodzak E, Blough MD, Lee PW. p53 Binding to the p21 promoter is dependent on the nature of DNA damage. Cell Cycle. 2008;7:2535–2543. doi: 10.4161/cc.7.16.6440. [DOI] [PubMed] [Google Scholar]
- Ishii N, Maier D, Merlo A, Tada M, Sawamura Y, Diserens AC, Van Meir EG. Frequent co-alterations of TP53, p16/CDKN2A, p14ARF, PTEN tumor suppressor genes in human glioma cell lines. Brain Pathol. 1999;9:469–479. doi: 10.1111/j.1750-3639.1999.tb00536.x. [DOI] [PMC free article] [PubMed] [Google Scholar]
- Itahana K, Dimri G, Campisi J. Regulation of cellular senescence by p53. Eur J Biochem. 2001;268:2784–2791. doi: 10.1046/j.1432-1327.2001.02228.x. [DOI] [PubMed] [Google Scholar]
- Jia LQ, Osada M, Ishioka C, Gamo M, Ikawa S, Suzuki T, Shimodaira H, Niitani T, Kudo T, Akiyama M, Kimura N, Matsuo M, Mizusawa H, Tanaka N, Koyama H, Namba M, Kanamaru R, Kuroki T. Screening the p53 status of human cell lines using a yeast functional assay. Mol Carcinog. 1997;19:243–253. doi: 10.1002/(sici)1098-2744(199708)19:4<243::aid-mc5>3.0.co;2-d. [DOI] [PubMed] [Google Scholar]
- Keshava N, Zhou G, Spruill M, Ensell M, Ong TM. Carcinogenic potential and genomic instability of beryllium sulphate in BALB/c-3T3 cells. Mol Cell Biochem. 2001;222:69–76. [PubMed] [Google Scholar]
- Kessis TD, Slebos RJ, Nelson WG, Kastan MB, Plunkett BS, Han SM, Lorincz AT, Hedrick L, Cho KR. Human papillomavirus 16 E6 expression disrupts the p53-mediated cellular response to DNA damage. Proc Natl Acad Sci USA. 1993;90:3988–3992. doi: 10.1073/pnas.90.9.3988. [DOI] [PMC free article] [PubMed] [Google Scholar]
- Komata T, Kondo Y, Koga S, Ko SC, Chung LW, Kondo S. Combination therapy of malignant glioma cells with 2–5A-antisense telomerase RNA and recombinant adenovirus p53. Gene Ther. 2000;7:2071–2079. doi: 10.1038/sj.gt.3301327. [DOI] [PubMed] [Google Scholar]
- Kubota N, Okada S, Inada T, Ohnishi K, Ohnishi T. Wortmannin sensitizes human glioblastoma cell lines carrying mutant and wild type TP53 gene to radiation. Cancer Lett. 2000;161:141–147. doi: 10.1016/s0304-3835(00)00614-5. [DOI] [PubMed] [Google Scholar]
- Lakin ND, Jackson SP. Regulation of p53 in response to DNA damage. Oncogene. 1999;18:7644–7655. doi: 10.1038/sj.onc.1203015. [DOI] [PubMed] [Google Scholar]
- Lehnert NM, Gary RK, Marrone BL, Lehnert BE. Inhibition of normal human lung fibroblast growth by beryllium. Toxicology. 2001;160:119–127. doi: 10.1016/s0300-483x(00)00439-x. [DOI] [PubMed] [Google Scholar]
- Li JN, Gorospe M, Chrest FJ, Kumaravel TS, Evans MK, Han WF, Pizer ES. Pharmacological inhibition of fatty acid synthase activity produces both cytostatic and cytotoxic effects modulated by p53. Cancer Res. 2001;61:1493–1499. [PubMed] [Google Scholar]
- Liu Y, Bodmer WF. Analysis of P53 mutations and their expression in 56 colorectal cancer cell lines. Proc Natl Acad Sci USA. 2006;103:976–981. doi: 10.1073/pnas.0510146103. [DOI] [PMC free article] [PubMed] [Google Scholar]
- Mendenhall W. Introduction to probability and statistics. Boston: Duxbury Press; 1983. p. 342. [Google Scholar]
- Mirzayans R, Scott A, Cameron M, Murray D. Induction of accelerated senescence by gamma radiation in human solid tumor-derived cell lines expressing wild-type TP53. Radiat Res. 2005;163:53–62. doi: 10.1667/rr3280. [DOI] [PubMed] [Google Scholar]
- Noda A, Ning Y, Venable SF, Pereirasmith OM, Smith JR. Cloning of senescent cell-derived inhibitors of DNA-synthesis using an expression screen. Exp Cell Res. 1994;211:90–98. doi: 10.1006/excr.1994.1063. [DOI] [PubMed] [Google Scholar]
- Olivier J, Johnson WD, Marshall GD. The logarithmic transformation and the geometric mean in reporting experimental IgE results: what are they and when and why to use them? Ann Allergy Asthma Immunol. 2008;100:333–337. doi: 10.1016/S1081-1206(10)60595-9. [DOI] [PubMed] [Google Scholar]
- Parker VH, Stevens C. Binding of beryllium to nuclear acidic proteins. Chem Biol Interact. 1979;26:167–177. doi: 10.1016/0009-2797(79)90020-6. [DOI] [PubMed] [Google Scholar]
- Parsons DW, Jones S, Zhang X, Lin JC, Leary RJ, Angenendt P, Mankoo P, Carter H, Siu IM, Gallia GL, et al. An integrated genomic analysis of human glioblastoma multiforme. Science. 2008;321:1807–1812. doi: 10.1126/science.1164382. [DOI] [PMC free article] [PubMed] [Google Scholar]
- Potapova O, Gorospe M, Dougherty RH, Dean NM, Gaarde WA, Holbrook NJ. Inhibition of c-Jun N-terminal kinase 2 expression suppresses growth and induces apoptosis of human tumor cells in a p53-dependent manner. Mol Cell Biol. 2000;20:1713–1722. doi: 10.1128/mcb.20.5.1713-1722.2000. [DOI] [PMC free article] [PubMed] [Google Scholar]
- Seol DW, Chen Q, Smith ML, Zarnegar R. Regulation of the c-met proto-oncogene promoter by p53. J Biol Chem. 1999;274:3565–3572. doi: 10.1074/jbc.274.6.3565. [DOI] [PubMed] [Google Scholar]
- Shay JW, Gazdar AF. Telomerase in the early detection of cancer. J Clin Pathol. 1997;50:106–109. doi: 10.1136/jcp.50.2.106. [DOI] [PMC free article] [PubMed] [Google Scholar]
- Shieh SY, Ikeda M, Taya Y, Prives C. DNA damage-induced phosphorylation of p53 alleviates inhibition by MDM2. Cell. 1997;91:325–334. doi: 10.1016/s0092-8674(00)80416-x. [DOI] [PubMed] [Google Scholar]
- Stein GH, Drullinger LF, Soulard A, Dulic V. Differential roles for cyclin-dependent kinase inhibitors p21 and p16 in the mechanisms of senescence and differentiation in human fibroblasts. Mol Cell Biol. 1999;19:2109–2117. doi: 10.1128/mcb.19.3.2109. [DOI] [PMC free article] [PubMed] [Google Scholar]
- Stott FJ, Bates S, James MC, McConnell BB, Starborg M, Brookes S, Palmero I, Ryan K, Hara E, Vousden KH, Peters G. The alternative product from the human CDKN2A locus, p14(ARF), participates in a regulatory feedback loop with p53 and MDM2. EMBO J. 1998;17:5001–5014. doi: 10.1093/emboj/17.17.5001. [DOI] [PMC free article] [PubMed] [Google Scholar]
- The Cancer Genome Atlas Research Network. Comprehensive genomic characterization defines human glioblastoma genes and core pathways. Nature. 2008;455:1061–1068. doi: 10.1038/nature07385. [DOI] [PMC free article] [PubMed] [Google Scholar]
- Wang W, Furneaux H, Cheng H, Caldwell MC, Hutter D, Liu Y, Holbrook N, Gorospe M. HuR regulates p21 mRNA stabilization by UV light. Mol Cell Biol. 2000;20:760–769. doi: 10.1128/mcb.20.3.760-769.2000. [DOI] [PMC free article] [PubMed] [Google Scholar]
- Weber HO, Samuel T, Rauch P, Funk JO. Human p14(ARF)-mediated cell cycle arrest strictly depends on intact p53 signaling pathways. Oncogene. 2002;21:3207–3212. doi: 10.1038/sj.onc.1205429. [DOI] [PubMed] [Google Scholar]
- Webley K, Bond JA, Jones CJ, Blaydes JP, Craig A, Hupp T, Wynford-Thomas D. Posttranslational modifications of p53 in replicative senescence overlapping but distinct from those induced by DNA damage. Mol Cell Biol. 2000;20:2803–2808. doi: 10.1128/mcb.20.8.2803-2808.2000. [DOI] [PMC free article] [PubMed] [Google Scholar]
- Witschi HP, Aldridge WN. Uptake, distribution and binding of beryllium to organelles of the rat liver cell. Biochem J. 1968;106:811–820. doi: 10.1042/bj1060811. [DOI] [PMC free article] [PubMed] [Google Scholar]
- Zhan Q, Carrier F, Fornace AJ., Jr Induction of cellular p53 activity by DNA-damaging agents and growth arrest. Mol Cell Biol. 1993;13:4242–4250. doi: 10.1128/mcb.13.7.4242. [DOI] [PMC free article] [PubMed] [Google Scholar]
Associated Data
This section collects any data citations, data availability statements, or supplementary materials included in this article.


