Abstract
The purpose of this research was to explore theapplication of ionic interactions between naproxen sodium (NS) and chitosan (CH) in complexes (NSC) prepared by tray drying (TD) and spray drying (SD) methods. Drug–polymer ratio (1:1) in the NSC was optimized on the basis of dialysis studies. The particulate systems of NSC were prepared by tray drying (TD) and spray drying (SD) methods. Release retarding polymers were added to the NSC and to the physical mixtures containing NS–CH and their effects on water uptake, matrix erosion and drug release at different pH were compared. Spray dried complexes (SDC) were spherical, free flowing, light and fine amorphous particles in contrast to the crystalline, hard, tenacious, irregularly shaped, denser tray dried complexes (TDC) with poor flowability. Differential scanning calorimetry (DSC), powder X-ray diffraction (PXRD) and Fourier transform infrared (FTIR) patterns confirm the conversion of crystalline to high energy amorphous phase suitable for ionic interactions in NSC. Presence of release retarding polymers, kappa carrageenan and hydroxypropylmethylcellulose (HPMC) in the NSC compacts retarded the drug release and improved the matrix integrity. Carrageenan matrices exhibited more retardation than HPMC tablets. FTIR patterns, erosion, swelling and drug release from matrices support ionic interactions between NS and CH in NSC. The reasons for retarded drug release from the chitosan matrices at acidic pH include poor solubility of drug at acidic pH, formation of a rate limiting polymer gel barrier along the periphery of matrices and the ionic interactions between oppositely charged moieties.
Key words: chitosan, drying, ionic interactions, naproxen sodium, polyelectrolytes
INTRODUCTION
Polyelectrolytes are highly charged repeating units of macromolecules with electrolyte groups. These groups dissociate in aqueous solutions, leaving behind free ions associated with the polymer backbone. Both natural and synthetic polyelectrolytes are widely used as excipients in formulations. When solutions of two oppositely charged polyelectrolytes are mixed together, bulk complex (precipitate) is formed due to charge–charge interactions (1). When a crystalline drug with poor aqueous solubility is molecularly dispersed in an ionic polymer, the formation of drug-polyelectrolyte complex may affect the drug release. Use of such complex is preferable for the drugs with poor aqueous solubility and low oral bioavailability (2). Drug-polyelectrolyte complexation can be explored as one of the techniques in formulating sustained release dosage forms. Stable complexes between drug-polymers have been reported in the literature (1–7).
Precipitation of water insoluble complexes may be accomplished by the techniques like spray drying, lyophilization, pH controlled precipitation, solvent controlled precipitation, hot melt extrusion process and supercritical fluid technology (3). Spray drying (SD) is the most widely used single step continuous process, economical, flexible and adoptable for preparation of dry powders, granules or agglomerates of wide range of particle size and shape. This technique results in improved drug dissolution due to formation of a high energy amorphous phase and thus can be used in different dosage forms. The spray drying and characterization of the spray dried products have been reported earlier (8–14).
Chitosan (CH) {(1-4)-2-amino-2-deoxy-B-D-glucan} is a linear cationic bioadhesive, biocompatible and biodegradable polyelectrolyte obtained by N-deacetylation of chitin from crustacean shells and is an attractive carrier for biomedical applications. When dissolved in acidic solution it forms a gel, and chitosan amines protonate, i.e. acquire positive charge and coagulate upon addition of negatively charged molecules (1,2). The use of spray dried chitosans as excipients for directly compressible tablet formulation and the effect of drying techniques on deacetylated and depolymerized chitosans have been reported earlier (10,11). Suitability of this biopolymer has been disclosed in formulating sustained release dosage forms of few drugs (9–12, 15).
Naproxen sodium (NS), a nonsteroidal anti-inflammatory, weakly acidic, crystalline drug has a low aqueous solubility at acidic pH. It exhibits gastric toxicities, mucosal ulcerations and hemorrhage due to inhibition of prostaglandin production. The severity of these side effects can be reduced by lowering the peak plasma concentrations and sustaining the drug action (16,17). At acidic pH, NS (pKa = 4.2) is only minimally ionized, whereas, CH (pKa = 6.1), is ionized to a substantial extent (2). At intermediate pH, the free ions of NS and CH result in ionic interactions and complex formation (2). Complexation with chitosan though retards drug release to some extent, but further control may not be achieved due to the lack of integrity of the matrices (2). In such cases other polymers can be added to strengthen the matrices. The previous research from our laboratory has provided evidence to support and confirm the importance of in-situ complexation between oppositely charged polyelectrolytes in the matrices containing physical mixtures of chitosan, carrageenan and naproxen sodium (5). The effects of such ionic interactions on water uptake, matrix erosion and inhibition of naproxen sodium release were evaluated in the different dissolution media (5).
In the present study, the use of naproxen sodium–chitosan complexes (NSC) in retarding the drug release was explored and the effects of drying methods [SD and tray drying (TD)] used in preparing NSC on particle size, surface morphology, density, flow properties and compactability were evaluated. The physical state of drug in PM, tray dried complex (TDC) and spray dried complex (SDC) was studied by differential scanning calorimetry (DSC), powder X-ray diffraction (PXRD) and Fourier transform infrared (FTIR). To improve the matrix cohesivity, neutral polymer hydroxypropylmethylcellulose (HPMC) and anionic polyelectrolyte carrageenan were added separately and their effect on water uptake, matrix erosion and drug release at acidic and alkaline pH were studied.
MATERIALS AND METHODS
Materials
Chitosan, 87% acetylation, molecular weight 800,000 as reported by the manufacturer (Marine Chemicals, Chennai, India); κ-Carrageenan Gelcarin, GP911 NF (FMC Corporation, USA through Signet Chemicals, Mumbai, India); HPMC K4 (Colorcon Asia Pvt Ltd, Mumbai, India) and naproxen sodium (Divi Laboratories Pvt Ltd, Hyderabad, India) were obtained as gift samples. All other chemicals were purchased and were of analytical grade.
Methods
Development of Analytical Method
Calibration curves were generated in the medium A (30% vol/vol ethanol and 70% vol/vol hydrochloric acid buffer pH 1.2) and medium B (Phosphate buffer pH 6.8) by conducting Spectrophotometric analysis (UV-VIS Spectrophotometer, Model V-530, Jasco International Co Ltd, Japan) at 327.5 nm, and 229.4 nm respectively. The pKa of naproxen sodium is 4.2 and its solubility depends on the pH of dissolution medium (2). Ethanol was added to the dissolution medium A, to compensate for the low aqueous solubility of NS at acidic pH.
Dialysis Study
The interaction isotherms were obtained by using dialysis tubes (Visking, Emanuele Mires, Milan, Italy), that can retain the proteins of molecular weight 12,000–14,000 kDa. Prior to use the tubes were boiled for 5 min in 0.3% wt/vol sodium sulphide aqueous solution, followed by washing in 0.2% wt/vol sulphuric acid solution for 2 min and finally with hot distilled water for next 5 min. Each dialysis bag was filled with 10 ml of 0.5% wt/vol CH solution that was prepared in 1% vol/vol acetic acid aqueous solution. The sealed bags were immersed separately in 90 ml of NS solutions prepared in medium B. Initial drug concentration outside the dialysis bag ranged between 1 to 5 mM. The whole system was maintained under agitation on 6 station magnetic stirrer at 37 °C for 24 h till the equilibrium was attained after which final drug concentrations outside the dialysis bags were assayed spectrophotometrically at 229.4 nm with appropriate dilutions on Jasco double beam UV- VIS Spectrophotometer, Model V-530 (Jasco International Co Ltd, Japan). The data obtained was fitted into Equation 1 to interpret the maximum binding capacity of drug (7):
 |
1 |
Where;
- y
Drug bound to CH (μmol/mg of polymer) at the equilibrium
- x
Concentration of NS unbound (mM) at the equilibrium (as measured outside the dialysis bags)
- n
Maximum binding capacity for the NS (μmol/mg of polymer)
- Kd
Dissociation constant (mM)
Equation 2 is Linearized form of Equation 1:
 |
2 |
Viscosity
The steady state viscosity of the dispersion containing NS–CH (1:1) was determined at 25 °C by using controlled stress rheometer (Viscotech Rheometer, Rheologica Instruments AB, Lund Sweden), equipped with spindle C25-1. A cone and plate sensor having a diameter of 25 mm was used and the cone angle was 0.8°. The thickness of sample in the middle of sensor was 0.0127 mm. Sample volume was 15.9 cc. Analysis of data was done using Stress Rheologic basic software version 5 (Rheoexplorer 5, Rheologica Instruments AB, Lund, Sweden).
Preparation and Drying of NSC Complex
Three grams of CH was dissolved in 100 ml of 1% vol/vol acetic acid solution and was kept undisturbed for 24 h to ensure maximum swelling. Equal amount of NS was mixed in 100 ml deionized water. Both the solutions were mixed together slowly and left undisturbed overnight with constant stirring at room temperature. As per the maximum binding capacity the total solid content was maintained 3% wt/vol in all the batches. The resultant dispersion was then dried either by tray drying (TD), that was conducted in a hot air oven at 50 °C for 48 h and the complexes obtained were milled and sieved through 100# or by spray drying (SD), that was carried out in a co-current spray system (Twin Cyclon Lab Spray Drier: LU-222 Advanced Model, Labultima, Mumbai), with nozzle size of 0.7 mm, two fluid spray nozzle at inlet temperatures of 165 to 170 °C and outlet temperature of 108 to 115 °C. The vacuum obtained at 45% aspirator was −110 mm WC. The sample was pumped through 0.25 cm annular air orifice at a rate 2 ml/min (approximately 14.5%) with atomization air pressure of 2 Kg/cm2. Complexes were kept in a desiccator at room temperature over silica gel for 12–24 h before being subjected to any further evaluation.
Preparation of Matrices
Physical mixture (PM) with NS–CH in the ratio 1:1, TDC, SDC that contained drug equivalent to 250 mg of NS were mixed separately with release retarding polymers κ-carrageenan/HPMC in a laboratory mixer (Seema Enterprises, Pune, India). The concentration of κ-carrageenan/HPMC ranged from 10 to 70% wt/wt of the total mixture. For comparison purpose, matrices containing only NS–CH complexes in PM, TDC and SDC were compressed in the similar manner. These Powder admixtures were manually filled into the die and compressed in ten-station Minipress II ‘D’ tooling, tableting machine (Rimek, Karnavati Engineering Ltd, Gujarat, India) fitted with 11-mm diameter flat faced punches and one compaction cycle was performed. For each batch, 60 tablets were produced. Tablet diameter, thickness and crushing strength were determined using Pharma Test (Incorp Ltd, Mumbai, India). Tablets with (diameter)average 11 ± 0.50 mm, (thickness)average 2.6 ± 0.1 mm, and (hardness)average 6 ± 0.5 kg/cm2 were held constant for all batches.
Evaluation
Residual Moisture Content
The amount of total residual moisture content for every batch of TDC, SDC and PM was determined by using Karl Fisher titration method (MATC-D Karl Fisher Titrator, Veego, Mumbai, India). Accurately weighed 100 mg samples were added to 20 ml dehydrated methanol in the presence of Karl Fisher reagent. The mixtures were stirred magnetically and titrated to the endpoint. The amount of moisture present in the sample was determined by product of V and F; where, V is the volume of reagent used and F is the water equivalence factor. The experiment for each sample was repeated thrice in order to establish accuracy and precision of the method.
Percent Yield
The percent yield for every batch of the TDC and SDC was calculated by using Equation 3:
 |
3 |
Drug Content
Twenty five milligrams of TDC and SDC samples were dissolved in 100 ml of medium A. The dispersions were filtered through Whatman filter paper 41 (Spring Field Mill, UK). The solutions were assayed at 327.5 nm after appropriate dilutions on double beam UV-VIS Spectrophotometer, Model V-530 (Jasco International Co Ltd, Japan). The experiment was repeated thrice in order to establish accuracy and precision of the method.
The drug content was determined by Equation 4:
 |
4 |
Measurement of Particle Size Distribution
Particle size distribution of the TDC, SDC and PM samples were measured using Laser Diffraction Scattering Particle Size Analyzer (Microtrac, S 3000, ASVR, US). 01 g of each sample was dispersed in 100 ml vegetable oil of refractive index 1.47. Run time was 30 s for each run. Procedure was repeated twice and average of two runs was recorded.
Angle of Repose
Angle of repose of 2 g samples of TDC, SDC and PM was determined in triplicate by fixed funnel method and was calculated using Equations 5 and 6:
 |
5 |
 |
6 |
Where, h is the height of powder cone and r is the radius of the powder cone (18,19).
Bulk and Tap Density
Accurately weighed 5 g samples of pure naproxen sodium, chitosan, TDC, SDC and PM were transferred separately into 100 ml graduated cylinder. The volume occupied by each sample was recorded in triplicate before and after 100 tappings. The bulk density and tap density were then calculated using Equations 7 and 8:
 |
7 |
 |
8 |
Where, ρb = Bulk density, W = weight of the powder, Vb = Volume of the packing, ρt = tapped density and Vt = Tapped volume of the packing (18,19).
Carr’s Compressibility Index and Husner Ratio
Carr’s compressibility indices and Husner Ratio of pure naproxen sodium, chitosan, TDC, SDC and PM were determined in triplicate using the Equations 9 and 10 (19,20):
 |
9 |
 |
10 |
Scanning Electron Microscopy (SEM)
The surface morphology of pure naproxen sodium, chitosan, TDC and SDC were examined for their shape and size characterization using Environmental Scanning Electron Microscope (E-SEM, model Quanta 200, Neitherland), coupled with Energy Dispersive System from EDAX (Genesis 2000i). The pictures were taken at an excitation voltage of 20 kV in low vacuum mode and at magnifications of 50, 100, 200, 400, 4,000 and 10,000×.
Differential Scanning Calorimetry (DSC)
DSC studies of the pure naproxen sodium, chitosan, TDC, SDC and PM were carried out using Differential Scanning Calorimeter (DSC 821e, Mettler Toledo, Japan). Indium/zinc standards were used to calibrate the temperature and enthalpy scale. Accurately weighed 5–6 mg samples were hermatically sealed in aluminium pans and heated at constant rate of 10 °C/min over a temperature range of 40 to 300 °C. Inert atmosphere was maintained by purging nitrogen gas at a flow rate of 50 ml/min.
X-Ray Powder Diffraction
The PXRD patterns of pure naproxen sodium, chitosan, TDC, SDC and PM were recorded on powder X-ray diffractometer (PW 1729, Philips, Netherlands). The samples were irradiated with monochromatized Cu Kα radiation (1.54060°A) and analyzed between 2° to 50° of Bragg’s angle. The voltage and current used were 30 KV and 30 mA respectively. The range and chart speed were 2 × 10³ CPS and 10 mm/2θ, respectively.
Fourier Transform Infrared Spectroscopy
FTIR spectra of the pure naproxen sodium, chitosan, TDC, SDC and PM samples were recorded on FTIR, DRS Spectrometer (Model FTIR-4100 Plus, Jasco International Co Ltd, Japan). About 2–3 mg of the samples were mixed with the dried IR grade potassium bromide powder and were scanned from 4,000–400 cm−1.
Swelling and Erosion Studies
The swelling (water uptake) and erosion studies were performed by equilibrium weight method (21). The preweighed matrices were pretreated with medium A for first 2 h followed by 3 h in medium B in USP XXIV Type I dissolution test apparatus (Dissolution Tester Model TDT-08 L, Electrolab, Mumbai, India). The speed of basket rotation was maintained at 100 rpm. The basket matrix systems were removed from the dissolution vessels at regular intervals. The matrices were placed on the blotting paper to remove excess water, and were reweighed. The same matrices were dried to the constant weight in hot air oven at 50 °C for 48 h. The percentage water uptake and matrix erosion were then calculated using the Equations 11 and 12:
 |
11 |
 |
12 |
Where, Wi and Ws represent weight of initial matrix and swollen matrix at time t (min) respectively; Wp and Wpe denote initial weight of the polymer added to matrix and weight of polymer eroded up to time t respectively; and We represents the total weight loss due to dissolution of drug and polymer from matrix up to time t (min). Studies were performed in triplicate for 6 matrices from each batch.
Drug Release Studies
The pre weighed matrices were placed in 900 ml of medium A for first 2 h followed by 3 h in medium B by using USP XXIV Type II, dissolution test apparatus (Dissolution Tester Model TDT-08 L, Electrolab, Mumbai, India). The temperature of the dissolution medium was maintained at 37 ± 0.5 °C and stirred constantly at 100 rpm. Aliquot of 5 ml samples were withdrawn at predetermined time intervals and replenished with fresh dissolution medium maintained at 37 ± 0.5 °C. The aliquots were filtered through Whatman filter paper 41 (Spring Field Mill, UK) and drug concentration was determined spectrophotometrically at wavelengths of 327.5 nm and 229.4 nm. Analysis of data was done using ‘PCP Disso’ software (V3, Poona College of Pharmacy, Pune, India). The studies were performed in triplicate for 06 matrices from each batch.
RESULTS AND DISCUSSION
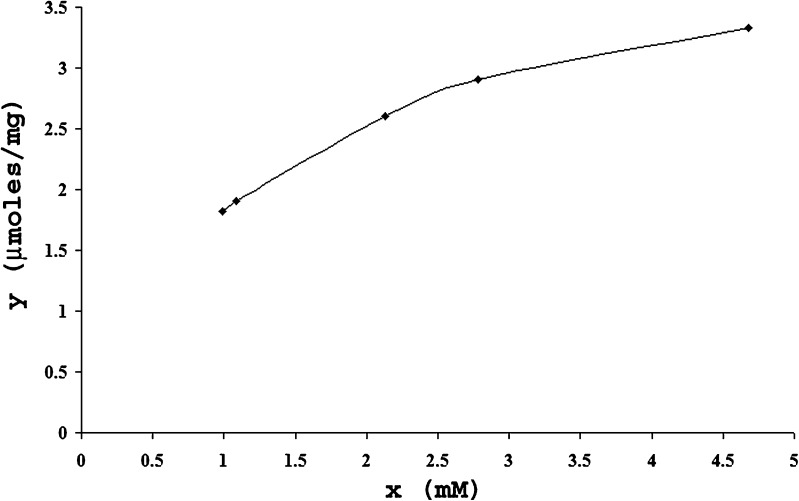
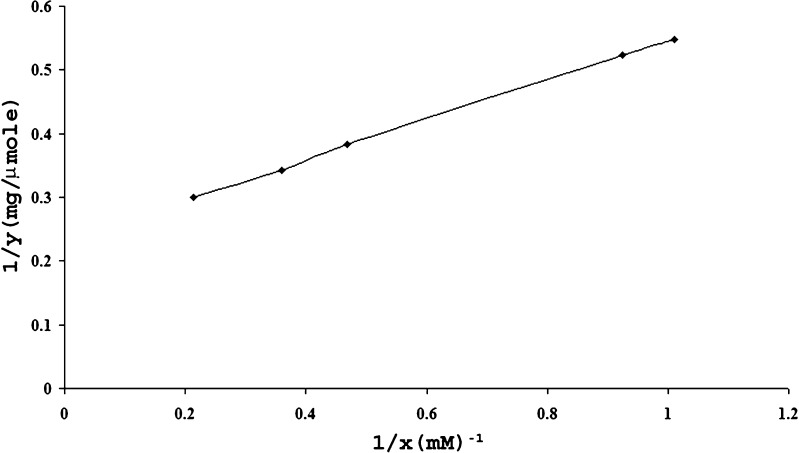
The drug chitosan complexes and drug–chitosan ratios in the complexes were quantified and optimized based on the dialysis studies. Figure 1 corresponds to plot between average values obtained after 4 runs in 24 h for x (unbound drug) and y (bound drug) and correlates the amount of drug bound polymer (μmol/mg) versus the drug concentration determined at the equilibrium after 24 h. The same data was transformed into the linearized form 1/x and 1/y in Fig. 2 and maximum binding capacity (n = 4.29 ± 0.11 μmol/mg of polymer) and dissociation constant (Kd = 1.34 ± 0.09 mM) were calculated from slope (0.3135) and intercept (0.2331) values. The average maximum binding capacity corresponds to 1:1 naproxen sodium–chitosan that was maintained constant during tray and spray drying processes.
Fig. 1.
Amount of drug bound of polymer (μmol/mg) versus drug concentration determined after 24 h.
Fig. 2.
Linearized form of the interaction isotherm.
The residual moisture content, percentage yield, drug content and micromeritic properties of NSC prepared by different drying techniques were affected significantly due to the processing parameters like dilution and viscosity, total solid content of dispersion, inlet and outlet temperatures, feed rate, aspirator air pressure in case of spray drying.
The residual moisture content of the PM, TDC and SDC were 9.3, 7.8 and 9.1% respectively. As reported by the manufacturer, an inherent moisture content of free flowing chitosan powder is 8.9%. The residual moisture content of TDC samples was low due to the prolonged drying time (48 h) at 50 °C. During spray drying when the inlet temperature was set below 160 °C and feed rate was more than 2 ml/min the incomplete evaporation of solvent resulted in the excess of liquid droplets inside the wall of drying chamber. Increase in the inlet temperature above 200 °C resulted in the deposition of the chitosan film in the drying chamber. The inlet temperature was optimized in the range of 165–170 °C to achieve free flowing product (Table I).
Table I.
Micromeritic Properties of PM, TDC and SDC
| Samples | Density g/ml | Angle of repose (°) | Carr’s index % | Husner ratio | |
|---|---|---|---|---|---|
| Bulk | Tap | ||||
| Physical mixture (PM) | 0.46 ± 0.01 | 0.57 ± 0.02 | 33.00 ± 0.9 | 19.29 ± 2.00 | 1.23 ± 0.04 |
| Tray dried complex (TDC) | 0.15 ± 0.07 | 0.22 ± 0.09 | 38.00 ± 0.8 | 31.81 ± 1.4 | 1.46 ± 0.02 |
| Spray dried complex (SDC) | 0.06 ± 0.02 | 0.08 ± 0.08 | 30.00 ± 0.6 | 19.00 ± 1.1 | 1.22 ± 0.11 |
All values represent mean ± SD (n = 3)
The average percent yield were 97.56 and 57.11% wt/wt respectively for different batches of TDC and SDC. The yield of SDC was less as it was affected by the inlet and outlet temperatures, feed rate, and aspiration air pressure. Drug content of the TDC and SDC were 100.62% wt/wt ±0.17 and 98.44% wt/wt ±0.23. Medium A was used to dissolve chitosan barrier of the TDC and SDC complexes. Presence of alcohol in medium A aided in improved dissolution of drug.
An excessive dilution of the dispersion resulted in the drastic decrease in yield and particle size of SDC, whereas, concentrated dispersion caused blockage of nozzle with large and irregular particles. Hence, the viscosity of 1:1 naproxen sodium–chitosan dispersion with total solid content of 3% wt/vol was maintained constant at 5.77 × 10⁻³ Pas for all the NSC batches at stress of 1.52 × 10⁻² Pa. The temperature and extent of drying were the major factors that affected micromeritic properties of NSC prepared by tray drying.
Tray drying invariably resulted in hard tenacious masses, which had to be ground to obtain free flowing product, whereas spray drying produced particulate complexes, which did not require additional milling. The bulk and tap densities, angle of repose, Carr’s index and Husner ratio of the PM, TDC and SDC are presented in Table I. The bulk/untapped density of a powder depends upon the packing arrangement of powder and it changes as the powder consolidates. The spherical small SDC particles would be expected to pack together closely leading to lower particle density than the large and irregularly shaped TDC particles. As can be interpreted from Carr’s index and Husner ratio, SDC particles exhibited better flowablity in contrast to the TDC. For Carr’s index values between 18–21% and Husner ratio between 1.25–1.5, particles are fair to passable through funnel, whereas, Carr’s values between 22–35% and above the particle flow gradually deteoriates. The mean volume diameter and percentage particle size distribution of naproxen sodium, chitosan, TDC, SDC and PM were determined (Table II). All the samples exhibited log-normal distribution and were well characterized by geometric volume mean diameters and geometric standard deviations. Accurate particle sizes were obtained between 0.243 to 1,408 μm diameters. For naproxen sodium d (90%) and d (50%) values were 257.5 and 118.4 μm, whereas, chitosan particles exhibited d (90%) and d (50%) at 959.3 and 567.1 μm. The d (90%) and d (50%) values for the TDC were 771.7 and 406.3 μm; and for SDC were 40.75 and 15.28 μm respectively. The mean volume diameters (dv) for naproxen sodium, chitosan, PM, TDC and SDC were 135.5, 872.4, 403.1, 447.2 and 20.2 μm respectively. This data clearly indicates that the drying method had a significant impact on the particle size distribution of the NSC. In general, even after milling, the TDC exhibited larger particle sizes than the corresponding SDC.
Table II.
Particle Size Distribution of Naproxen Sodium, Chitosan, PM, TDC and SDC
| S. No | Sample | D10% μm | D50% μm | D90% μm | Mean volume diameter (μm) |
|---|---|---|---|---|---|
| 1 | Naproxen sodium | 31.31 | 118.4 | 257.5 | 135.5 |
| 2 | Chitosan | 256.8 | 567.1 | 959.3 | 872.4 |
| 3 | Physical mixture | 91.36 | 380.8 | 720.7 | 403.1 |
| 4 | Tray dried | 179.9 | 406.3 | 771.7 | 447.2 |
| 5 | Spray dried | 5.61 | 15.28 | 40.75 | 20.2 |
Scanning Electron Microscopy
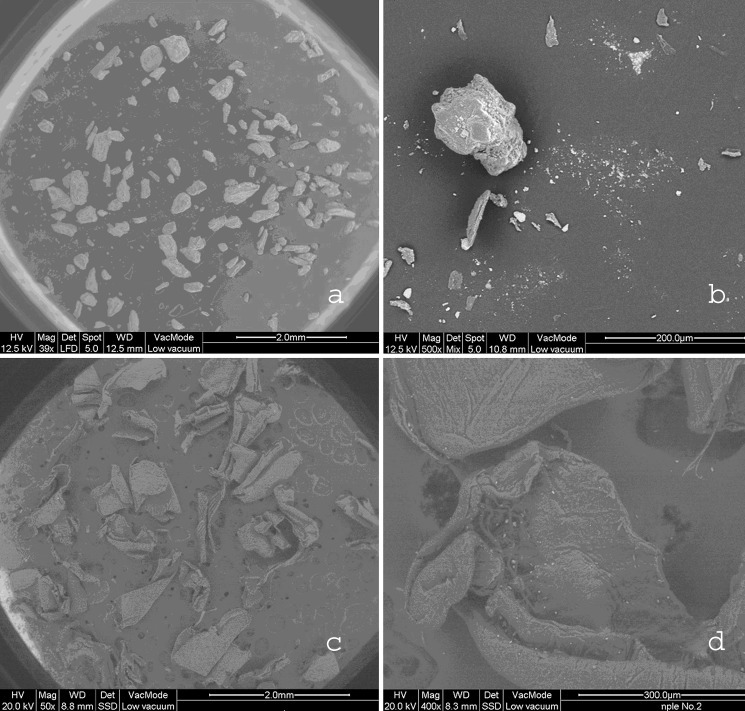
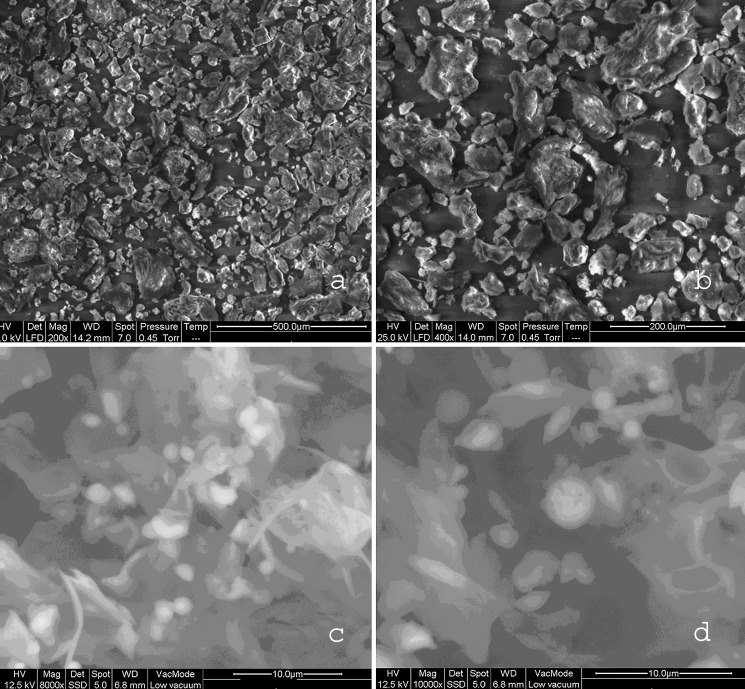
The SEM photomicrographs revealed that particle shape was also dependent on the drying method used. Figure 3 demonstrate SEM of naproxen sodium and chitosan and Fig. 4 demonstrate SEM of TDC and SDC at different magnifications and gives information about the particle size, shape and surface texture of the complexes. Naproxen sodium particles were irregularly shaped longitudinal crystals with rough surfaces, chitosan flakes were rough and irregular; the SDC particles were hollow spheres with smooth surface in contrast to the TDC that were composed of irregularly shaped particles with rough texture. The typical surface appeareance of TDC and SDC suggests that naproxen sodium is dispersed completely in the chitosan matrix.
Fig. 3.
Scanning Electron Micrographs at different magnifications: a Naproxen sodium 39×, b Naproxen sodium 500×, c Chitosan 50×, d Chitosan 400×.
Fig. 4.
Scanning Electron Micrographs at different magnifications: a TDC 200×, b TDC 400×, c SDC 8,000×, d SDC 10,000×.
Differential Scanning Calorimetry
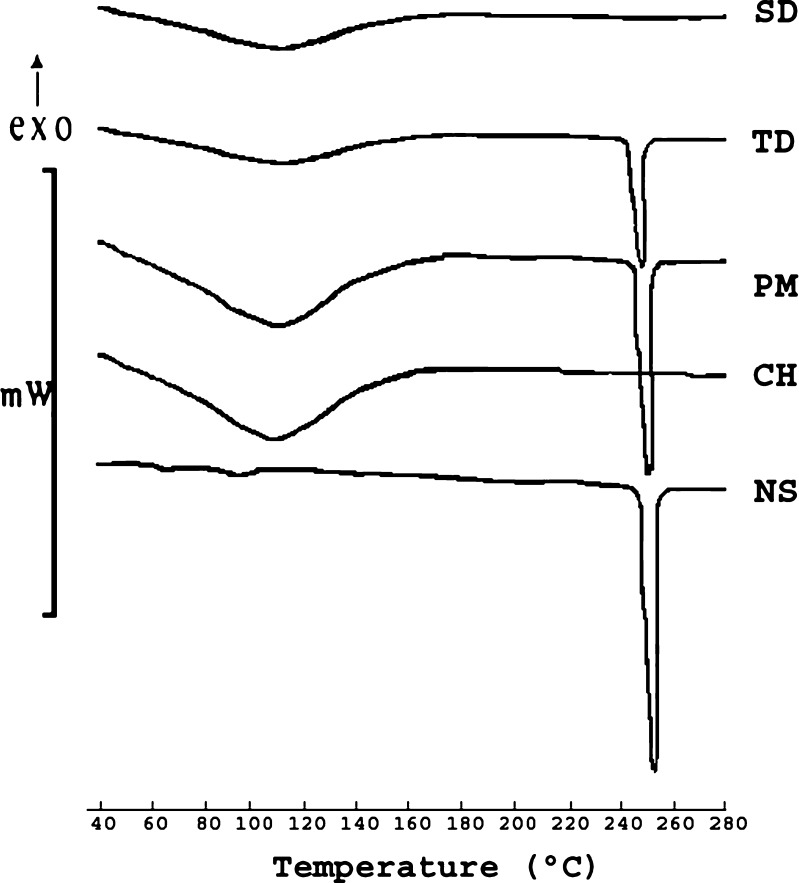
DSC was performed to characterize thermal changes in the melting behavior of NS and CH in NSC samples. Figure 5 depicts thermograms of heat flow versus temperature for NS, CH, PM, TDC and SDC in the temperature range 40 to 300 °C. Endothermic peaks at ∼100 °C in the thermograms of all samples indicate presence of moisture that was confirmed by Karl Fisher titration. The prominent and sharp endothermic peak at 256.50 °C (ΔH = −133.23 J/g) in the thermogram of NS represents its melting point. As proposed by Lee et al although chitosan has crystalline regions, the crystalline melting temperature is not found because of the rigid rod type polymer backbone having strong inter and intra molecular H-bonding (22). The melting endotherm of drug was retained in PM with slight decrease in enthalpy (ΔH = −130.5 J/g) possibly due to dilution effect. The sharp melting endotherm of drug was missing in the thermogram of SDC indicating the presence of NS in amorphous state. Where as, TDC exhibited melting enthotherm at 256 °C with decrease in enthalpy (ΔH = −102.80 J/g), indicating the presence of partially crystalline NS.
Fig. 5.
DSC thermograms of naproxen sodium, chitosan, PM, TDC and SDC.
Powder X-ray Diffraction
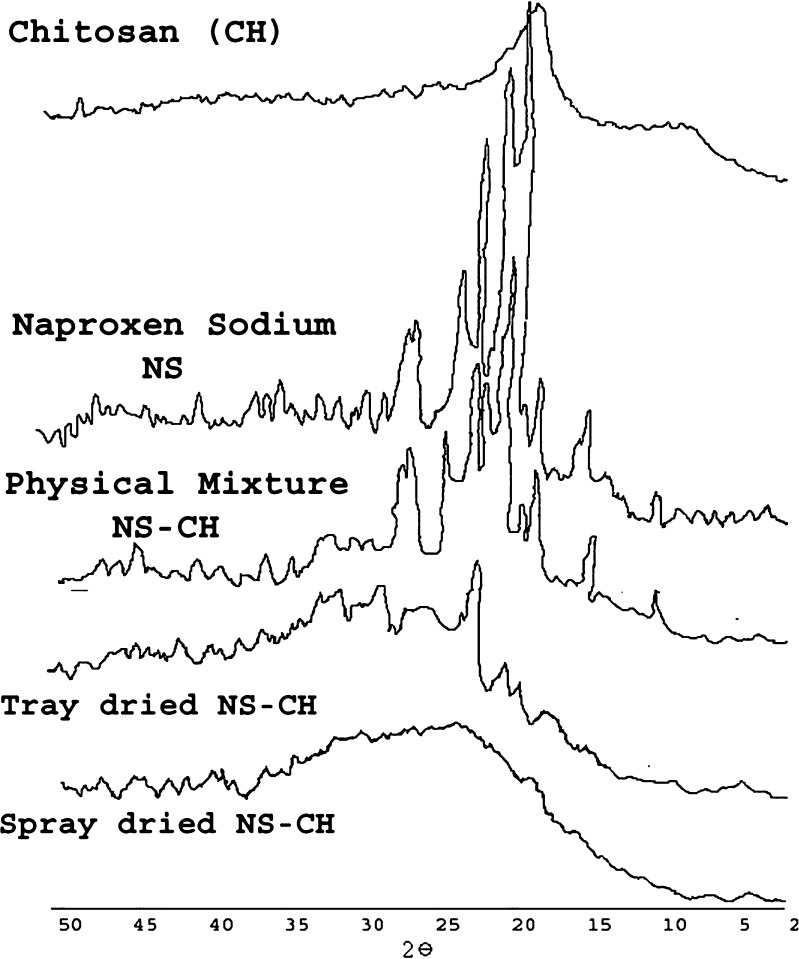
X-ray diffraction is a proven tool to study crystal lattice arrangements and yields very useful information on degree of sample crystallinity. Powder X-ray diffraction patterns of naproxen sodium, chitosan, PM, TDC and SDC were obtained and compared (Fig. 6). As is evident from Fig. 6 marked differences in the molecular state of drug and polymer were observed. Sharp peaks were noted in the diffraction patterns of naproxen sodium at 2θ values of 28.5, 22.5, 6.5; Chitosan shows a strong reflection at 19.7° and a relatively weak reflection centering at 10°, which are associated with the crystalline region. In the PM, the diffraction peaks decreased, however crystallinity was confirmed at 24°, 22.5°, and 19° 2θ. The sharp peaks in 18°–21° 2θ regions in PM suggested the contributions from both chitosan and naproxen sodium upon blending and the presence of crystallinity. On the other hand, SDC did not show any well defined crystalline peaks. Moreover, the 10° reflection for chitosan was also absent and the strong 19.7° 2θ reflection was diminished in the SDC. A characteristic broad hump (halo diffraction pattern) in the range 17 to 30° 2θ is an indication of the predominately amorphous form of chitosan and naproxen sodium in SDC. In the diffractogram of TDC peaks characteristic of NS were suppressed and appeared with very low intensity indicating presence of partial crystallinity but peaks characteristic of chitosan disappeared indicating complexation with chitosan. In summary, the DSC and PXRD studies confirm loss of crystallinity in SDC.
Fig. 6.
Powder X-Ray Diffraction patterns of naproxen sodium, chitosan, PM, TDC and SDC.
Fourier Transform Infrared
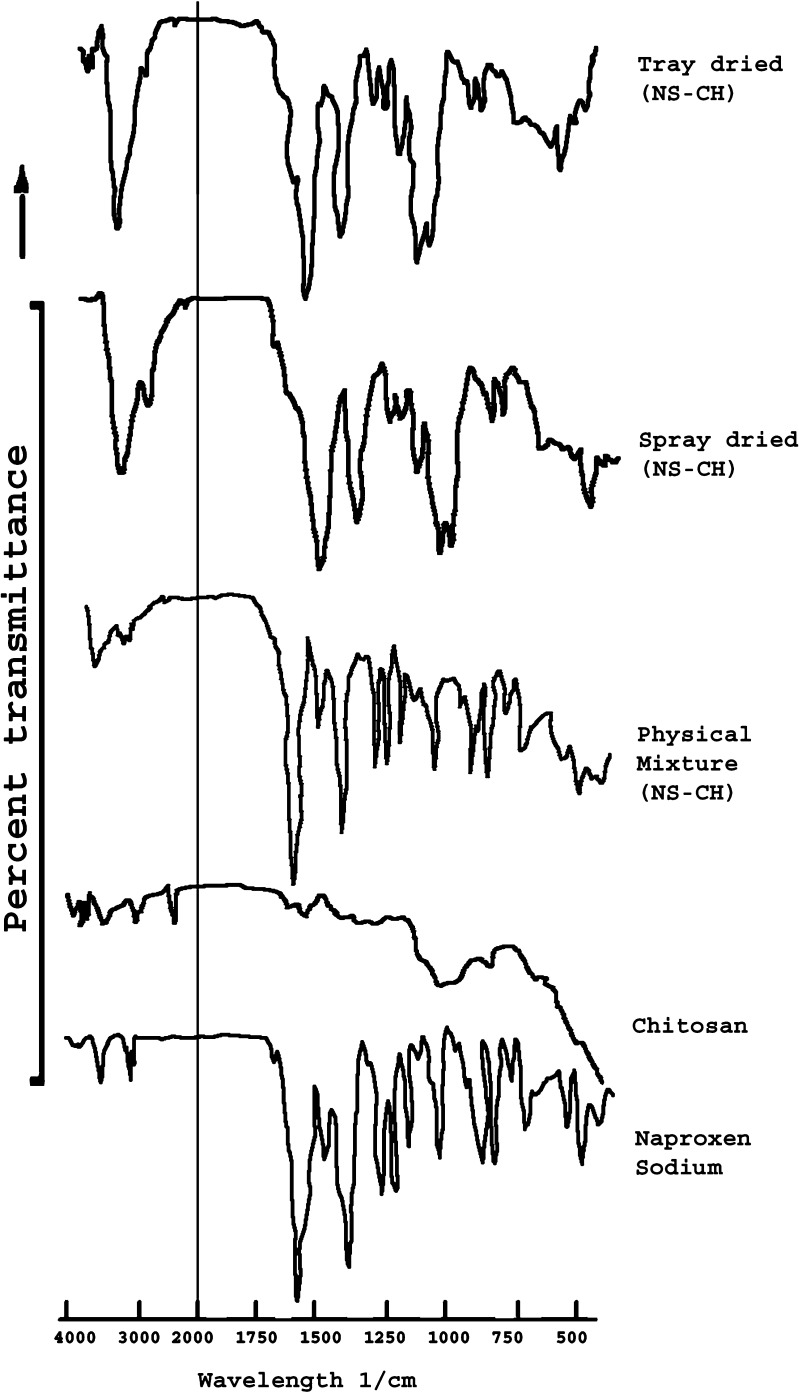
The interaction between the drug and excipients generally lead to identifiable changes in the IR patterns. Figure 7 demonstrates FTIR patterns for naproxen sodium, chitosan, PM, TDC and SDC. Naproxen sodium exhibits sharp bands at 1,210 cm−1 due to C-O- stretching (ether), 1,254 cm−1 due to C-O- stretching (acid), 1,394 to 1,365 cm−1 due to CH3 bending, 1,480 cm−1 due to asymmetrical C00- stretching, 1,580 cm−1 due to symmetrical COO- stretching, 1,628 cm−1 due to C-C aromatic skeletal stretching, and at 3,057 and 2,838 cm−1 due to C-H aliphatic stretch. Pure chitosan shows distinct amide I and amide II bands at 1,643.2 cm−1 and at 1,580 cm−1 respectively. N-H streching and O-H streching vibrations in chitosan can be characterized by the broad peaks in the region of 3,200–3,500 cm−1. The spectrum of PM seems to be unchanged in the carbonyl stretching region, and the amide peaks were also observed indicating that chitosan is not involved in intermolecular interaction with naproxen sodium in physical mixture. However, the intermolecular interaction between naproxen sodium and chitosan can be clearly noted in the IR spectrum of TDC and SDC with significant decrease in the intensity of the peaks at 1,210 and 1,257 cm−1 coupled with disappearance of peaks at 1,580 and 1,643 cm−1 and broadening of the peaks at 3,500 to 3,200 cm−1.
Fig. 7.
FTIR spectras of naproxen sodium, chitosan, PM, TDC and SDC.
Swelling and Matrix Erosion Studies
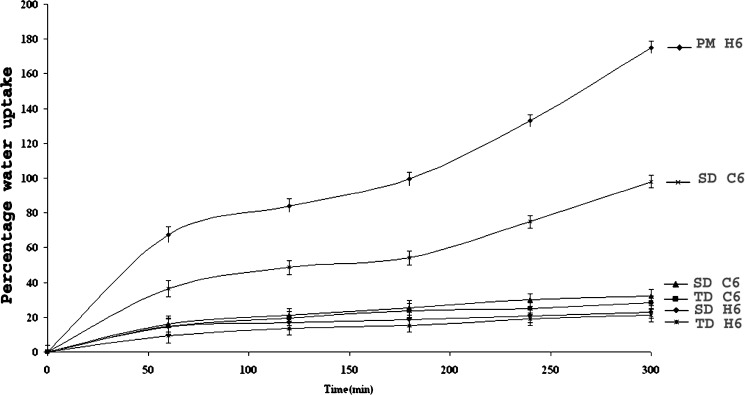
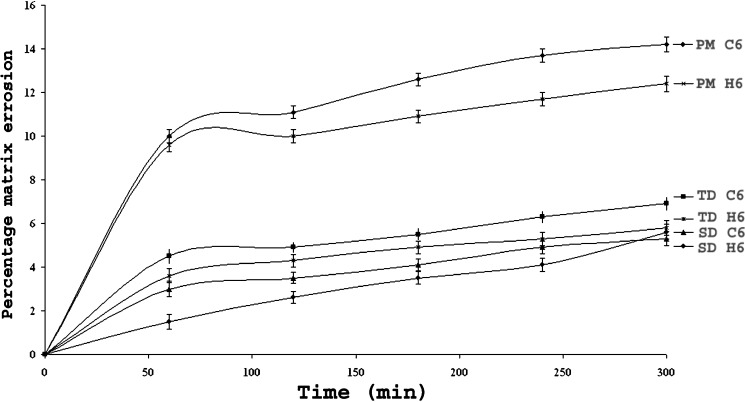
Figures 8 and 9 illustrate swelling (water uptake) and matrix erosion profiles of the optimized batches with 60% of κ- carrageenan (batch code C6) or HPMC (batch code H6) in the PM, TDC and SDC (Table III). These matrices were pretreated with medium A for 2 h followed by medium B for next 3 h. Matrices containing 10% HPMC or carrageenan disintegrated within 3 h. The data presented correlates swelling with the percentage of polymers concentrations as water uptake increased drastically with increase in carrageenan concentration in PM matrices. In the medium A fast swelling with lateral expansion were observed in PM matrices in contrast to NSC tablets in the presence of carrageenan. Possibly due to protonation and solvation of free amino groups of CH resulted in the electronic repulsions. The ionization of free sulphate groups in carrageenan at acidic pH 1.2 had encouraged in-situ ionic interactions between oppositely charged polyelectrolytes in the PM matrices containing carrageenan (5). Less swelling was observed in the TDC and SDC matrices possibly due to the absence of protonated free amino groups of CH that might have interacted with free carbonyl groups of NS in the NSC samples. The degree of swelling of HPMC matrices was due to solvation followed by gelation in the cellulose chains of neutral HPMC and was comparatively slow as well as less. It has been reported that carrageenan binds more water than HPMC in the same ratio, due to high mobility of the water molecules between polymer chains wherein sulphate groups get hydrated (22). Both carrageenan and chitosan owe their solubility in water based solvents to their charged groups, since except for these groups, the polymer backbones are quite hydrophobic (23). The rate of carrageenan erosion was affected by the pH of the dissolution medium. It was too high at acidic pH values. Carrageenan matrices exhibited more erosion as compared to that containing HPMC. Matrix erosion was maximum in the PM, and lowest that in SDC matrices. Presence of ionic interactions between pretreated NS–CH in the particulate samples of NSC cannot be neglected and could be a possible reason for less erosion of TDC and SDC matrices.
Fig. 8.
Water Uptake Profiles of optimized batches with 60% wt/wt carrageenan (C6)/HPMC (H6).
Fig. 9.
Matrix Erosion Profiles of optimized batches with 60% wt/wt carrageenan (C6)/HPMC (H6).
Table III.
Composition of Matrices with 250 mg NS–CH for PM, TDC and SDC
| Batch code | %w/w Carrageenan | % w/w HPMC | Matrix weight (mg)a |
|---|---|---|---|
| C1 | 10 | – | 275 ± 1.5 |
| H1 | – | 10 | 275 ± 1.5 |
| C2 | 20 | – | 300 ± 2 |
| H2 | – | 20 | 300 ± 2 |
| C3 | 30 | – | 325 ± 1.5 |
| H3 | – | 30 | 325 ± 1.5 |
| C4 | 40 | – | 350 ± 2.5 |
| H4 | – | 40 | 350 ± 2 |
| C5 | 50 | – | 375 ± 2 |
| H5 | – | 50 | 375 ± 2.5 |
| C6 | 60 | – | 400 ± 1.5 |
| H6 | – | 60 | 400 ± 2.5 |
| C7 | 70 | – | 425 ± 2 |
| H7 | – | 70 | 425 ± 2 |
aAll values represent mean ± SD (n = 3)
Drug Release Studies
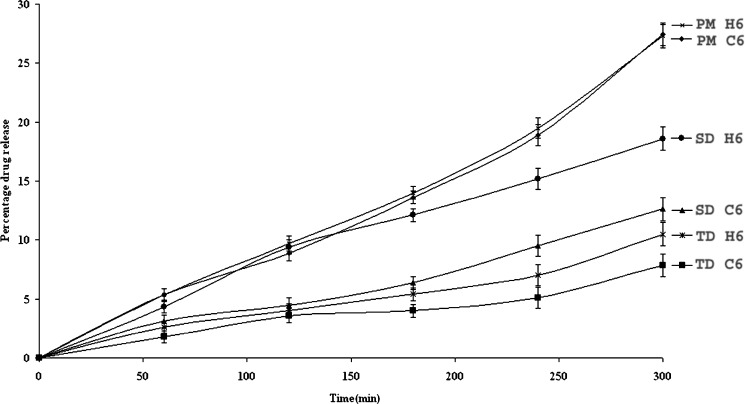
Figure 10 depicts drug release profiles of matrices of the optimized batches containing 60% of κ-carrageenan (batch code C6) or HPMC (batch code H6) in the PM, TDC and SDC. These matrices were pretreated with medium A for 2 h followed by medium B for next 3 h. The data presented correlates the release behavior with polymers concentration. PM, TDC and SDC matrices without release retarding polymers disintegrated within 5 min and the drug release was 90.8, 56.3 and 60% respectively during next 5 h. Matrices containing 10% HPMC/carrageenan disintegrated within 3 h. Carrageenan matrices exhibited slower drug release as compared to HPMC in all the media. Retarded drug release was observed in matrices of NSC as compared to PM possibly due to the presence of ionic interactions between NS and CH. Overall release of NS at the acidic pH was less. Presence of release controlling external polymers not only improved the matrix integrity but also retarded drug release by forming highly viscous barrier along the periphery of the compacts. Delayed drug release was observed with increase in polymer concentrations from 10% to 70% wt/wt. No significant retardation in drug release was noted above 60% wt/wt polymers concentration. The delay in drug release could be attributed to the complex formation between NS and CH after ionization at suitable pH. The data reveals slowest drug release from TDC matrices as compared to SDC as spray drying aided in the conversion of crystalline to amorphous form, thus improved drug dissolution. DSC, PXRD and FTIR patterns also support the above observations. The possibility of in-situ complexation between the chitosan–carrageenan in PM matrices cannot be neglected and has been reported in our previous work (5).
Fig. 10.
Drug Release Profiles of optimized batches with 60% wt/wt carrageenan (C6)/HPMC (H6).
CONCLUSION
The results obtained confirm the complex formation between ionic drugs and oppositely charged polyelectrolytes. Even though TDC exhibited better retardation as compared to SDC, Spray drying technique can always be favored due to the enhanced micromeritic properties like, free flowability, low density, spherical nature of powder with improved complexation and narrow particle size distribution. This technique can thus be used to formulate sustained release dosage forms of ionic drugs using oppositely charged polymers.
Acknowledgements
Authors are thankful to Divi Laboratories, Hyderabad, Marine chemicals Chennai, Colorcon Asia Pvt Ltd, Mumbai and Signet chemicals Mumbai, India for the gift samples of naproxen sodium, chitosan, HPMC K4 and k- carrageenan, respectively. R S Dhumal is thankful to Council for Scientific & Industrial Research (CSIR), New Delhi, India, for providing financial support in the form of Senior Research Fellowship. Authors would like to thank Dr. Dheeraj Suryawanshi, Project Engineer and Dr A.R. Arankalle, Sr Asst Director ARAI, Pune, India, for providing access to SEM instrument as well as facilitating the SEM analysis.
References
- 1.Hugerth A., Lelham N. C., Sundelof L. O. The effect of charge density and conformation on the polyelectrolyte complex formation between carrageenan and chitosan. Carbohydrate Polymers. 1997;34:149–156. doi: 10.1016/S0144-8617(97)00088-X. [DOI] [Google Scholar]
- 2.Rege P. R., Shukla D. J., Block L. H. Chitinosan drug complexes: Effect of electrolyte on naproxen release in vitro. Int J Pharm. 2003;250:259–272. doi: 10.1016/S0378-5173(02)00551-3. [DOI] [PubMed] [Google Scholar]
- 3.A. A. Albano, W. Phuapradit, H. Sandhu, and N. H. Shah. Stable complexes of poorly soluble compounds in ionic polymers. US Patent, 6350786 (2002) February 26.
- 4.Bartkowiak A., Hunkeler D. Carrageenan-oligochitosan microcapsules optimization of the formation process. Colloids and Surfaces B: Biointerfaces. 2001;21:285–298. doi: 10.1016/S0927-7765(00)00211-3. [DOI] [PubMed] [Google Scholar]
- 5.K. S. Bhise, R. S. Dhumal, B. Chauhan, A. R. Paradkar, and S. S. Kadam. Effect of oppositely charged polymer and dissolution medium on swelling, erosion and drug release from chitosan matrices. AAPS PharmSciTech-2007; 8(2): Article 44. DOI DOI 10.1208/ PT 0802044. [DOI] [PMC free article] [PubMed]
- 6.Filipovic-Grcic J., Becirevic-Lacan M., Skalko N., Jalsenjak I. Chitosan microspheres of nifidipine and nifedipine-cyclodextrin complexes. Int J Pharm. 1996;135:183–190. doi: 10.1016/0378-5173(96)04470-5. [DOI] [Google Scholar]
- 7.Bonferoni M. C., Rossi S., Ferrari F., Bettinetti G. P., Caramalla C. Characterization of diltiazem lambda carrageenan complex. Int J Pharm. 2000;200:207–216. doi: 10.1016/S0378-5173(00)00389-6. [DOI] [PubMed] [Google Scholar]
- 8.Desai K. G., Park H. J. Effect of manufacturing parameters on the characteristics of vitamin C encapsulated tripolyphosphate–chitosan microspheres prepared by spray drying. J Microencapsul. 2006;23(1):91–103. doi: 10.1080/02652040500435436. [DOI] [PubMed] [Google Scholar]
- 9.Asada M., Takahashi H., Okamoto H., Tanino H., Danjo K. Theophylline particle design using chitosan by the spray drying. Int J Pharm. 2004;270(1–2):167–174. doi: 10.1016/j.ijpharm.2003.11.001. [DOI] [PubMed] [Google Scholar]
- 10.Rege P. R., Garmise R. J., Block L. H. Spray-dried chitosans. Part -I: Preparation and characterization. Int J Pharm. 2003;252(1–2):41–51. doi: 10.1016/S0378-5173(02)00604-X. [DOI] [PubMed] [Google Scholar]
- 11.Rege P. R., Garmise R. J., Block L. H. Spray-dried chitosans. Part- II: In vitro drug release from tablets made from spray -dried chitinosans. Int J Pharm. 2003;252(1–2):53–59. doi: 10.1016/S0378-5173(02)00605-1. [DOI] [PubMed] [Google Scholar]
- 12.Takeuchi H., Shinsuke N., Hiorth M., Tho I., Sande S. A. The formation and permeability of drugs across free pectin and chitosan films prepared by a spraying method. Eur J Pharm Biopharm. 2003;56:175–182. doi: 10.1016/S0939-6411(03)00065-1. [DOI] [PubMed] [Google Scholar]
- 13.Corrigan D. O., Anne M. H., Corrigan O. I. Preparation and release of salbutamol from chitosan and chitosan co-spray dried compacts and multiparticulates. Eur J Pharm Biopharm. 2006;62(3):295–305. doi: 10.1016/j.ejpb.2005.09.008. [DOI] [PubMed] [Google Scholar]
- 14.Shah M. H., Biradar S. V., Paradkar A. R. Spray dried glycerylmonooleate- magnesium trisilicate dry powder as cubic precursor. Int J Pharm. 2006;323:18–26. doi: 10.1016/j.ijpharm.2006.05.040. [DOI] [PubMed] [Google Scholar]
- 15.Steckel H., Mindermann N. F. Production of chitosan pellets by extrusion/spheronization. Eur J Pharm Biopharm. 2004;57:107–114. doi: 10.1016/S0939-6411(03)00156-5. [DOI] [PubMed] [Google Scholar]
- 16.Amaral H. M., Sousa-Lobo J. M., Ferreira D. C. Effect of hydroxypropyl methylcellulose and hydrogenated castor oil from sustained release naproxen tablets. AAPS PharmSciTech. 2001;2:E6. doi: 10.1208/pt020206. [DOI] [PMC free article] [PubMed] [Google Scholar]
- 17.Iqbal Z., Babar A., Ashraf M. Controlled release naproxen using micronized ethylcellulose by wet granulation and solid dispersion method. Drug Dev Ind Pharm. 2002;28(2):129–134. doi: 10.1081/DDC-120002445. [DOI] [PubMed] [Google Scholar]
- 18.H. A. Libermann, L. Lachmann, B. S. Joseph, and J. L. Kanig. Compression and consolidation of powdered solids. In: The Theory and Practice of Industrial Pharmacy; 3rd ed. Varghese Publishing House, Mumbai. 1987, pp. 67–71.
- 19.H. A. Lieberman, L. Lachman, B. S. Joseph, and J. L. Kanig. Preformulation. In: The Theory and Practice of Industrial Pharmacy; 3rd ed .Varghese Publishing House, Mumbai. 1987, 183–184.
- 20.M. E. Aulton. Pharmaceutical Preformulation: The Physicochemical Properties of Drug Substances. In: Pharmaceutics, The Science of Dosage Form Design; 2nd ed. Churchill Livingstone, 2002; 133–134.
- 21.Paradkar A., Chauhan B., Naim S., Samuel B. Effect of potassium chloride and cationic drug on swelling, erosion, and release from κ-Carrageenan matrices. AAPS PharmSci Tech. 2004;5:E25. doi: 10.1208/pt050454. [DOI] [PMC free article] [PubMed] [Google Scholar]
- 22.Picker K. M. Matrix tablets of carrageenans II. Release behaviour and effect of added cations. Drug Dev Ind Pharm. 1999;25(3):339–346. doi: 10.1081/DDC-100102179. [DOI] [PubMed] [Google Scholar]
- 23.Lee S. J., Kim S. S., Lee M. Y. Interpenetrating polymer network hydrogels based on polyethylene glycol macromer and chitosan. Carbohydrate Polymer. 2000;41:197–205. doi: 10.1016/S0144-8617(99)00088-0. [DOI] [Google Scholar]


