Abstract
The aim of this research was to formulate Marsupsin–phospholipid complex (M–P Complex) in attempt to increase the bioavailability of marsupsin and to characterize this new formulation along with its evaluation. Marsupsin–phospholipid complex was formulated by mechanical dispersion method. In this new formulation, complex formation was confirmed by carrying out transmission electron microscopy (TEM), IR, 1H-NMR and RP-HPLC analysis. TEM showed M–P Complex diameter range of 0.05–0.5 μm. The entrapment efficiency of M–P Complex was found to be 44%. In vitro release study revealed its first order release profile. Mean blood serum concentration vs time curve of marsupsin was of first order after oral administration of M–P Complex in albino rabbits which clearly showed remarkably increased bioavailability of M–P Complex than standardized marsupsin. The average value of Cmax and Tmax of M–P Complex were found to be 3.02 mg/ml and 10.2 h, respectively. Hence the findings demonstrate that complexing marsupsin with phospholipids results in better oral bioavailability and improved biological response than free form of standardized marsupsin.
Key words: characterization, kinosome, marsupsin, pharmacokinetics
INTRODUCTION
The demand for the plant derived drugs seems to increase in developing countries due to their medicinal values and economic procurement. Plants have been used in a wide variety of dosage form. Traditional dosage form includes pill, powder, semi fluid extract, tincture, decoction, medicated tea and solution. Modern herbal dosage form includes tablet, capsule, soluble granule and ointment. As an advantage modern herbal dosage form offer small dosage size and comparatively good absorption than conventional dosage form. Modern dosage form is more flexible in carrying and can be taken even in a busy schedule hence plays tremendous role in clinical treatment. Even after advancement, modern herbal dosage form is still showing certain limitations such as delayed therapeutic response, lack of potential of reaching the drug to the target site, requirement of relatively large quantity of drug, chances of variability in herbals and destruction of the drug during its systemic passage from gastrointestinal tract (GIT) to liver e.g. Flavonoids. Above-mentioned limitations can be overcome by improving the therapeutic performance of established herbal drugs by formulating them in a new dosage form for the better drug delivery.
Pterocarpus marsupium Roxb. is well known for its medicinal properties in Ayurveda and Unani systems of medicine for the treatment of diabetes and skin diseases (1,2). Researches in the past have established the genus Pterocarpus to be the rich source of polyphenolic compounds, especially flavonoids e.g. marsupsin, pterosupin, liquiritigenin and isoflavonoid glycol i.e. marsupol (3).
Flavonoids are the most important phytochemicals which modify the natural biological response due to its antiviral, anticancerous and anti-allergic properties but when these are administered orally or topically, have poor or very poor absorption. The reason for this poor absorption is due to the bacterial degradation of phenol moiety of the molecule or its complex formation with other substances present in the gastrointestinal tract (GIT) (4). Therefore, development of novel delivery for this class of compounds is highly desirable in order to achieve improved bioavailability.
Phospholipids are compound lipids derived from glycerol (Phosphoglycerides) or Sphingosine (sphinogmyelin). Being amphiphatic molecules, phospholipids in aqueous medium form minute, closed bilayered vesicles, which serve as permeability barriers. Glycerol containing phospholipids have been put to wide range of applications. Their application is in medical device, liposomal drug delivery systems, artificial blood and in diagnostic testing.
Phospholipids occur naturally in cell membrane and serve to maintain integrity and acts as precursor for synthesis of platelet activating factor and arachidonic acid and second messengers in signal transduction. Phospholipids occur naturally in egg yolk and soybeans.
M–P Complex serves as novel drug delivery system consisting of microscopic vesicle that gives targeted and selective therapeutic response (5). It has improved pharmacokinetic and pharmacodynamic profile, which results in better pharmacological parameters in comparison to free form of drug and can be given by oral, topical, intra or extravascular routes (6).
MATERIALS AND METHODS
Materials
P. marsupium (family-Fabaceae) heartwood was collected from Joldhal range forest Davangere, Karnataka, India. The plant material was authenticated by Dr. H.S. Chatree ex. Professor (Botany), Government Post Graduate College, Mandsaur, Madhya Pradesh, India. A voucher herbarium specimen number CIMAP, Lko. 14005 were preserved in the Central institute of medicinal and aromatic plants (CIMAP), Lucknow, U.P., India. Soy, a phospholipid was kindly provided by Ranbaxy Laboratories Ltd. (Indore, India). HPLC grade methanol, ethyl acetate, diethyl ether and water were obtained from Merck (Mumbai, India) Dialysis membrane was procured from IPCA Laboratories Ltd. (Ratlam, India). The other chemical reagents were of analytical grade or better. Male albino rats weighing (150–300 g) were taken from B. R. Nahata college of Pharmacy animal house (Ethical committee cleared Proposal no. 28/M.Ph./06,CPCSEA/IAEC Reg. no 918/ac/05/CPCSEA).
Methods
Extraction and Isolation
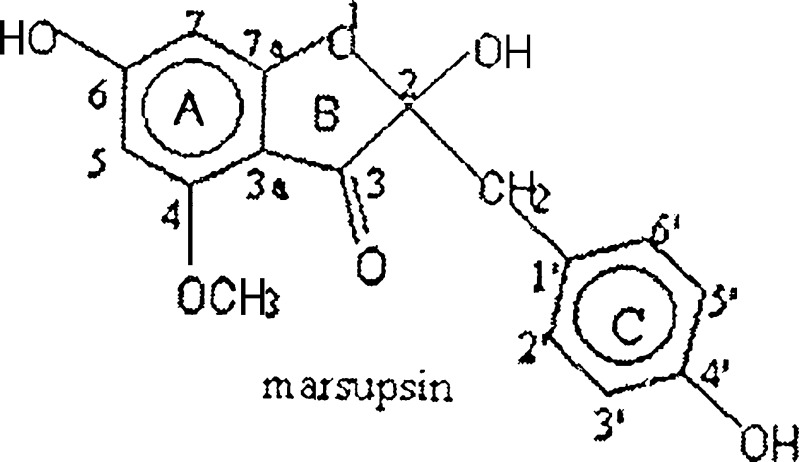
The extraction and isolation of marsupsin. (Fig. 1) from heartwood of P. marsupium Roxb. was carried out by adopting reported method of Maurya et al. (3).
Fig. 1.
Structure of marsupsin
Characterization of Marsupsin
The melting point of isolated marsupsin was determined. Marsupsin chromatographic study was carried out by using HPTLC (Anchrom Technologists, Mumbai) and marsupsin separation done by centrifugation which RP-HPLC (L-7110 pump, L-7100, L-7400 detector, Merck) and spectroscopic analysis was carried out by UV spectrophotometer (UV1 model Thermospectronic), FTIR (Shimadzu FTIR, 8000 series), 1H-NMR spectroscopy (300 MHZ, D2O,δ in ppm) using Bruker DRX-300 (300 MHZ, FT 1H-NMR with low and high temperature facility,(−90°C to + 80°C) at Central Drug Research Institute (CDRI), Lucknow, Uttar Pradesh, India. Obtained results of present studies were supported by previously reported similar study.
Spectroscopy
A double beam UV Spectrophotometer was used for drug analysis. 20 μg/ml marsupsin solution was prepared in methanol and was scanned for 200 nm to 400 nm using methanol as a blank solvent. At maximum absorbance, wavelength (λmax) was noted from scanned spectrum (7).
HPTLC Study of Marsupsin
Sample was spotted with a Camag microlitre syringe on precoated silica gel aluminium plate of 60F-254 (20 cm × 10 cm with 250 μm thickness; E. Merck, Darmstadt, Germany, supplied by Anchrom Technologists, Mumbai) using a Camag Linomat IV (Switzerland). The plates were prewashed by methanol and activated at 60°C for 5 min prior to chromatography. A constant application rate of 0.1 μl/s was employed and space between two bands was 5 mm. The slit dimension was kept at 5 mm × 0.45 mm and 10 mm/s scanning speed was employed. The source of radiation utilized was deuterium lamp emitting a continuous UV spectrum with λmax of 284 nm (8).
Preparation of Standard Curve of Marsupsin
10 mg of marsupsin was accurately weighed and dissolved in 10 ml of distilled water to give a concentration of 1 mg/ml. 1 ml of the above solution was pipette out into a 100 ml volumetric flask and made into 50 ml of distilled water to give concentration of 20 μg/ml. From resultant solution dilutions of standard concentration in Beer-Lamberts range of 2–20 μg/ml was prepared with 10 ml distilled water in 10 ml volumetric flask. Absorbance of each solution was measured at 284 nm taking distilled water as blank by using UV-visible spectrophotometer (9). Statistical test (Linearity test) was applied to authenticate the standard curve.
Preparation of M–P Complex
M–P Complex was prepared by mechanical dispersion method. 100 mg weighed (electronic balance- Ay 220 model, Shimadzu) soy lecithin was dissolved in 2 ml of diethyl ether in beaker and put into bath sonicator (F-580 Model, Merck.). 50 mg of marsupsin was dissolved in 20 ml double distilled water and this solution was added drop by drop into the beaker containing soy lecithin while sonicating and then left for 15 min for further sonication (10). The resultant formulation was kept in refrigerator and was verified through their morphological aspect using microscopic study.
Characterization of M–P Complex
Transmission Electron Microscopy (TEM)
In order to prepare sample, 1 drop of M–P Complex was added in Para film. Formvar coated copper grid was dipped into this sample for one min. For negative staining a drop of 2% phosphotungstic acid (PTA) was added in Para film and grid was immediately dipped into this solution and allowed to float for 30 s to 1 min. Excessive solution was removed by using filter paper. The stained film was then viewed on transmission electron microscope (Morgagni 268-D Fei, Holland) at All India Institute of medical sciences (AIIMS) New Delhi. Sample was observed at various magnifications ranging from 5,000–75,000 magnifications by applying 90 Kv energy (11).
HPLC study
M–P Complex was characterized by using RP-HPLC analysis (RP-8, L-7100, L-7400 detector, Merck). 5 ml of phospholipid complex were dissolved in 50 ml of mobile phase i.e. methanol and water mixture in the ratio of 40: 60 (v/v) and 20 μl aliquot of resulting solution was injected into HPLC system. The mobile phase was run at the flow rate of 1 ml/min (12). Effluent was monitored at 284 nm.
I.R. Spectroscopy
The FTIR spectra of marsupsin, phosphatidylcholine, physical mixture of marsupsin –phosphatidylcholine and M–P Complex were taken in KBr pellet using Shimadzu Fourier transformed infrared (FT-IR) spectrophotometer (spectrum 8000) instrument at CDRI (Central Drug Research Institute), Lucknow, U.P. India (13).
1H-NMR Spectroscopy
1H-NMR (300 MHZ C6D6, δ in ppm) spectroscopy of phosphatidylcholine, marsupsin and M–P Complex was carried out by using Bruker DRX-300 (300 MHZ FT-NMR with low and high temperature facility, −90°C to +80°C) at CDRI, Lucknow, U.P. India (14).
Evaluation of M–P Complex
Determination of Marsupsin Entrapment Efficiency in M–P Complex
The proportion of encapsulated marsupsin was determined by centrifuging (MC01/s.n.740 models, spin win) a certain volume of formulation at 15000 “g” for one hour at room temperature. The M–P Complex was separated from supernatant and sonicated with distilled water to measure encapsulated marsupsin content at 284 nm (λmax). The percentage entrapment efficiency was calculated by the equation 1.
 |
1 |
Where %E, AD and ED are percentage entrapment efficiency, amount of added drug and amount of encapsulated drug respectively (15).
In vitro Release of Marsupsin and M–P Complex (Marsupsin–Phospholipid Complex)
In vitro release of marsupsin and M–P Complex was measured using dialysis method. Dialysis method was applied using cellophane membrane. Activation of cellophane membrane was done in order to remove sulphur and other impurities. Activated membrane was stored in 7.4 PBS until used. Marsupsin, 2 ml, and 2 ml of M–P Complex was transferred to sample holder of two different diffusion cells which receiving compartment is containing 18 ml of double distilled water. The whole set is placed on a magnetic stirrer adjusted to constant speed of 150 rpm at 25°C. At predetermined time interval (after every 15 min for 5 h) 1 ml of release medium was withdrawn for analysis and was compensated by same volume of fresh double distilled water (11). Samples were measured at λmax 284 nm.
Apparent Solubility Study
Apparent solubility was determined by adding excess of marsupsin and M–P Complex to 6 ml of water or n-octanol in sealed glass containers at room temperature. The liquid was agitated for 24 hours on rotatory shaker then centrifuged for 15 min at 5,000×g to remove excessive marsupsin (16). The supernatant was filtered through membrane filter then 1 ml filtrate was mixed with 9 ml of distilled water to prepare dilutions and these samples were measured at wavelength of 284 nm by using UV-spectrophotometer and the concentration was calculated by using calibration curve.
Pharmacokinetic Study
Rabbits provide pharmacokinetic parameters identical to those observed in healthy volunteers or patients and mimicking human intermittent regimens and easy to collect blood from ear vein thus 12 male albino rabbits (body wt. 1,500–2,000 mg) were divided randomly into two groups, A and B, were fasted for 12 h but allowed to take water freely. The animals were housed in cages in controlled environment of animal house. Room temperature was controlled at 22°C with 12 h light: 12 h dark cycle. Marsupsin, 2.4 ml, in the strength of 50 mg/ml in the dose of 120 mg/kg body weight was administered orally to group A. Suspension of M–P Complex equivalent to 120 mg/kg body weight in 2.4 ml (strength 50 mg/ml) of dist. Water was administered orally to group B. Peak concentration (Cmax) and peak time (Tmax) were derived directly from experimental points for marsupsin and its M–P Complex, respectively (16).
Hypoglycemic Activity
Preparation of diabetic rats: Alloxan monohydrate (Loba Chemic) was dissolved in sterile water (Immediately before use) and injected intra-peritonially in the dose of 150 mg/kg body weight. Glucose solution, 10%, was also provided after 4–6 h. Rats were then kept for next 24 h. Blood samples from rats were collected from tail vein (17). Blood glucose levels were determined by Glucometer (Accu-chek active) and levels were expressed in mg/dl.
Present study: three groups of fasted Alloxan induced hyperglycemic rats were taken. 1st group named control group, were given no treatment and second group were given marsupsin orally in the dose of 120 mg/body weight. The third group were given M–P Complex orally in the dose of 120 mg/kg body weight. Blood samples were collected at 0, 1, 2, 3, 4, 5 and 6 h after administration (18–20). Blood glucose levels were measured immediately.
In statistical analysis, all data are expressed as mean ± SEM and difference between groups were considered to be significant at P ≤ 0.001 using one way ANOVA (Analysis of variance) software.
RESULTS AND DISCUSSION
The melting point of marsupsin was found to be in the range of 192°C–205°C, which was found in agreement of Maurya et al. (3). UV Study of isolate showed maxima with single peak at 284 nm, which is the characteristic of Phenolic aromatic alkoxy group and of n − π* transition, indicating the presence of hetero atom (21,22).
HPTLC Band for the isolate was found between 35–45 mm at 284 nm. Resolution was better in the solvent system of n-Butanol: ethyl acetate: water 4:1:5. RP-HPLC analysis was carried out for the identification of number of compounds present. Chromatogram showed one compound at 01.16 of retention time (R.T.) and 55420 of Area. Percent height and percent area of marsupsin was found to be 0.2636, 0.3765.
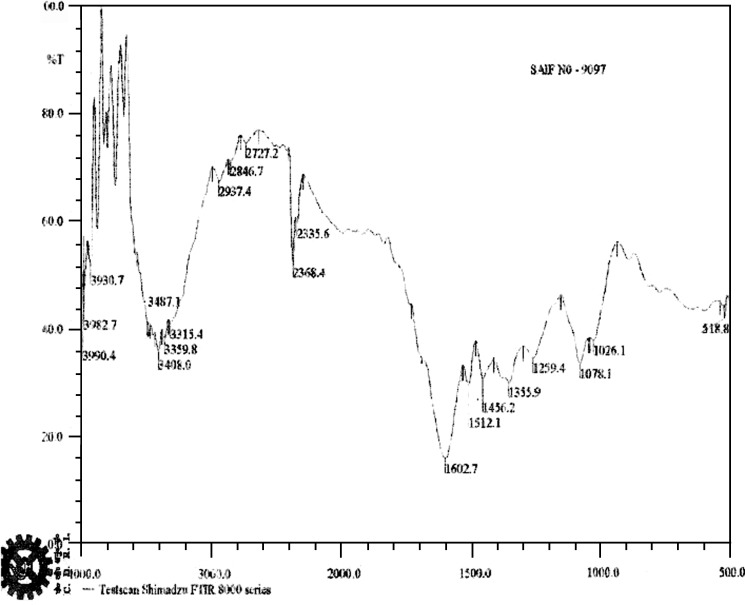
FTIR study indicated the characteristic bands at 3,408 cm−1 due to O–H stretching vibrations of the (OH) hydroxyl group. The band appearing at 2,937.4 cm–1 was due to C–H stretching vibration of the methylene group (CH2). The band appearing at 1,602.7 cm−1 was due to C–O vibrations of lactone moiety (C = O).The bands appearing at 1,512.1, 1,456.2, 1,355.9, 1,259.4 were due to the presence of aromatic moieties (23; Fig. 2).
Fig. 2.
IR Spectrum of marsupsin
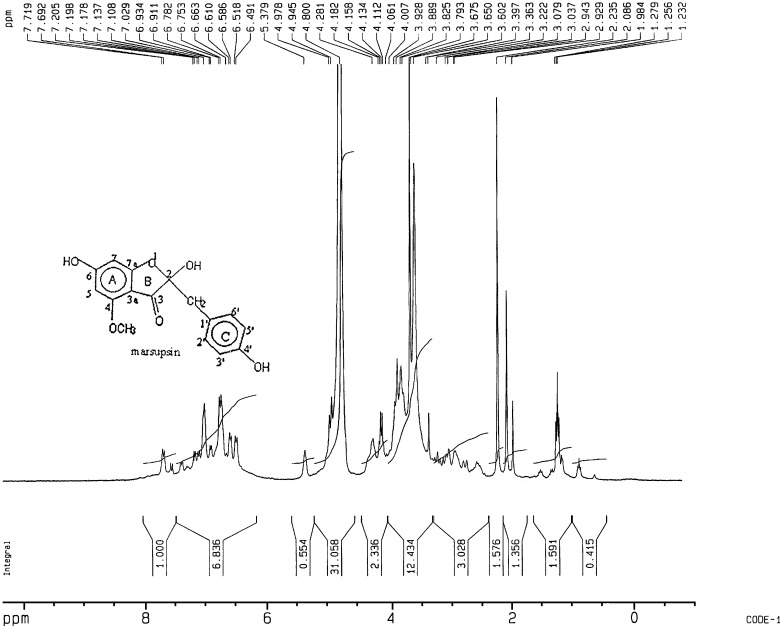
In 1H-NMR spectrum of compound, chemical shift values indicate the presence of one benzylic methylene group at 3.079 δ (ppm), one aromatic methoxy group at 3.79 δ (ppm) and A2B2 aromatic system at 6.61 δ (ppm), 7.02. δ (ppm) Chemical shift value at 4.11 δ (ppm) strongly suggested the presence of one alcoholic hydroxyl group. Chemical shift values at 7.692 δ (ppm), 7.719 δ (ppm) indicated the presence of phenolic hydroxyl group. 1H-NMR study was performed in agreement with the reported literature (23,24; Fig. 3).
Fig. 3.
Proton NMR Spectrum of marsupsin
1H-NMR spectra of phospholipids attributed the second methylene group proton near N-atom (CH2CH2N) at shift value 5.308 δ (ppm). Protons of methyl group attached to N-atom indicated by signals at 3.536 δ (ppm). Methylene group proton attached to −OC (=O) C was attributed by shift value at 4.47 δ (ppm). The shift value of 2.98 δ (ppm) showed the presence of methylene proton attached to –C (=O) C. Chemical shift value of 1.456 δ (ppm) suggested the presence of methylene proton of aliphatic side chain of molecule, while value of 0.993 δ (ppm) was due to methyl proton of aliphatic side chain of molecule (22). Calibration curve of marsupsin was expressed at 284 by following linear Eq. 2.
 |
2 |
Where, y = Absorbance x = Concentration of marsupsin (μg/ml).
Formulation result showed that in the ratio of more than one, appearance of formulation was viscous whereas in quantity ratio of 0.5/0.5 and 0.4/0.2% yield was less. In quantity ratio of 1:1 quality of formulation was better. (Table I).
Table 1.
Percent Yield of the Phosphatidylcholine/Marsupsin Formulations After Centrifugation (n + 3)
| Molar Ratios | Yield (%) |
|---|---|
| 1:1 | 44.0 |
| 0.5:0.5 | 29.3 |
| 0.4:0.2 | 17.3 |
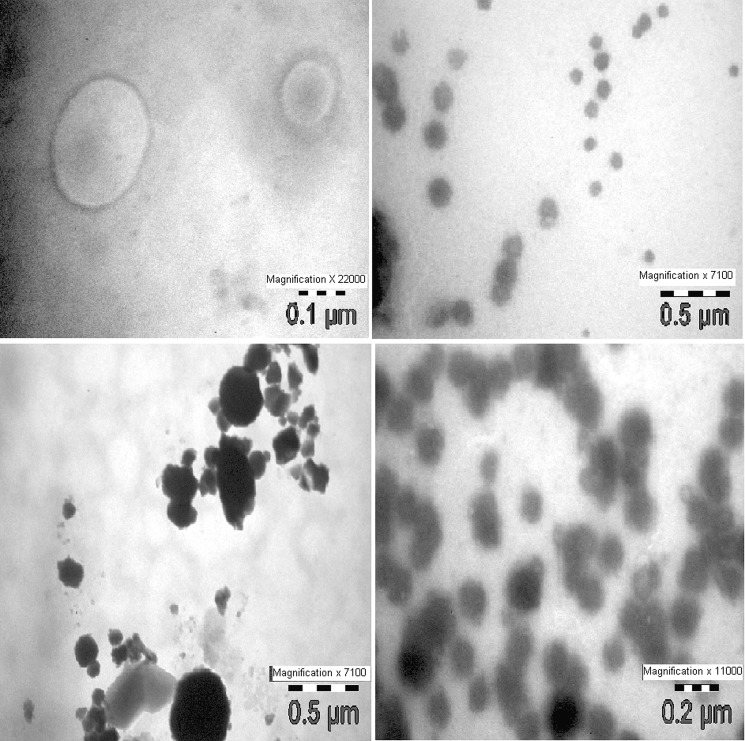
In Transmission electron microscopy (TEM) the M–P Complexes were found in the diameter range of 0.05–0.5 μm. As observed, M–P Complexes were well-identified perfect spheres and seen in disperse and aggregate collection (Fig. 4).
Fig. 4.
Transmission electron microscopy (TEM) of M–P Complex showing negative stained (2% phosphotungstic acid) formulation (Morgagni 268-D Fei, Holland)
RP-HPLC of characterized marsupsin showed two significant peaks at 1.16, 3.09 and percent area 0.3765 and 0.5530, respectively, whereas in M–P Complex modifications in these peaks were observed at 1.86, 2.37 retention time and percent area of 97.10 and 2.411, respectively. Result showed that there were considerable changes in the chromatogram of marsupsin after its formulation in Kinosomic form. Data showed that Retention time and percent area of M–P Complex was significantly greater than marsupsin.
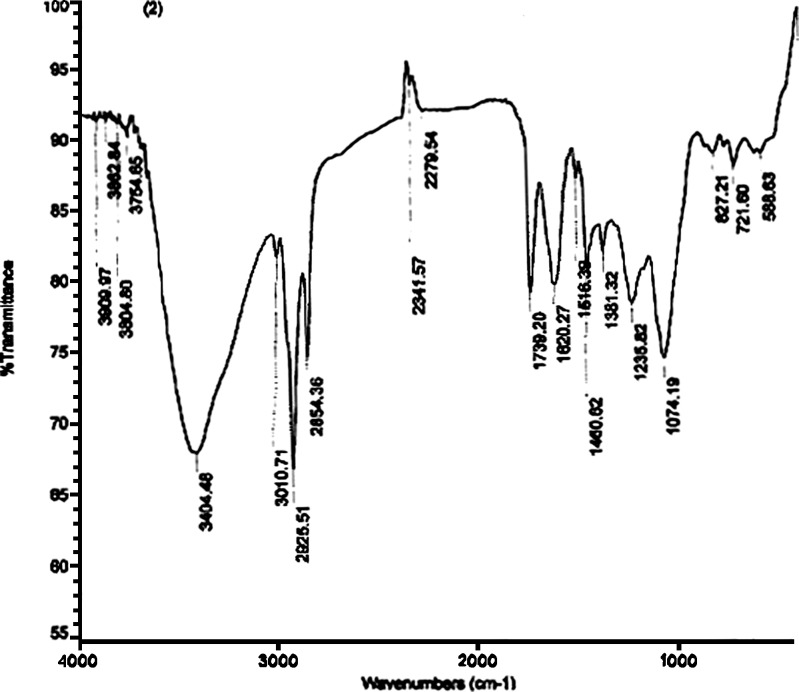
Spectrum of marsupsin showed bands at 1,259.4, 1,456., 2,937.4 cm−1 which became disappeared after formulating it in Kinosomic form. Physical mixture of marsupsin-phosphatidylcholine spectrum showed intact bands of marsupsin and phosphatidylcholine thus there was no chemical interaction between marsupsin and phosphatidylcholine whereas in M–P Complex Spectrum Bands appearing at 2,279.54, 2,341.57 and 3,754.65–3,909.97 cm−1 showed modifications which confirmed the chemical interaction (25; Fig. 5).
Fig. 5.
IR Spectrum of M–P Complex
In 1H-NMR of M–P Complex signals at 0.985, 1.450 and 2.99 δ (ppm) indicated the presence of methyl group protons of aliphatic side chain, methylene protons of aliphatic side chain and methylene protons attached to –C(=O)–C, respectively, which are the characteristic of nonpolar portion of phosphatidylcholine molecule. While the shift value at 5.131 δ (ppm) was due to second methylene group proton near N atom (CH2CH2N) of choline and signals at the 3.635 δ (ppm) was due to the proton of methyl group linked to N– atom of choline which showed significant broadening due to their involvement in complexation (26). Likewise the signals of compound at 7.550 and 8.508 δ (ppm) were also involved in complexation. Above results suggested that phenyl hydroxyl group of compound was complexed with choline part of lecithin (Fig. 6).
Fig. 6.
Proton NMR Spectrum of M–P Complex
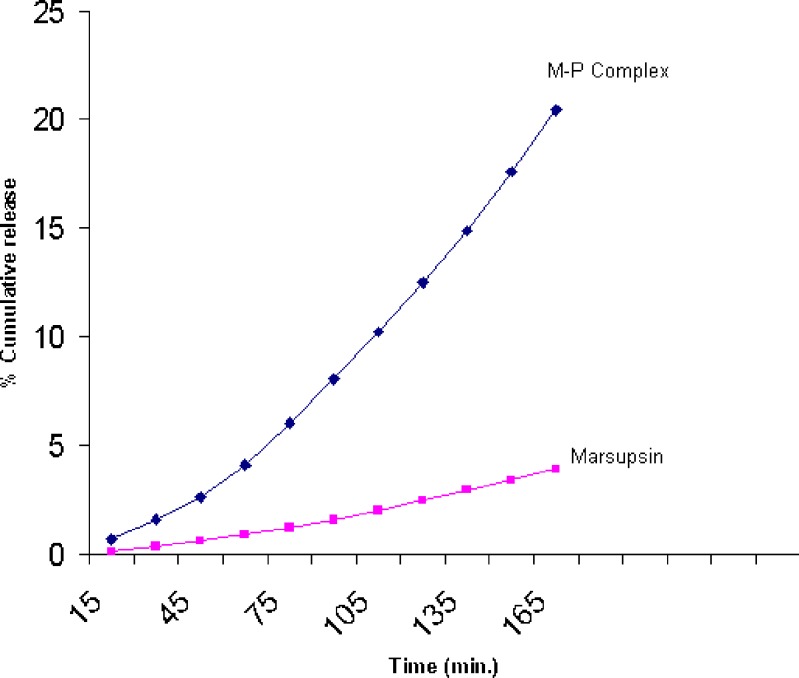
Entrapment efficiency of M–P Complex showed 44% of entrapment efficiency of marsupsin in M–P Complex. In vitro release studies data showed release followed the first order kinetics because constant fraction of the drug in the body is eliminated per unit time. The rate of elimination is proportional to the amount of drug in the body and was sustained for 3 h for marsupsin and M–P Complex. Comparative release profile study shows the percent drug release from M–P Complex was much higher in comparison to marsupsin (Fig. 7).
Fig. 7.
Comparative in vitro release profile of marsupsin and M–P Complex
Apparent solubility study results showed average apparent solubility of marsupsin and M–P Complex were 15, 39.66 in water and 0.98, 16.66 in n-octanol. The data suggested that solubility of M–P Complex in n-octanol was twice than that in water. (Table II, Table III)
Table 2.
Apparent Solubility of Marsupsin and Kinosome in Water at Room Temperature (RT)
| Sample | Apparent solubility (μg/ml) in water | Mean ± σ | ||
|---|---|---|---|---|
| 1 | 2 | 3 | ||
| Marsupsin | 14 | 16 | 15 | 15 ± 1 |
| Kinosome | 37 | 42 | 40 | 39.66 ± 2.52 |
σ Standard deviation
Table 3.
Apparent Solubility of Marsupsin and Kinosome in n-Octanol at Room Temperature (RT)
| Sample | Apparent solubility (μg/ml) in water | Mean ± σ | ||
|---|---|---|---|---|
| 1 | 2 | 3 | ||
| Marsupsin | 0.95 | 1.03 | 0.98 | 0.98 ± 0.04 |
| Kinosome | 18 | 15 | 17 | 16.66 ± 1.52 |
σ Standard deviation
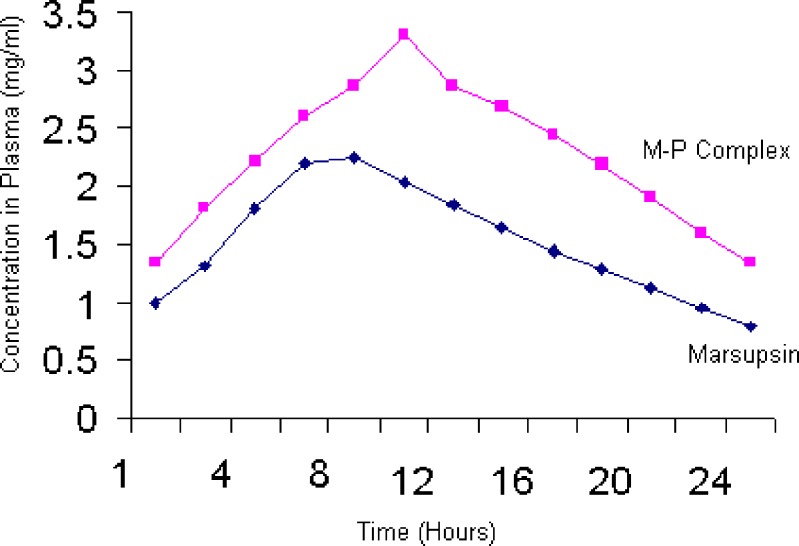
Pharmacokinetic study results attained from study were interpreted using one-way ANOVA. Results of Pharmacokinetic for Conc. of marsupsin in serum (mg/ml) ± SEM were 0.990 ± 0.0288, 1.298 ± 0.0176, 1.800 ± 0.0230, 2.200 ± 0.0115, 2.240 ± 0.0581, 2.041 ± 0.0173, 1.840 ± 0.0173, 1.650 ± 0.0288, 1.440 ± 0.0115, 1.280 ± 0.0230, 1.120 ± 0.0173, 0.940 ± 0.0230 and 0.785 ± 0.346 whereas for M–P Complex results were 1.330 ± 0.0288, 1.810 ± 0.0230, 2.220 ± 0.0115, 2.600 ± 0.0173, 2.860 ± 0.0230, 3.299 ± 0.0230, 2.860 ± 0.0173, 2.680 ± 0.0233, 2.440 ± 0.0173, 2.179 ± 0.0288, 1.900 ± 0.0230, 1.600 ± 0.0346 and 1.340 ± 0.0115 for 24 h study.
Result showed open single compartment model and first order absorption for marsupsin and M–P Complex. Sample equivalent to 100 mg/kg of marsupsin and M–P Complex was orally administered to rabbits of two groups (n = 3). From the obtained data we found the average value of Cmax of marsupsin was 2.34 mg/ml with Tmax of about 7 h whereas the average value of Cmax of M–P Complex was 3.02 mg/ml with Tmax of 10.2 h. These parameters show that marsupsin was metabolized more rapidly than M–P Complex thus M–P Complex stayed longer than marsupsin which proved its better pharmacokinetic profile (Fig. 8; Table IV).
Fig. 8.
Pharmacokinetic profile of marsupsin and M–P Complex
Table 4.
Pharmacokinetic study of Marsupsin and M–P Complex
| S. number | Time (h) | Conc. of marsupsin in plasma (mg/ml) ± SEM | M–P Complex (mg/ml) ± SEM |
|---|---|---|---|
| 1 | 1 | 0.990 ± 0.0288 | 1.330 ± 0.0288 |
| 2 | 2 | 1.298 ± 0.0176 | 1.810 ± 0.0230 |
| 3 | 4 | 1.800 ± 0.0230 | 2.220 ± 0.0115 |
| 4 | 6 | 2.200 ± 0.0115 | 2.600 ± 0.0173 |
| 5 | 8 | 2.240 ± 0.0581 | 2.860 ± 0.0230 |
| 6 | 10 | 2.041 ± 0.0173 | 3.299 ± 0.0230 |
| 7 | 12 | 1.840 ± 0.0173 | 2.860 ± 0.0173 |
| 8 | 14 | 1.650 ± 0.0288 | 2.680 ± 0.0233 |
| 9 | 16 | 1.440 ± 0.0115 | 2.440 ± 0.0173 |
| 10 | 18 | 1.280 ± 0.0230 | 2.179 ± 0.0288 |
| 11 | 20 | 1.120 ± 0.0173 | 1.900 ± 0.0230 |
| 12 | 22 | 0.940 ± 0.0230 | 1.600 ± 0.0346 |
| 13 | 24 | 0.785 ± 0.346 | 1.340 ± 0.0115 |
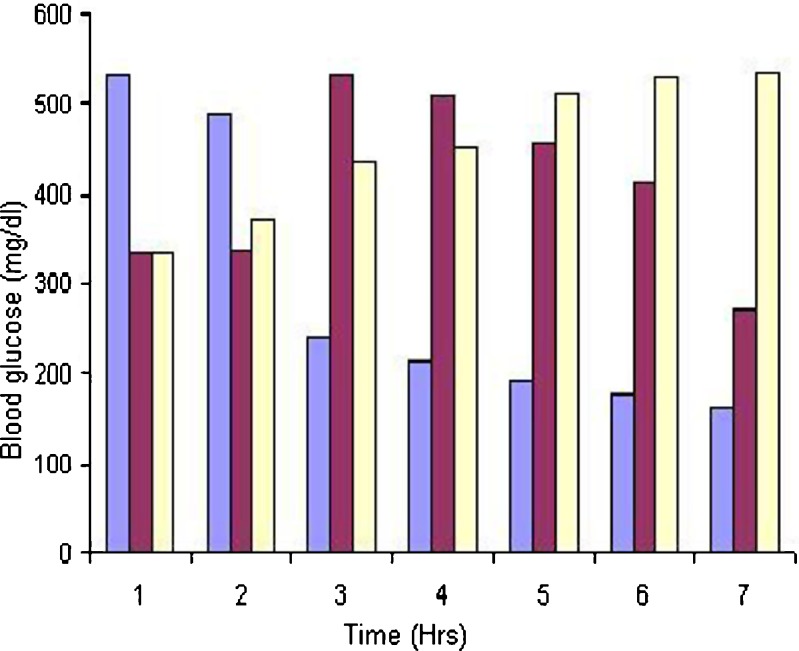
Results of hypoglycemic study were 336 ± 2.52, 338 ± 2.32, 534 ± 3.02, 511 ± 3.65, 455 ± 3.18, 413 ± 3.48, 274 ± 3.91 for marsupsin and 534 ± 2.75, 489 ± 2.55, 239 ± 2.75, 214 ± 2.62, 194 ± 2.78, 176 ± 3.05, 161 ± 2.63 for M–P Complex. Data shows there was a significant reduction (P ≤ 0.05) in fasting blood glucose levels at 1, 3, 4, 5 and 6 h and highly significant reduction (P ≤ 0.001) was at 2 h in comparison of marsupsin. Hypoglycemic activity of characterized marsupsin results were supported previously reported literature for the same activity (19) The three major phenolic constituents present in the heartwood of P. marsupium, marsupsin, pterosupin, and pterostilbene, were evaluated for their antihyperglycemic activity in streptozotocin-induced hyperglycemic rats (27). Glucose levels in rats with hyperglycemia induced by streptozotocin were already reported by giving i.p. administration of marsupsin, pterosupin, and pterostilbene, three important phenolic constituents of the heartwood of P. marsupium. Marsupsin and pterostilbene significantly lowered the blood glucose level of hyperglycemic rats, and the effect was comparable to that of 1,1-dimethylbiguanide (metformin; 28; Fig. 9).
Fig. 9.
Hypoglycemic activity of marsupsin and M–P Complex
CONCLUSION
M–P Complex form of formulation can work as a carrier for complexed marsupsin. M–P Complex may reduce the degradation of marsupsin (flavonoids) in the GIT, which in result will improve its absorption and bioavailability. M–P Complex may also reduce the dose of standardized marsupsin with patient compliance.
Acknowledgments
The authors are obliged to Dr. V. B. Gupta, Director B. R. Nahata college of Pharmacy for his valuable support during this research. Authors are also thankful to CDRI Lucknow and All India institute of medical sciences (AIIMS), New Delhi for support in analytical portion.
References
- 1.Tripathi B. Charak Samhita 2. Varanasi, India: Chaukhamba Surbharati Prakashan; 2005. [Google Scholar]
- 2.Adinarayana D., Syamasundar K. A new sesquiterpene alcohol from Pterocarpus marsupium. Phytochemistry. 1982;21(5):1083–1085. doi: 10.1016/S0031-9422(00)82421-8. [DOI] [Google Scholar]
- 3.Maurya R., Ray R. B., Duah F. K., Slatkin D. J., SchiffJr P. L. Constituents of Pterocarpus marsupium. J. Nat. Prod. 1984;47:179–181. doi: 10.1021/np50031a029. [DOI] [Google Scholar]
- 4.Bruneton J. Pharmacognosy Phytochemistry Medicinal Plants. France: Lavoisier Publication; 1999. [Google Scholar]
- 5.Morazzoni P. , Bombardelli E. Anti-inflammatory activity of some Gingko biloba constituents and of their phospholipids-complexes. Fitoterapia. 1996;LXVII(3):263. [Google Scholar]
- 6.E. Bombardelli, and M. J. Magistretti, inventors. Pharmaceutical Compositions containing flavanolignans and phospholipids as active principles. EP0209037, Jan 21, 1987.
- 7.K. A. Connors. A Text book of Pharmaceutical Analysis. Singapore: A Wiley-Interscience Publication John Wiley and Sons, 1999.
- 8.J Novakonic, K Nesmerak, and H Nova. An HPTLC method for the determination and the purity control of ciprofloxacin HCL in coated tablets. J Pharm Bio Ana. 2001;957–964. [DOI] [PubMed]
- 9.Krishna P., Sarasija S. Standard curve of stilbene. Indian Drugs. 1997;34(2):227–228. [Google Scholar]
- 10.Vyas S. P., Khar R. K. Targeted and Control Drug Delivery. New Delhi, India: CBS Publishers & Distributors; 2002. [Google Scholar]
- 11.Manconi M., Sinico C., Valenti D., Loy G., Fadda A. M. Niosomes as carriers for tretinoin. I.Preparation and properties. Int. J. Pharm. 2002;234:237–248. doi: 10.1016/S0378-5173(01)00971-1. [DOI] [PubMed] [Google Scholar]
- 12.Kvasnicka F., Biba B., Sevcik R., Voldrich M., Kratka J. Analysis of the active compounds of silymarin. J. Chromatography A. 2003;990:239–245. doi: 10.1016/S0021-9673(02)01971-4. [DOI] [PubMed] [Google Scholar]
- 13.Maitra A., Banerjee T., Mitra S., Singh A. K., Sharma R. K. Preparation, characterization and biodistribution of ultrafine chitosan nanoparticles. Int. J. Pharm. 2002;243:93–105. doi: 10.1016/S0378-5173(02)00267-3. [DOI] [PubMed] [Google Scholar]
- 14.M. A. Schubert, M. Harms, and C. C. Mueller-Goymann. Structural investigation on lipid nanoparticles containing high amounts of lecithin. European J. Pharm. Sci. 27:226–236 (2006). [DOI] [PubMed]
- 15.Rengel R. G., Barisic K., Pavelic Z., Grubisic T. Z., Cepelak I., Gricic J. F. High efficiency entrapment of superoxide dismutase into mucoadhesive chitosan-coated liposomes. European J. Pharm. Sci. 2002;15:441–448. doi: 10.1016/S0928-0987(02)00030-1. [DOI] [PubMed] [Google Scholar]
- 16.Yanyu X., Yunmei S., Zhipeng C., Oineng P. The preparation of silybin-phospholipid complex and the study on its pharmacokinetics in rats. Int. J. Pharm. 2006;307:77–82. doi: 10.1016/j.ijpharm.2005.10.001. [DOI] [PubMed] [Google Scholar]
- 17.Jayakar B., Suresh B. Antihyperglycaemic and hypoglycaemic activity of Aporosa lindleyana in normal and alloxan induced diabetic rats. J. Ethnopharmcol. 2003;84:247–249. doi: 10.1016/S0378-8741(02)00328-8. [DOI] [PubMed] [Google Scholar]
- 18.Manickam M., Ramanatham M., Jahromi M. A., Chonsouria J. P. N., Ray A. B. Antihypoglycaemic activity of phenolics from Pterocarpus marsupium. J. Nat. Prod. 1997;60:609–610. doi: 10.1021/np9607013. [DOI] [PubMed] [Google Scholar]
- 19.Ahmad F., Khalid P., Chaubey M., Rastogi A. K., Kidwai J. R. Hypoglycaemic activity of Pterocarpus marsupium wood. J. Ethnopharmacol. 1991;35:71–75. doi: 10.1016/0378-8741(91)90134-Y. [DOI] [PubMed] [Google Scholar]
- 20.Abdel J. A., Abdel I. A., Al-Hakiem M. H. H. Hypoglycaemic and antihyperglycemic effects of Trigonella foenum-graecum leaf in normal and allaxon induced diabetic rats. J. Ethnopharmacol. 1997;58:149–155. doi: 10.1016/S0378-8741(97)00101-3. [DOI] [PubMed] [Google Scholar]
- 21.R. Maurya, S. S. Handa, and R. Singh. 8-(C-beta-d-glucopyranosyl)-7,3′,4′-trihydroxyflavone, process of isolation thereof, pharmaceutical composition and method for the treatment of diabetes. US Patent 6777392. August 17, 2004.
- 22.Skoog A. D., Holler J. F., Nieman A. T. Principle of instrumental analysis. USA: Saunders college publishing; 1997. [Google Scholar]
- 23.Maurya R., Ray R. B. Marsupsin, A new Benzofuranone from Pterocarpus marsupium Roxb. Heterocycles. 1982;19(11):2103–2106. doi: 10.3987/R-1982-11-2103. [DOI] [Google Scholar]
- 24.Mathew J., SubbaRao A. V. Marsupol: A novel isoflavonoid glycol from Pterocarpus marsupium. Phytochemistry. 1982;21(7):1837–1838. [Google Scholar]
- 25.Indena Company. Phytosome a technical revolution in phytomedicine Website Available at: http://www.indena.com/pdf/ephytosome.pdf. Accessed January 7, 2006.
- 26.B. Gabetta, G. Pifferi, and E. Bombardelli. Complexes of flavanolignans with phospholipids, preparation thereof and associated pharmaceutical compositions. US Patent 4764508. August 16, 1988.
- 27.Silibinol Company, Pterocarpus marsupium, the source of Silbinolâ website available at: http://www.silbinol.com/precStudies.htm accessed may 20, 2007.
- 28.Manickam M., Ramanatham M., Jahromi M. A., Chonsouria J. P. N., Ray A. B. Antihyperglycaemic activity of phenolics from Pterocarpus marsupium. J. Nat. Prod. 1997;60:609–610. doi: 10.1021/np9607013. [DOI] [PubMed] [Google Scholar]


