Abstract
The knowledge of in vivo biotransformation (e.g., proteolysis) of protein therapeutic candidates reveals structural liabilities that impact stability. This information aids the development and confirmation of ligand-binding assays with the required specificity for bioactive moieties (including intact molecule and metabolites) for appropriate PK profiling. Furthermore, the information can be used for re-engineering of constructs to remove in vivo liabilities in order to design the most stable candidates. We have developed a strategic approach of ligand-binding mass spectrometry (LBMS) to study biotransformation of fusion proteins of peptides fused to human Fc (“peptibodies”) using anti-human Fc immunoaffinity capture followed by tiered mass spectrometric interrogation. LBMS offers the combined power of selectivity of ligand capture with the specificity and detailed molecular-level information of mass spectrometry. In this paper, we demonstrate the preclinical application of LBMS to three peptibodies, AMG531 (romiplostim), AMG195(linear), and AMG195(loop), that target the thrombopoietin receptor. The data show that ligand capture offers excellent sample cleanup and concentration of intact peptibodies and metabolites for subsequent query by matrix-assisted laser desorption ionization time-of-flight mass spectrometry for identification of in vivo proteolytic points. Additional higher-resolution analysis by nanoscale liquid chromatography interfaced with electrospray ionization mass spectrometry is required for identification of heterogeneous metabolites. Five proteolytic points are accurately identified for AMG531 and two for AMG195(linear), while AMG195(loop) is the most stable construct in rats. We recommend the use of LBMS to assess biotransformation and in vivo stability during early preclinical phase development for all novel fusion proteins.
Key words: fusion protein biotransformation, in vivo stability of biopharmaceuticals, immunoaffinity-mass spectrometry, ligand-binding assay, peptibodies
INTRODUCTION
Monoclonal antibody-based therapeutics (MAbs) have been successfully developed with great benefits to patients. They show specific pharmacological effects with much longer circulatory half-lives (t1/2) than small molecule drugs for less frequent dosing and fewer side effects. As a result of protection from endosomal degradation by complexation to FcRn (the neonatal Fc receptor) and inherent evolutionary stability, MAbs are very stable in vivo and unlikely to undergo significant biotransformation that results in circulating metabolic fragments (A. Ahene, AAPS National Biotechnology Conference Hot Topic, June 24, 2008, Seattle, Washington, USA). Most MAbs are antagonists that block pathogenesis pathways by binding to specific receptors (soluble or membrane-bound) or receptor ligands (1–3). To develop biotherapeutics that exhibit agonistic activities (e.g., cytokine mimetics), the novel approach is to fuse bioactive peptides to carrier proteins or other polymers to extend the t1/2 of the peptides. One example is human Fc/peptide fusion proteins where a pharmacologically active polypeptide is recombinantly conjugated to the Fc portion of human immunoglobulin (IgG). This fusion, coined “peptibody” (peptide + antibody), ostensibly combines the biological activity of the peptide with the in vivo persistence (long t1/2) associated with MAbs (4,5). The true bioactivity, t1/2, and overall in vivo fate of peptibody candidates, however, must be experimentally determined. Unlike MAbs, peptibodies are bioengineered chimeric constructs that do not occur naturally, and their stability cannot be predicted to be the same as the Fc substructure. For instance, stability may be impacted if the peptibody is expressed recombinantly from bacteria since it lacks the glycosylation normally associated with human Fc. Furthermore, the conjugated peptides may undergo biotransformation, especially with respect to enzymatic proteolysis.
Published studies of the biotransformation and in vivo metabolism of protein therapeutics in general have been limited. The assumption has been that the predominant breakdown products are small biologically inactive peptides that are innocuous, without impact on safety and/or efficacy. However, differential kinetic metabolism of protein therapeutics may occur. Prior to breakdown to a pool of small and fast-eliminating peptides, some larger metabolites may occur rapidly (for example, at an especially labile amino acid position). Some of these metabolites may demonstrate at least partial bioactivity, and the potential for off-target effects cannot be disregarded. For example, the biological peptide and its variable truncated forms may exhibit decreased or increased agonistic effect, or change to an antagonistic effect as in the case of human chemokine CCL15 (6). It is important to design a fusion protein with minimal liability with respect to in vivo stability. Therefore, structural and pharmacokinetic (PK) information about these metabolites can be used to re-engineer the construct to increase in vivo stability and to develop relevant assays for the appropriate PK monitoring studies.
The tools for studying in vivo metabolism of small molecule therapeutics have been developed and widely applied; however, these methods are generally not applicable to biotherapeutics. Ligand-binding assays (LBA) such as enzyme-linked immunosorbent assay (ELISA) are the workhorses for bioanalysis of protein therapeutics. In general, the specificity of the ELISA is mainly dependent on the specific capture/detection reagent pair. However, the assay-specific epitopes may not represent the biologically active regions of the construct, and the method may not be able to differentiate metabolic changes outside of the epitopes. As a result, molecular-level information about biotransformation and in vivo truncation is not easily obtainable by LBA.
Alternatively, molecular information can be directly acquired via mass spectrometry (MS) with exquisite mass resolution. Using techniques that have been well established by researchers in proteomics (7–11), proteins in plasma/serum samples can be analyzed by either top-down (intact) or bottom-up (peptide digests) methods where extensive chromatography or removal of highly abundant matrix proteins (e.g., albumin and IgG) is required to minimize matrix background. Instead of abundant protein depletion, separation from sample matrix proteins can be achieved by immunocapture (12). Lu et al. compared sample cleanup methods for a fusion protein, CNT0736, using albumin depletion, protein A capture, and anti-idiotypic antibody capture prior to LC-MS analysis. The protein A capture method appeared to be the best option because of readily available generic reagent and less demand in labor and time. However, one drawback of using protein A is the cross-reactivity with endogenous animal IgG, requiring bottom-up MS analysis to afford the necessary discrimination.
We have developed a methodology, ligand-binding mass spectrometry (LBMS), to analyze the temporal biotransformation of fusion proteins in preclinical study samples. This method combines the benefits of the selectivity of LBA with the specificity and molecular-level information of MS. For peptibodies, solid-phase ligand binding using a capture antibody specific to human Fc selectively captures and concentrates intact constructs and their metabolites from study samples without cross-reactivity to animal IgG. This is followed by interrogation by MS for specific structural information such as sites of in vivo truncation. We have developed a hierarchy of MS queries. First, matrix-assisted laser desorption ionization time-of-flight mass spectrometry (MALDI-TOF MS) is performed over a large mass range to survey the metabolic species in their single-charged state. If the metabolic profile is highly heterogeneous, the samples are subsequently queried by nanoscale liquid chromatography interfaced with electrospray ionization mass spectrometry (nanoLC-MS) to provide better mass resolution of the metabolites. Vulnerable loci can be accurately identified and subsequently stabilized through re-engineering. In addition, identification of prevalent and bioactive metabolites leads to the design of complementary LBA used for appropriate PK profiling of the bioactive species. The LBMS provides relative quantification of metabolites compared to the parent molecule at any given time point, while absolute quantification is achieved by LBA that is directed by LBMS results.
In this paper, we present the results of LBMS studies of three thrombopoietin (TPO)-mimetic peptibodies, namely AMG531, AMG195(linear), and AMG195(loop), that selectively bind and activate the c-Mp1 receptor and elevate platelet numbers in vivo (13,14). The advantages of the LBMS strategy to characterize biotransformation and corroborate LBA method development and data interpretation are illustrated and discussed with these examples.
MATERIALS AND METHODS
Materials
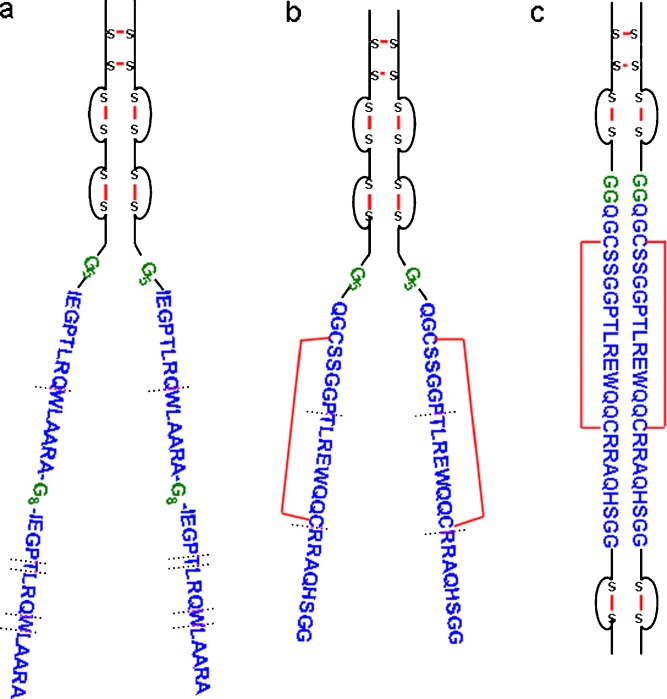
AMG531, AMG531 (1:1) analog, AMG195(linear), AMG195(loop), anti-human Fc monoclonal antibody (clone 1.35.1), rabbit anti-AMG531 polyclonal antibody and biotin conjugate, streptavidin–fibrinogen, and biotinylated mouse TPO receptor were provided by Amgen Inc. (Thousand Oaks, California, USA). AMG531 (romiplostim, Nplate®) contains two tandem repeats (2:2 form) of thrombopoietin-mimetic peptides (TMP) fused to the non-glycosylated human IgG1 Fc C terminus via a polyglycine (Gly5) linker (Fig. 1a). Each TMP consists of 14 amino acids separated by another polyglycine linker (Gly8) (13). The AMG531 (1:1) analog has only one unit of TMP instead of two conjugated to each chain of the Fc. AMG195(linear) has a structure that is similar to that of AMG531 (1:1) analog (Fig. 1b), with one TMP unit consisting of 24 amino acids, which has only slight homology to that of AMG531. AMG195(loop) is an analog of AMG195(linear) with the same TMP inserted internally into the Fc framework in the CH3 domain as opposed to fusion at the Fc C terminus (Fig. 1c). Insertion into the Fc framework at this position does not inhibit receptor binding and recycling via FcRn (Amgen Inc., unpublished results).
Fig. 1.
Structures of a AMG531, b AMG195(linear), and c AMG195(loop). Fc region is shown in black, TMP regions in blue, linkers in green, and disulfide bridges in red. In vivo proteolytic points are noted by hashed lines
Reagent or culture components including protein A, kanamycin, acids, salts, buffers, and organic solvents were reagent grade or better. The immunoaffinity pipet tips were prepared by Intrinsic Bioprobes (Phoenix, Arizona, USA) by covalent attachment of anti-human Fc antibody to activated silica-based resin. Other materials and corresponding vendors were HBS-EP buffer from Biacore Life Sciences (Piscataway, New Jersey, USA), streptavidin/poly-horseradish peroxidase (HRP) conjugate and Pico peroxide substrate from Thermo Fisher Scientific (Rockford, Illinois, USA), tetramethylbenzidine (TMB)–peroxide substrate solution from KPL (Gaithersburg, Maryland, USA), and blank control rat serum and plasma from Bioreclamation, Inc. (Hicksville, New York, USA).
Generation of Peptibody Constructs
All three peptibodies were cloned, expressed, and purified in a similar manner. The constructs were cloned into Escherichia coli-inducible expression vectors. Cells transformed with the constructs were grown in Terrific Broth (Teknova, Hollister, California, USA) supplemented with kanamycin at 37°C, and expression was induced for 6 h at 37°C. Expression was almost entirely driven to inclusion bodies. The frozen cell paste was defrosted in 5 volumes (w/v) of 50 mM Tris-HCl, pH 8.0, and 5 mM EDTA at room temperature. The suspended paste was passed through a microfluidizer twice at 12,000–14,000 PSI. The bulk sample was then centrifuged at 9,000–15,000×g at 4°C for 15–30 min, and the supernatant was discarded. The pellet was washed twice in 5 volumes of water. The pellet was then dissolved in a solution containing 6 M guanidine-HCl, 50 mM Tris, 10 mM dithiothreitol, pH 9.0, and incubated for 1 h at 25°C or 37°C. The reduced inclusion bodies were then added to refold buffer (50 mM Tris-base, 150 mM arginine-HCl, 2 M urea, pH 9.0, 4 mM cysteine, 3 mM cystamine-HCl, pH 9.0) and incubated for ~72 h at 4°C. At this point, depending on the construct, purification proceeded by protein A, cation exchange, or hydrophobic interaction chromatography, or combinations thereof, with the required concentration and buffer exchange steps. Final purified peptibodies were formulated in 10 mM acetic acid, 5% sorbitol, pH 5.0, and the concentration was determined by A280. Protein quality was determined by sodium dodecyl sulfate polyacrylamide gel electrophoresis analysis loading 0.5, 2, and 10 μg under both reducing and non-reducing conditions.
Preclinical Study Dosing
Sprague–Dawley rats were dosed intravenously (i.v.) or subcutaneously (s.c.) at concentrations of 0.3, 3, or 10 mg/kg of the construct as indicated in the figure legends. Serum or plasma samples were collected at the specified time points, aliquoted, and stored at −70°C. Samples were thawed to room temperature immediately before use.
LBMS
Ligand-Binding Sample Cleanup
Peptibodies and their Fc-conjugated metabolites were isolated from dosed rat samples using anti-human Fc immunoaffinity pipet tips. Before LB capture, samples were reduced with 5 mM Tris(carboxyethyl)phosphine for 30 min at room temperature. This reduction cleaved only the interchain Fc hinge disulfides and not the intrachain ones (data not shown). Iodoacetamide (15 mM) was added and incubated for 60 min at room temperature in the dark to alkylate the reduced cysteines. Negative (pre-dose plasma) and positive (blank plasma spiked with 10 μg/mL peptibody standard) controls were prepared and treated in an identical manner as the samples. The pre-treated controls and samples (60 μL) were diluted with 180 μL HBS-EP buffer and repeatedly passed through the anti-Fc affinity tips using the mixing function on an eLINE® electronic pipet (Biohit, Neptune, New Jersey, USA) for 60 min at room temperature. After LB capture, the tips were washed with HBS-EP, followed by 2 M aq. ammonium acetate, pH 7, containing 25% (v/v) acetonitrile (ACN), and then finally with three sequential water washes. For MALDI-TOF MS analysis, the affinity tips were eluted with 5 μL 12 mg/mL sinapinic acid (SA) in 33% (v/v) aq. ACN and 0.8% (v/v) trifluoroacetic acid and spotted directly onto a stainless steel target that had been pre-layered with a thin film of SA from 0.25 μL of 10 mg/mL SA in acetone. To increase sample loading for nanoLC-MS, three affinity tips were each eluted with 20 μL 33% aq. ACN, 3.3% (v/v) formic acid, pooled, and dried with a vacuum concentrator. The dried extract was resuspended in 12 μL 0.1% (v/v) aq. formic acid and 10 μL was analyzed by nanoLC-MS.
MALDI-TOF MS
MALDI-TOF MS spectra were acquired on an Autoflex™ II single-stage mass spectrometer (Bruker Daltonics, Billerica, Massachusetts, USA) equipped with a 337-nm N2 laser using an optimized linear positive ion mode method. External mass calibration in the range of 20,000–70,000 m/z was performed using a mixture of commercially available protein standards (Protein standard set II, Bruker Daltonics, Billerica, Massachusetts, USA). Laser power was set at a level just above the threshold of ion production, and sufficient shots were collected until the desired signal-to-noise was reached. Spectra were baseline corrected using a Convex Hull algorithm and were minimally smoothed using a Savitzky–Golay algorithm (width 20 m/z, one cycle) in flexAnalysis™ 3.0 software (Bruker Daltonics, Billerica, Massachusetts, USA). Spectra were plotted as relative intensity to the most abundant peak vs. m/z. In spectra without evident peaks, such as those corresponding to negative controls, the relative intensity is arbitrary and the baseline is generally expanded.
nanoLC-MS
An Eksigent (Dublin, California, USA) nanoLC-1D Plus™ HPLC system was used. Samples were loaded onto a Waters (Milford, Massachusetts, USA) Symmetry300 C18 5 μm NanoEase™ trapping column at 7.4 μL/min and then eluted onto a Grace (Deerfield, Illinois, USA) VYDAC® C18 75 × 250 μm column at a flow rate of 300 nL/min. The mobile phases were (A) 0.1% aq. formic acid and (B) 0.1% aq. formic acid/90% ACN. The gradient elution was isocratic at 1%B for 2 min, increased to 20%B over 3 min, to 60%B over 45 min, to 80%B over 5 min, followed by isocratic conditions at 80%B for 5 min, to 1%B over 5 min, and then isocratic conditions at 1%B for 5 min. Column effluent was sprayed from a New Objective (Woburn, Massachusetts, USA) PicoTip® silica emitter into an Applied Biosystems (Foster City, California, USA) 4000 Q TRAP® mass spectrometer equipped with the MicroIonSpray II interface. For MS acquisition, two enhanced multiply charged (EMC) scans monitoring 500–1,500 m/z were summed for each output scan. The MS method used a scan rate of 4,000 m/z s−1, a linear ion trap fill time of 20 ms, a Q3 energy barrier of 8 V, a Q3 empty time of 150 ms, a multi-charge separation barrier of 5 V, and enabled Q0 trapping. EMC spectra from a 1-min window were summed, smoothed, baseline subtracted, and deconvoluted for 20 iterations using the Bayesian Protein Reconstruct tool for the Applied Biosystems BioAnalyst™ 1.5 software.
Bioanalytical Assays of Dosed Samples
AMG531 Radioassay
AMG531 (60 μg) was labeled in the Fc region with 2 mCi of [125I]-Bolton–Hunter Reagent for 6 h at 4°C. The labeled AMG531 was chromatographically separated from unincorporated 125I. The labeled AMG531 was injected into rats, and radioactivity of trichloroacetic acid (TCA) precipitates of the dosed samples was measured by gamma scintillation counting. This assay quantified species containing human Fc that were precipitated by TCA.
LBA1—“Bridging” Assay of AMG531
Rabbit anti-AMG531 polyclonal antibody was coated onto polystyrene 96-well plates. Standards (STD) and quality controls (QC) were prepared by spiking AMG531 into control rat serum. STD, QC, study samples, and blank were loaded into the wells after dilution with assay buffer. The analytes were captured by the immobilized antibody. After a buffer wash step, the biotin conjugate of the same polyclonal antibody was added for detection, followed by the additions of streptavidin/HRP conjugate and then the TMB-peroxide substrate solutions for enzyme reaction and color development. Optical density was measured at 450 nm with reference to 650 nm. Data regression was performed using a four-parameter logistic model. This format ostensibly measured species containing bivalent TMP linked to Fc (either 2:2 or 1:1) because two TMPs were required to bind to each of the capture and detection antibodies.
LBA2—Fc/Peptide Assay for AMG531
The assay was run identically to that of LBA1 of AMG531, except that the detection antibody was replaced with the anti-human Fc monoclonal antibody. This format ostensibly measured species that contained any number of TMPs linked to Fc.
LBA3—Fc/Peptide Assay for AMG195 Constructs
The format was the same as that of LBA2 except for the following: The capture surface was prepared by coating 96-well plates with streptavidin–fibrinogen and then with biotinylated mouse TPO receptor, which bound to the streptavidin–fibrinogen coat. Thus, the assay specificity is governed by the TPO receptor instead of the polyclonal antibody in LBAs 1 and 2. This format required the TMP-Fc moiety that retained binding activity to the receptor. Additionally, the reporter signal was chemiluminescence using Pico peroxide substrate instead of the TMB–peroxide color development.
RESULTS
In Vivo Metabolism of AMG531 in Rat
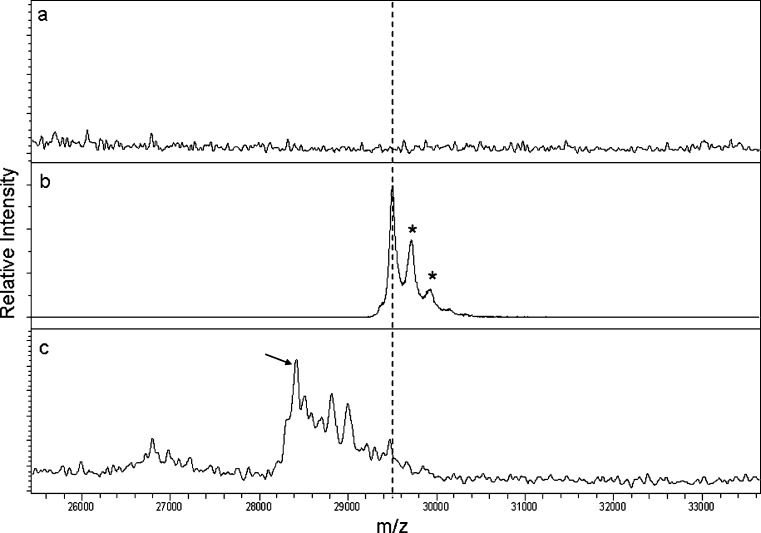
MALDI-TOF MS analysis revealed extensive metabolism of AMG531 after 24 h dosing in rat as shown in Fig. 2c. The mass spectral traces in Fig. 2a, b correspond to a pre-dose sample and plasma spiked with AMG531 as negative and positive controls, respectively. There was only one peak corresponding to the single-chain subunit mass of AMG531 (~29.5 kDa) in the positive control sample. The theoretical mass of AMG531 is 29,660 Da. The measured mass was therefore ~160 Da lower than expected. The bias in the MALDI-TOF MS measurement was most likely a result of a small error in the external mass calibration. The positive control serves to only show the position of the unmodified peptibody, while the relative mass differences between the parent peak and those of the metabolites are of utmost importance. Differential masses will not be affected by the small biases in the absolute mass measurements since this bias will be subtracted out in the calculated mass differences. The other two peaks at slightly higher m/z (+220 and +440 m/z) corresponded to SA adducts (mono and di, respectively). The metabolic profile of AMG531 appeared to be heterogeneous after 24 h as shown in Fig. 2c. There was a predominant peak (~28.5 kDa) resulting from a mass loss of 1.1 kDa, which likely corresponded to proteolysis between T260 and L261, with a theoretical mass difference of 1,066 Da.
Fig. 2.
MALDI-TOF MS analysis of AMG531 and its metabolites in samples from rats dosed i.v. at 10 mg/kg: a pre-dose (negative control), b AMG531 spiked into control plasma at 10 μg/mL (positive control), and c 24 h post-dose. The peak corresponding to intact AMG531 is indicated by the hashed line. The peaks marked with asterisk represent SA adducts. The arrow in c indicates the major metabolite of AMG531 corresponding to proteolysis between T260 and L261
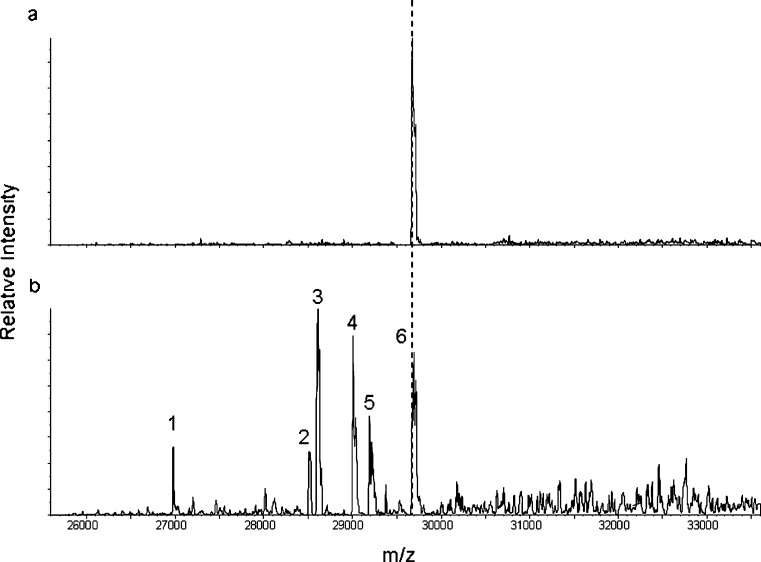
Due to heterogeneity of the metabolites, the 24-h post-dose sample was further queried by nanoLC-MS analysis (Fig. 3b). A 30-min post-dose sample was also analyzed as a positive control reference where minimal truncation was expected (Fig. 3a). A similar metabolic pattern of 24 h post-dose was observed by nanoLC-MS as that of MALDI-TOF MS; however, a higher resolution was achieved with the nanoLC-MS. With the increased resolution, the mass difference between AMG531 and the major metabolite was more precisely calculated as 1,080 Da. This further corroborated the proteolysis between T260 and L261 that is expected to result in a 1,066-Da mass loss, with only 1.3% error between measured and theoretical mass difference values. Furthermore, all the proteolytic points were assigned by the nanoLC-MS data with less than 4% error between the measured and theoretical mass differences of the metabolites and the parent AMG531 as summarized in Table I.
Fig. 3.
NanoLC-MS analysis of AMG531 and its metabolites in samples from rats dosed i.v. at 10 mg/kg: a 30 min and b 24 h post-dose. The 30-min spectrum shows only one peak corresponding to intact AMG531 (hashed line, peak 6). The peak numeric designation in b corresponds to peaks listed in Table I on identification of proteolytic points
Table I.
Identification of In Vivo Proteolytic Points of AMG531 by nanoLC-MS in Rat Samples at 24 h
| Peaka | Average mass | ∆m meas b | Proteolysis assignment | ∆m theo b | % Errorc |
|---|---|---|---|---|---|
| 1 | 26,975 | 2,718 | Q241/W242 | 2,689 | 1.1 |
| 2 | 28,522 | 1,171 | P259/T260 | 1,167 | <1 |
| 3 | 28,610 | 1,080 | T260/L261 | 1,066 | 1.3 |
| 4 | 29,006 | 687 | Q263/W264 | 669 | 2.7 |
| 5 | 29,192 | 501 | W264/L265 | 482 | 3.9 |
| 6 | 29,693 | 0 | Parent | 0 | N/A |
N/A not applicable
aPeak numbers based upon annotation in Fig. 3
b∆m meas and ∆m theo are the measured and theoretical mass differences between metabolite and parent
c

Impact of In Vivo Biotransformation on Understanding LBA Assays of AMG531 in Rat Plasma Samples
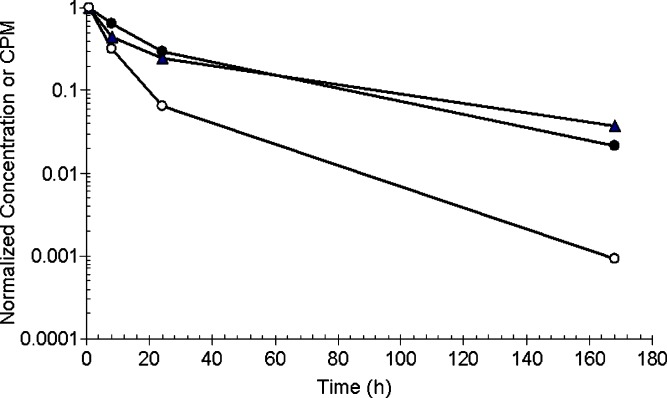
The radiolabeled AMG531 rat PK study was designed to compare AMG531 levels in rat serum samples by radioassay, LBA1 and LBA2. The PK time profiles from these assays are shown in Fig. 4. The observed concentrations of AMG531 using LBA2 were similar to those of the radioassay indicating that this assay was reflective of all the analytes associated with human Fc, including the intact AMG531 and its metabolites. While both LBAs require at least one intact TMP for capture, LBA1 requires the second TMP on the other chain for detection. The concentrations of AMG531 measured by LBA1 were consistently lower than those of LBA2 or the radioassay, with the disparity increasing over time.
Fig. 4.
Time and relative concentration profiles of AMG531 in rat serum samples after i.v. dosing of AMG531 and 125I-AMG531 at 0.3 mg/kg: LBA1 (open circles), LBA2 (filled circles), and radioassay (filled triangles). The radioassay CPM were not converted to equivalent concentration due to the lack of accurate radiospecificity. Therefore, the levels were normalized by the 1-h CPM (20,400) for radioassay or 1-h concentrations for LBA1 and LBA2 (3,230 and 3,420 ng/mL, respectively)
Considering the results of the LBMS study (Figs. 2 and 3), the gap in the profiles of LBA2 vs. LBA1 can be explained as the consequence of AMG531 in vivo truncation of the TMP chain(s). At the 1-h time point, LBA1 and LBA2 showed similar concentrations (3,230 and 3,420 ng/ml, respectively), which agreed with the MS spectral trace at 30 min showing the single peak of intact molecule without metabolite peaks (Fig. 3a). After 24 h, most of the proteolytic points appeared to occur in the terminal TMP subunit based upon the proteolysis assignments described in Table I, except for peak 1. The ratio of concentration from LBA1 to that of LBA2 after 24 h was ~0.2. Although not absolutely quantitative, an estimate of the contribution of AMG531 peak intensity to the sum of the intensities of all the peaks (AMG531 + metabolites) as shown in Fig. 3b is also ~0.2. Thus, this suggests that LBA1 was tracking only intact AMG531. Furthermore, since the ratio of the AMG531 peak intensity to the sum of all the peak intensities closely matched that of the ratio of concentrations from LBA1 to that of LBA2, one can approximate that the MS peak intensities of the parent and metabolites are reflective of actual concentration differences. Although peak intensities are a combination of both concentration and ionization efficiencies, it is not expected that ionization efficiency will vary greatly for these large metabolites where only small portions of the overall peptibody are lost.
In order to examine this issue further, three levels of QC, prepared by spiking AMG531 (1:1) analog, were assayed with AMG531 standards and QC using LBA1 and LBA2. The results of the QC recovery are shown in Table II. The LBA2 recovery was >93% for both AMG531 and the (1:1) analog indicating that the signal response would be similar for metabolites from terminal truncation up to at least one remaining TMP in each chain. However, for LBA1, only the intact AMG531 was recognized with >96% recovery while the 1:1 form was below quantifiable limits. Thus, the LBA1 bridging assay is specific for the analysis of the intact molecule while LBA2 can recognize the intact plus potential metabolites that retain at least one subunit of TMP in each chain.
Table II.
Comparison of QC Recovery of AMG531 and AMG531 (1:1) Analog from Spiked Rat Plasma Determined by LBA1 vs. LBA2
| QC sample spiked with | Spiked concentration (pg/mL) | LBA1 concentration (pg/mL) | LBA2 concentration (pg/mL) |
|---|---|---|---|
| AMG531 | 1,100 | 1,104 | 1,026 |
| AMG531 (1:1) analog | 1,100 | 24 | 1,194 |
| AMG531 | 200 | 192 | 200 |
| AMG531 (1:1) analog | 200 | <15a | 227 |
| AMG531 | 40 | 38 | 42 |
| AMG531 (1:1) analog | 40 | <15a | 53 |
QC quality controls, LBA ligand-binding assay
aThe LLOQ is 15 pg/mL
Quantification of AMG195(linear) and AMG195(loop) Using LBA3
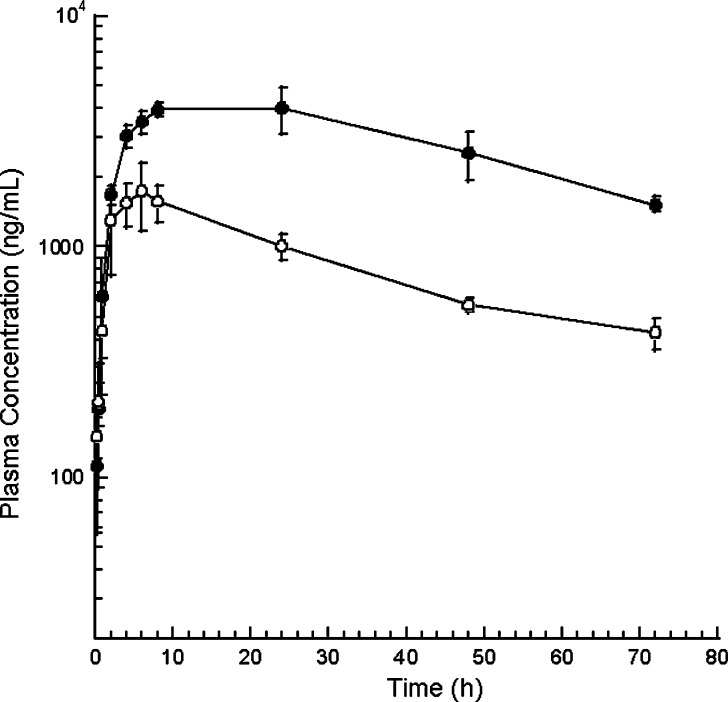
Concentrations of AMG195(linear) and AMG195(loop) in plasma samples from rats were determined using LBA3 (Fig. 5). Concentrations of AMG195(loop) were consistently higher than those of AMG195(linear). Since the same assay format was used, this disparity was not likely due to method differences. In contrast to AMG531, both forms of AMG195 contain only one TMP per single-chain subunit. Therefore, in vivo degradation of the peptides may lead to loss of the epitope region in the metabolites to be detected. Thus, the disparity in the concentrations was most likely due to more degradation of the linear construct compared to that of the loop construct. This hypothesis was tested by LBMS and the results are presented in the sections below.
Fig. 5.
Quantification of AMG195 in rat plasma samples after s.c. dosing of AMG195 constructs at 3 mg/kg: loop (filled circles) and linear (open circles) by LBA3
In Vivo Metabolism of AMG195(linear) in Rat
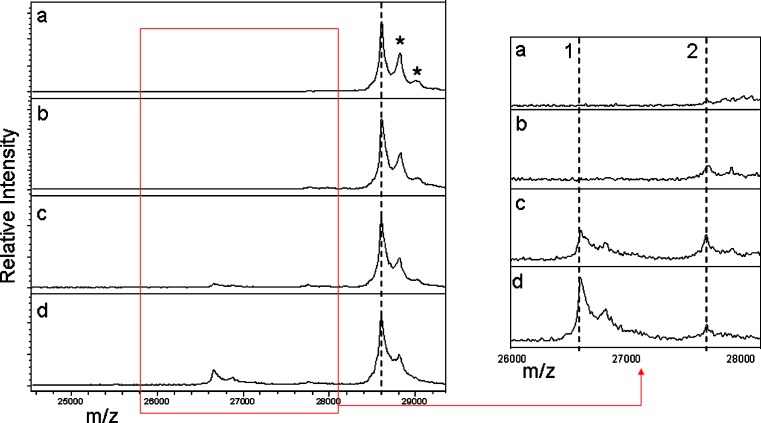
Increasing degradation is observed by LBMS in plasma samples collected at 2, 24, and 48 h. Figure 6a shows the positive control with one peak corresponding to the single-chain subunit of AMG195(linear) of ~28.6 kDa. Compared to AMG531, however, there was substantial intact AMG195(linear) present after 24 h (Fig. 6c) indicating that this molecule was more stable in vivo. Two prominent metabolites (~27.7 and ~26.7 kDa) appeared between 24 and 48 h. The larger metabolite appeared earlier than the smaller metabolite, with the peak corresponding to the smaller metabolite gaining greater intensity after 48 h (right side panel of Fig. 6). The larger-mass metabolite (peak 2) can be attributed to proteolysis between C249 and R250 with a theoretical mass of 27.8 kDa. The smaller-mass metabolite (peak 1) can be attributed to proteolysis between P241 and T242 with a theoretical mass of 26.8 kDa. It should be noted that the smaller-mass metabolite was only observed after reduction during the ligand-binding cleanup since its proteolytic point is located within an amino acid sequence between a disulfide bridge.
Fig. 6.
MALDI-TOF MS analysis of AMG195(linear) and its metabolites in samples from rats dosed i.v. at 10 mg/kg: a AMG195(linear) spiked into control plasma at 10 μg/mL (positive control); b 2, c 24, and d 48 h post-dose. The mass position of AMG195(linear) is noted by the hashed line in the left-side panels. SA adducts are marked asterisk. The right-side panels are a zoom of the m/z region bounded by the red box in the left-side panels. The mass positions of metabolites 1 and 2 are indicated by hashed lines in the zoom panels on the right side
In Vivo Metabolism of AMG195(loop) in Rat
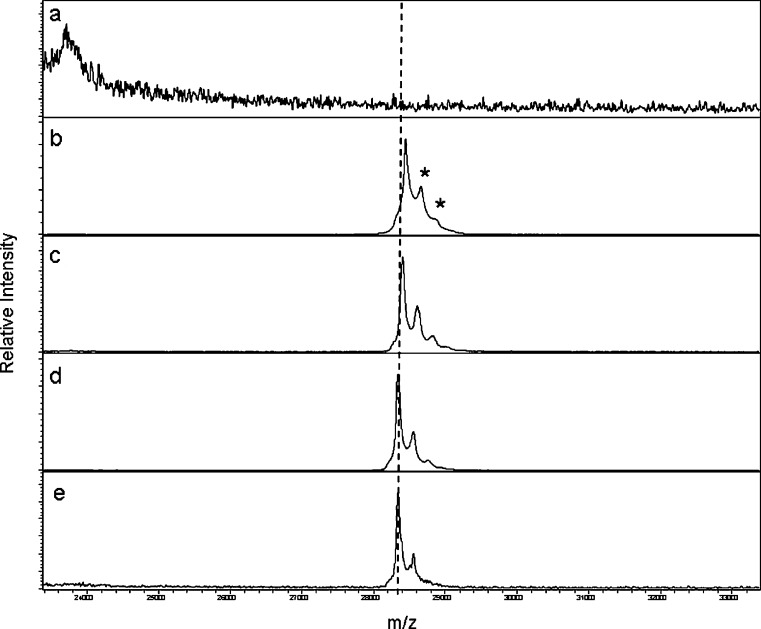
The LBMS results from rat plasma samples in Fig. 7 showed that AMG195(loop) was very stable in vivo. The pre-dose control plasma had low spectral background (panel a) while the positive control (panel b) had a peak corresponding to the AMG195(loop) single-chain subunit with m/z of ~28.4 kDa. Unlike the linear construct or AMG531, there was no evidence of any proteolysis or truncation through 48 h post-dose (panels c–e). Thus, loop incorporation of the bioactive peptide minimized degradation and biotransformation.
Fig. 7.
MALDI-TOF MS analysis of AMG195(loop) in samples from rats dosed i.v. at 10 mg/kg: a pre-dose, b AMG195(loop) spiked into control plasma at 10 μg/mL (positive control), c 2, d 24, and e 48 h post-dose. Mass position of intact AMG195(loop) is indicated by the hashed line. SA adducts (asterisk) are also noted. No other peaks corresponding to metabolism are apparent through 48 h
DISCUSSION
Choice of Ligand-Binding Capture and Process Optimization
We focus on the Fc-linked metabolites from proteolysis as opposed to the corresponding peptide fragments that are not linked to the Fc because the small fragments would be expected to be cleared rapidly. The human Fc portion of the constructs is stable in vivo and is used as a generic “handle” for the solid-phase ligand-binding capture for sample cleanup and analyte concentration of both the intact peptibodies and their metabolites. This cleanup approach is more attractive than other options of abundant protein depletion, protein A or G affinity capture, or multi-dimensional chromatography in terms of specificity, recovery, reduction of sample complexity, throughput, and user-friendliness (15). Although protein A or G columns are commercially available, we observed that substantial amount of the endogenous IgG will co-elute with the sample causing ion suppression in the MALDI-TOF MS. The specific capture by the anti-human Fc clone can be applied to study biotransformation of preclinical study samples from all species including non-human primates without significant cross-reactivity. To study biotransformation from clinical study samples, peptibodies and their metabolites can be selectively captured from human plasma with another anti-human Fc clone that has been developed in-house that does not cross-react with endogenous human IgG (unpublished data).
The process of ligand-binding capture was optimized by testing various solid-phase resin materials and wash conditions. The use of silica-based resin as opposed to polymeric materials such as polystyrene or polyacrylamide provided a chemically resistant support that could withstand a wide range of stringency wash buffers. In order to maximize recovery of bound analytes and minimize background from serum/plasma components, a stringency wash that included high salt (2 M ammonium acetate) and high organic phase (33% ACN) was selected. Extremely low background is typically observed as exemplified by the spectra of the negative controls (Figs. 2a and 6a) that are void of interfering peaks from serum/plasma proteins. Furthermore, as a result of the optimized washing strategy, there was no evidence of residual high abundance proteins such as serum albumin or the heavy chain of endogenous IgG (data not shown) which could reduce sensitivity and dynamic range caused by ion suppression.
Choice of MS Platform to Identify Truncation Points
The tiered approach of identifying proteolytic points first by MALDI-TOF MS and then by nanoLC-MS if needed proved to be effective and efficient for the three peptibody constructs. MALDI-TOF MS analysis is fast and provides data over a large mass range. Since the ionization process of MALDI produces predominantly single-charge state ions, the data output is easily interpreted. Additional high-resolution information from more time-consuming nanoLC-MS analysis may be required to examine peptibody metabolites that differ by only one or a few amino acids. For AMG531, with fast and heterogeneous metabolism in rat, the assignment of multiple proteolytic points required data from the nanoLC-MS.
AMG195(linear) was more stable than AMG531 with only two identified proteolytic points and less extensive metabolism throughout the studied time course. Since the metabolites were less heterogeneous and were sufficiently resolved by the MALDI-TOF MS analysis, their identification did not require follow-up by nanoLC-MS. The increased stability of AMG195 may be partially due to the disulfide bridge in the TMP (absent in that of AMG531) that may offer a tighter, more protected secondary structure. AMG195(loop) was the most stable construct of the three with no apparent truncation through 48 h. The identified proteolytic points for all three peptibodies are shown in the primary structures of Fig. 1. Clearly, placement of the TMP is crucial for optimal in vivo stability; protection against in vivo proteases was most efficient by incorporating the peptide within the Fc framework (loop).
Impact of Biotransformation on LBA Development and PK Profiles
The LBMS studies revealed very different biotransformation characteristics of the three TPO-mimetic peptibodies. The results explained differences in PK profiles and brought understanding about the corresponding LBA specificity as to what species were being measured. Of the two LBA formats used for AMG531, the bridging format (LBA1) detected predominantly intact AMG531 and not the metabolites whereas the Fc/peptide format (LBA2) apparently detected the intact and the Fc-conjugated metabolites. The LBA2 results were in agreement with those of the Fc radioassay. Furthermore, an AMG531 analog with only one TMP per Fc chain was quantified equivalently to AMG531 by LBA2 but not by LBA1. One explanation for LBA1 specificity is that the shorter stretch of single TMP may cause steric crowding of the reagents inhibiting binding and resulting in loss of signal. However, the truncated metabolites with at least one TMP unit (all identified peaks except for peak 1 in Table I) may be pharmacologically active; thus, the PK data from LBA1 may underestimate the drug exposure. LBA2 tracks the intact construct as well as all metabolites that contain at least one viable TMP to produce PK profiles that would more closely reflect pharmacological activity for more appropriate PK/PD modeling. However, the biological potency and immunoreactivity of the metabolites may vary with respect to their structures. Although the LBA2 format may detect all the potentially bioactive AMG531 metabolites, they are quantified by immunoreactivity in reference to the intact standard AMG531; thus, the results may not accurately reflect bioactivity since not all metabolites necessarily possess equal activity.
Results from LBMS also indicate that proteolysis may contribute to the gap between PK profiles from LBA data for the AMG195 constructs. LBMS revealed that AMG195(loop) was more stable than AMG195(linear), and this was reflected in LBA results using LBA3. As opposed to AMG531, AMG195 constructs contain only one TMP per peptibody single-chain subunit. Thus, peptide degradation most likely results in metabolites presumably with little or no bioactivity (assuming symmetric proteolysis on both single-chain subunits). Hence, truncation of the AMG195 peptides results in loss of overall signal using LBA3 since these metabolites can no longer bind to the TPO receptor capture surface. The LBMS results confirmed that LBA3 was a suitable format for the AMG195 peptibodies.
CONCLUSION AND PERSPECTIVES
LBMS is a powerful tool in early phase development of peptibodies to identify sites of biotransformation and offer information for structural improvement. It is interesting to note that biotransformation information is required for NDA filing of small molecule new chemical entities, but usually not for LBA filing of biologics. However, from a scientific perspective, it is important for the development team to know the in vivo liability of the candidates in order to choose the most robust molecule for development. It is recognized that a thorough understanding of the absorption, distribution, metabolism, and excretion properties of biologics is still lacking, partly due to the lack of available analytical tools/techniques (http://www.aapspharmaceutica.com/inside/focus_groups/Biother/index.asp). In this paper, we have described a strategic approach to study biotransformation of peptibodies and its application to three constructs targeting the TPO receptor. The conclusion is that this approach is effective and should be implemented to aid early drug candidate selection and design.
Using the comparative LBMS results of these constructs as well as data from other peptibodies, we are accumulating information toward general knowledge about the relationship of structure to in vivo stability (e.g., primary peptide sequence and placement relative to Fc) that can possibly be used for future in silico stability predictions. Indeed, within this study alone, there are motifs that may be warning signs for potential proteolytic liabilities in general. Specifically, as shown in Fig. 1, AMG531 appears to be especially labile around residues T5 and W9 of the TMP sequence, with proteolysis occurring on both N- and C-terminal sides. Furthermore, although the overall homology of the TMP sequences of AMG531 and AMG195 is low, a GPTLR motif is present in both TMPs. In this motif, the threonine is labile in both AMG531 and AMG195(linear); however, it appears to be stabilized in AMG195(loop).
We have extended this general LBMS approach to other novel peptide/protein fusions at early preclinical phase to understand potentially project-derailing issues of in vivo instability. To date, with only a couple of exceptions, we have observed little difference in location of in vivo truncation sites among preclinical species (data not shown) although the kinetics can be vastly different (e.g., metabolism occurs much more rapidly in rodents vs. monkeys). Furthermore, we are in the process of designing confirmatory studies to verify that we can generally extrapolate LBMS results from preclinical studies to humans.
In addition, this strategy offers a complementary method to understand exactly what a LBA is measuring and guide the development of appropriate assay formats to generate PK data that truly reflect the relevant molecular species. During the early preclinical phase, specific reagents for LBA may not be available, and the non-specific LBA frequently employed measures both intact analyte and its metabolites. It is important to use the molecular knowledge from LBMS to develop differentiating LBA to provide understanding of the kinetics of the bioactive vs. inactive moieties in subsequent studies. The relationship of immunoreactivity of LBA and structural information from LBMS would require the development of sensitive bioassays to link immunoactivity and molecular structure to biological activity. For future work, we will investigate the use of in vitro bioassays to compare bioactivity differences among protein drug metabolites in relation to immunoreactivity.
Finally, the LBMS method is relatively quantitative in that it reveals the abundance of biotransformed species relative to the parent construct at various time points. The LBMS method does not consider other mechanisms of clearance than catabolism. A quantitative LB-LC-MS method could be developed and would possibly negate the need for LBA development. However, it is presumably more efficient and cost-effective to develop an appropriate LBA guided by LBMS because of the superior throughput and sensitivity of LBA, especially for clinical studies. Once the best construct is selected and the optimal LBA established, then concentrations of the biotherapeutic and its bioactive metabolites can be reliably determined.
Acknowledgments
We would like to thank the following Amgen colleagues: Yow-Ming Wang and Graham Molineux for insightful discussions and critical review of this manuscript and Marcus Soto, Stan Mallard, Tian Wang, Han Gunn, and Teresa Wong for their contributions to the preclinical studies.
References
- 1.Cummings SR, San Martin J, McClung MR, Siris ES, Eastell R, Reid IR, et al. Denosumab for prevention of fractures in postmenopausal women with osteoporosis. N Engl J Med. 2009;361(8):756–65. doi: 10.1056/NEJMoa0809493. [DOI] [PubMed] [Google Scholar]
- 2.Banerjee S, Flores-Rozas H. Monoclonal antibodies for targeted therapy in colorectal cancer. Cancer Biol Ther. 2010;9(8):563–71. doi: 10.4161/cbt.9.8.11403. [DOI] [PubMed] [Google Scholar]
- 3.Klettner A, Roider J. Treating age-related macular degeneration—interaction of VEGF-antagonists with their target. Mini Rev Med Chem. 2009;9(9):1127–35. doi: 10.2174/138955709788922665. [DOI] [PubMed] [Google Scholar]
- 4.Suzuki T, Ishii-Watabe A, Tada M, Kobayashi T, Kanayasu-Toyoda T, Kawanishi T, et al. Importance of neonatal FcR in regulating the serum half-life of therapeutic proteins containing the Fc domain of human IgG1: a comparative study of the affinity of monoclonal antibodies and Fc-fusion proteins to human neonatal FcR. J Immunol. 2010;184(4):1968–76. doi: 10.4049/jimmunol.0903296. [DOI] [PubMed] [Google Scholar]
- 5.Peters RT, Low SC, Kamphaus GD, Dumont JA, Amari JV, Lu Q, et al. Prolonged activity of factor IX as a monomeric Fc fusion protein. Blood. 2010;115(10):2057–64. doi: 10.1182/blood-2009-08-239665. [DOI] [PubMed] [Google Scholar]
- 6.Escher SE, Forssmann U, Frimpong-Boateng A, Adermann K, Vakili J, Sticht H, et al. Functional analysis of chemically synthesized derivatives of the human CC chemokine CCL15/HCC-2, a high affinity CCR1 ligand. J Pept Res. 2004;63(1):36–47. doi: 10.1046/j.1399-3011.2004.00102.x. [DOI] [PubMed] [Google Scholar]
- 7.Pernemalm M, Orre LM, Lengqvist J, Wikstrom P, Lewensohn R, Lehtio J. Evaluation of three principally different intact protein prefractionation methods for plasma biomarker discovery. J Proteome Res. 2008;7(7):2712–22. doi: 10.1021/pr700821k. [DOI] [PubMed] [Google Scholar]
- 8.Anderson NL, Jackson A, Smith D, Hardie D, Borchers C, Pearson TW. SISCAPA peptide enrichment on magnetic beads using an in-line bead trap device. Mol Cell Proteomics. 2009;8(5):995–1005. doi: 10.1074/mcp.M800446-MCP200. [DOI] [PMC free article] [PubMed] [Google Scholar]
- 9.Bandow JE. Comparison of protein enrichment strategies for proteome analysis of plasma. Proteomics. 2010;10(7):1416–25. doi: 10.1002/pmic.200900431. [DOI] [PubMed] [Google Scholar]
- 10.Wang H, Hanash S. Electrospray mass spectrometry for quantitative plasma proteome analysis. Meth Mol Biol. 2009;564:227–42. doi: 10.1007/978-1-60761-157-8_13. [DOI] [PMC free article] [PubMed] [Google Scholar]
- 11.Wang H, Hanash S. Intact-protein based sample preparation strategies for proteome analysis in combination with mass spectrometry. Mass Spectrom Rev. 2005;24(3):413–26. doi: 10.1002/mas.20018. [DOI] [PubMed] [Google Scholar]
- 12.Lu Q, Zheng X, McIntosh T, Davis H, Nemeth JF, Pendley C, et al. Development of different analysis platforms with LC-MS for pharmacokinetic studies of protein drugs. Anal Chem. 2009;81(21):8715–23. doi: 10.1021/ac901991x. [DOI] [PMC free article] [PubMed] [Google Scholar]
- 13.Molineux G, Newland A. Development of romiplostim for the treatment of patients with chronic immune thrombocytopenia: from bench to bedside. Br J Haematol. 2010;17:1365–2141. doi: 10.1111/j.1365-2141.2010.08140.x. [DOI] [PubMed] [Google Scholar]
- 14.Cersosimo RJ. Romiplostim in chronic immune thrombocytopenic purpura. Clin Ther. 2009;31(9):1887–907. doi: 10.1016/j.clinthera.2009.09.013. [DOI] [PubMed] [Google Scholar]
- 15.Nedelkov D. Mass spectrometry-based immunoassays for the next phase of clinical applications. Expert Rev Proteomics. 2006;3(6):631–40. doi: 10.1586/14789450.3.6.631. [DOI] [PubMed] [Google Scholar]


