Abstract
Recent publications have emphasized the lack of characterization methods available for protein particles in a size range comprised between 0.1 and 10 μm and the potential risk of immunogenicity associated with such particles. In the present paper, we have investigated the performance of light obscuration, flow microscopy, and Coulter counter instruments for particle counting and sizing in protein formulations. We focused on particles 2–10 μm in diameter and studied the effect of silicon oil droplets originating from the barrel of pre-filled syringes, as well as the effect of high protein concentrations (up to 150 mg/ml) on the accuracy of particle characterization. Silicon oil was demonstrated to contribute significantly to the particle counts observed in pre-filled syringes. Inconsistent results were observed between different protein concentrations in the range 7.5–150 mg/ml for particles <10 μm studied by optical techniques (light obscuration and flow microscopy). However, the Coulter counter measurements were consistent across the same studied concentration range but required sufficient solution conductivity from the formulation buffer or excipients. Our results show that currently available technologies, while allowing comparisons between samples of a given protein at a fixed concentration, may be unable to measure particle numbers accurately in a variety of protein formulations, e.g., at high concentration in sugar-based formulations.
Key words: biopharmaceuticals, protein, sub-visible particles
INTRODUCTION
A considerable emphasis has been put recently on sub-visible particulate matter in protein pharmaceuticals. Pharmacopeias only specify limits for sub-visible particles >10 μm and concerns have been expressed that sub-visible particles <10 μm may present a significant safety risk in terms of immunogenicity (1–4). The extent of the safety risk is subject to debate and needs to be further assessed (5) but nevertheless a gap has been identified in analytical techniques for protein particles in the size range 0.1–10 μm. If biological responses such as immunogenicity are tentatively correlated to the size, nature, or number of sub-visible particles, analytical tools that allow an accurate characterization and quantitation of sub-visible particulate matter <10 μm in protein formulations would be needed.
Light obscuration, flow microscopy, and the Coulter counter are three commercially available particle-counting techniques able to characterize particles >2 μm. The three methods have been recently reviewed (6,7) and used in work summarized in recent publications to study nucleation phenomena in protein solutions (8,9). Flow microscopy has received a lot of attention for the characterization of protein formulations (10–12) while nanoparticle tracking analysis (NanoSight) showed promising results for the characterization of sub-micron particles in carefully chosen conditions (13). The aim of the present work was to identify the limitations of light obscuration, flow microscopy, and the Coulter counter when analyzing protein solutions. An emphasis has been put on high-concentration solutions since such formulations are increasingly being developed for subcutaneous administration (14,15), an administration route especially prone to trigger immune responses (3). In addition, these high-concentration samples have been evaluated after storage in pre-filled syringes coated with silicone oil. Potential interferences in analysis and detection of particulates due to the presence of silicon oil droplets are also discussed.
MATERIALS AND METHODS
Materials
MAb1 is a recombinant humanized IgG1 with a κ light chain and is expressed in Chinese hamster ovary cells at Genentech, Inc. (South San Francisco, CA, USA). The MAb1 drug substance was formulated at 150 mg/ml in 20 mM histidine hydrochloride, 200 mM arginine hydrochloride, 0.04% polysorbate 20 at pH 6.0 and stored at −70°C in polyethylene terephtalate bottles. MAb1 was stored either 3 days at 2–8°C in 1-ml BD pre-filled syringes coated with silicon oil (“MAb1 drug substance in pre-filled syringes”) or >6 years at 2–8°C in 1-ml BD pre-filled syringes coated with silicon oil (“aged MAb1 pre-filled syringes”). For the comparison of light obscuration, flow microscopy, and the Coulter counter methods, the contents of ~25 aged MAb1 pre-filled syringes were pooled and mixed in an Accuvette ST container (Beckman Coulter, Fullerton, CA, USA). The pooled solution was diluted with formulation buffer to 45, 30, 15, and 7.5 mg/ml in separate Accuvette ST containers. Each solution (including the formulation buffer alone) was analyzed first on the Coulter counter, then on the flow microscopy instrument and finally on the light obscuration counter. All measurements were performed the same day, from the same container, in triplicate (see below).
To test the limits of the instruments in terms of viscosity and conductivity, MAb1 was also formulated at 125 mg/ml in 15 mM histidine hydrochloride, 255 mM sucrose, 0.03% polysorbate 20 at pH 6.0 (“low conductivity MAb1 solution”). The viscosity of the low-conductivity MAb1 solution was ~80 mPa·s at room temperature. The low-conductivity MAb1 solution was diluted in formulation buffer to 20 and 1 mg/ml MAb1 to evaluate the response of the instruments upon dilution.
Protein X is a recombinant human protein produced in E. coli at Genentech, Inc. Protein X was formulated at 5 mg/ml and degraded by 1-year storage at 2–8°C in the presence of significant levels of silicon oil (0.2–0.3 mg silicon oil/ml of Protein X solution).
Light Obscuration
Light obscuration measurements were performed on a HIAC Royco Liquid Particle Counting System Model 9703 with sensor model HRLD-150 and sampler model 3000A, equipped with a 1-ml syringe (Hach Company, Loveland, CO, USA). The light obscuration instrument was placed in a laminar flow hood. The performance of the instrument was verified using 10 μm polystyrene count and size standards (Thermo Scientific, Fremont, CA, USA). For each protein solution and formulation buffer, four 1-ml aliquots were sampled at a speed of 10 ml/min; the first aliquot was discarded and the results of the three following aliquots were averaged. The aliquots differ significantly from the USP method and were chosen to reduce the sample volume needed to perform the measurements. Other authors have shown that small sampling volumes are appropriate for quantifying size and levels of sub-visible particles at the amounts typically present in protein therapeutics (16,17). All light obscuration measurements (total counts >2 μm uncorrected for the dilution factor) were well below the upper count limit of 18,000 particles/ml.
Flow Microscopy
Flow microscopy measurements were performed on a DPA4100 series B Micro-Flow Imaging™ instrument (Brightwell Technologies Inc., Ottawa, Canada) equipped with a computer-controlled peristaltic pump and a low magnification, 400-μm-deep flow cell. The flow microscope was placed in a laminar flow hood. The performance of the instrument was verified using 10 μm polystyrene count and size standards. For each protein solution and the formulation buffer, a 1-ml aliquot was used as following: 0.22 ml was used to flush the flow cell, 0.1–0.2 ml was used to optimize the illumination and 0.5 ml was analyzed. Two subsequent 1-ml aliquots were used as follows: 0.22 ml was used to flush the flow cell and 0.7 ml was analyzed. The three measurements were averaged.
Coulter Counter
Coulter counter measurements were performed on a Multisizer 4 instrument equipped with a 100-μm aperture (Beckman Coulter, Fullerton, CA, USA). The inside of the aperture tube was filled with Isoton II Diluent (Beckman Coulter, Fullerton, CA, USA). Standards as well as samples were analyzed in Accuvette ST containers (Beckman Coulter, Fullerton, CA, USA). The aperture tube calibration was checked daily with 10-μm latex size standards diluted in Isoton II. Each protein solution or formulation buffer was transferred into a clean Accuvette ST container before measurement and three 1-ml aliquots were analyzed and averaged.
For the measurements of the low-conductivity MAb1 solution (see Materials), the inside of the aperture tube was flushed with formulation buffer (15 mM histidine hydrochloride, 255 mM sucrose, 0.03% polysorbate 20 at pH 6.0). The aperture tube calibration was performed with size standards diluted in the formulation buffer. To accommodate for the high-viscosity samples (80 mPa·s), the instrument vacuum was set to 6.5 in. of mercury and the minimum flow was set to 5 μl/s.
Microscopy
Particle counts were assessed by the USP Chapter 788 “Microscopic particle count test” with the following modifications: 10–11 ml of each protein solution (or formulation buffer) was pooled and filtered; particles >5, >10, and >25 μm were counted and reported.
Refractive Index Measurements
The refractive index of the buffers and protein solutions was determined at 20°C on a LR-01 refractometer (Maselli misure, Milan, Italy). Temperature control (± 0.03°C) was provided by an Isotemp 3015 S recirculating water bath (Fisher Scientific, Waltham, MA, USA). Three measurements were averaged for each sample.
Viscosity Measurements
The viscosity of protein solutions was measured at 25°C on a MCR300 rheometer (Anton Paar, Graz, Austria) as described previously (18). Briefly, the samples were allowed to reach thermal equilibrium and then went through two cycles of shear rate sweeps ranging from 10 to 1,000 s−1. We reported the mean viscosity at a shear rate of 1,000 s−1.
RESULTS
Known Operating Limitations of Particle-Counting Instruments
Light obscuration, flow microscopy, and Coulter counter instruments are based on different principles and therefore require different operating conditions. All three techniques are intended for low-viscosity samples (with the exception of the Coulter counter equipped with larger apertures, a case irrelevant to the discussion).
Light obscuration instruments are used to characterize particles >2 μm and provide quick measurements with a drawing speed of 10 ml/min for the configuration described in MATERIALS AND METHODS. They are however limited to a total particle count of 18,000 particles/ml; samples may need to be diluted to fall within this range.
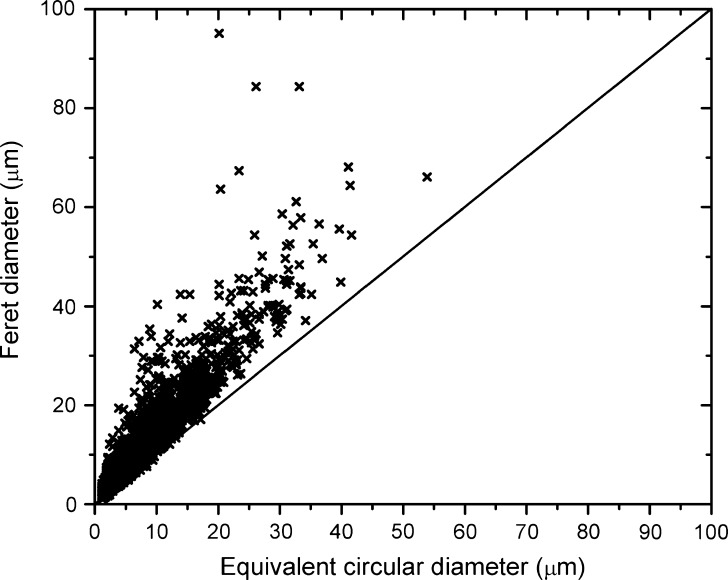
Flow microscopy (in low-magnification mode) measures particles >2 μm. Flow microscopy's particle count limit is much higher than light obscuration's: the DPA4100 instrument described in MATERIALS AND METHODS is able to characterize solutions containing up to 275,000 particles/ml (2.5-μm particles) or 125,000 particles/ml (5-μm particles) or 30,000 particles/ml (10-μm particles). Flow microscopy also has imaging capabilities which may be useful in the characterization of irregular particles (19). Figure 1 shows that for a heavily aggregated protein sample, fibrillar particles of length close to 100 μm can be reported as a spherical particle having an equivalent circular diameter of ~20 μm; other authors have presented a more detailed analysis of this phenomenon (10,11). Light obscuration and Coulter counters only report equivalent diameters without any information on morphology; therefore, they would not describe fibrillar particles accurately. Shape parameters are beneficial for sample characterization, even though only a 2-D projection of the particle is available.
Fig. 1.
Irregular shape of protein particles determined by flow microscopy. Protein X was degraded by high-temperature storage in the presence of significant levels of silicon oil. Fibrillar particles with a largest dimension (Feret diameter) of close to 100 μm showed a corresponding equivalent circular diameter of ~20 μm
Coulter counters measure particles in a size range defined by the aperture size that is used. We used a 100 μm aperture, which allows particles 2–60 μm in diameter to be counted and characterized. Larger particles may block the aperture. Since the Coulter principle is based on impedance measurements, the optical properties of the sample are irrelevant but the sample must be dispersed in an electrolyte. The formulation buffer of MAb1 provided enough conductivity for Coulter counter measurements due to the presence of 200 mM arginine hydrochloride and 20 mM histidine chloride but other formulation buffers (e.g., sugar-based) may not be used directly. Dilution in stronger electrolytes (e.g., saline or Isoton II diluent) is possible but may change the properties and particle size distribution of the solution. The sensitivity of the protein to dilution in high-conductivity buffers has to be evaluated on a case-by-case basis.
Interference from Non-Particulate Matter: Silicon Oil
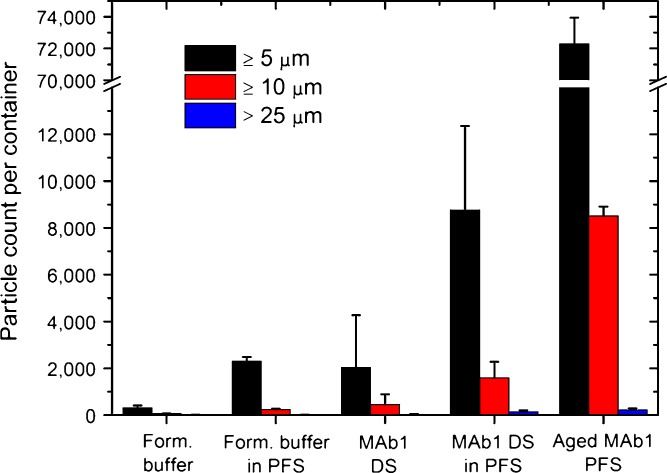
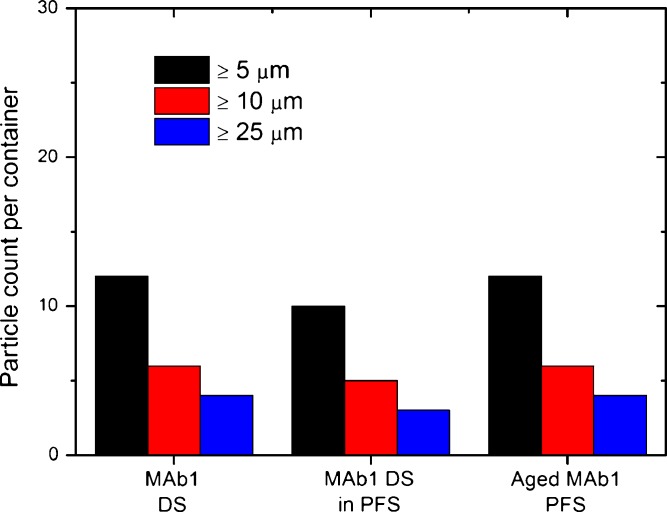
The barrel of glass pre-filled syringes is usually coated with silicon oil to facilitate the motion of the plunger. In order to evaluate the impact of the silicon oil coating on particle counts, MAb1 drug substance was incubated for 3 days at 2–8°C in 1-ml prefillable glass syringes. The resulting particle count was compared to the fresh drug substance as well as to MAb1 pre-filled syringes aged for >6 years at 2–8°C. Figure 2 shows an increase in particle counts by flow microscopy after 3 days of exposure to a siliconized syringe barrel at 2–8°C; the increase was even more pronounced after prolonged storage. The same trends were observed by light obscuration (data not shown). An increase in particle counts was observed for both the formulation buffer and the MAb1 drug substance stored in prefillable syringes when compared to storage in vials; the increase in particle counts was however more pronounced for MAb1 drug substance. Our hypothesis is that the increase in particle counts was due to silicon oil sloughing off of the syringe barrels as opposed to protein particle formation. The higher number of particles counted after a short-time exposure of the MAb1 drug substance to siliconized syringe barrels can be explained by the significant surface activity of a concentrated antibody solution (20). Upon longer-term storage in pre-filled syringes, more silicon oil droplets were formed. In order to prove that the increase in particle counts was due to silicon oil sloughing off of the syringe barrels, a slightly modified USP Chapter 788 “Microscopic particle count test” was performed on all solutions (see MATERIALS AND METHODS). Silicon oil droplets are not retained by or visible on the filter and therefore only particulate matter is counted by the microscopic particle count test (21). Figure 3 shows that the modified USP Chapter 788 microscopic particle count test found similar levels of particulate matter in all samples. The similar level of particulate matter observed between MAb1 drug substance stored in vials and stored in pre-filled syringes indicates that the silicon oil was indeed not visible on the filter. The similar level of particulate matter observed between the MAb1 drug substance after 3 days and >6-years storage in pre-filled syringes at 2–8°C show that the increase in particle counts observed by light obscuration and flow microscopy in pre-filled syringes can be attributed to silicon oil droplets and not particulate matter (proteinaceous or not).
Fig. 2.
Influence of silicon oil on particle counts determined by flow microscopy. DS, drug substance; PFS, pre-filled syringes. Results are reported as average ± standard deviation. Storage of the formulation buffer and drug substance for 3 days in pre-filled syringes (MAb1 DS in PFS) resulted in a significant increase in particle counts. Pre-filled syringes stored for >6 years (Aged MAb1 PFS) showed an even higher particle count (note the axis break)
Fig. 3.
Influence of silicon oil on particle counts determined by a modified version of the USP Chapter 788 “Microscopic particle count test”. DS, drug substance; PFS, pre-filled syringes. Silicon oil droplets are not retained by the filter. Similar counts were obtained for the drug substance before and after storage in pre-filled syringes, as well as for the pre-filled syringes stored >6 years at 2–8°C (Aged MAb1 PFS). The increase in particle numbers observed by flow microscopy and light obscuration upon storage in pre-filled syringes can be attributed to silicon oil droplets and not to protein (or extraneous) particles
The Effect of Protein Concentration on Particle Counts
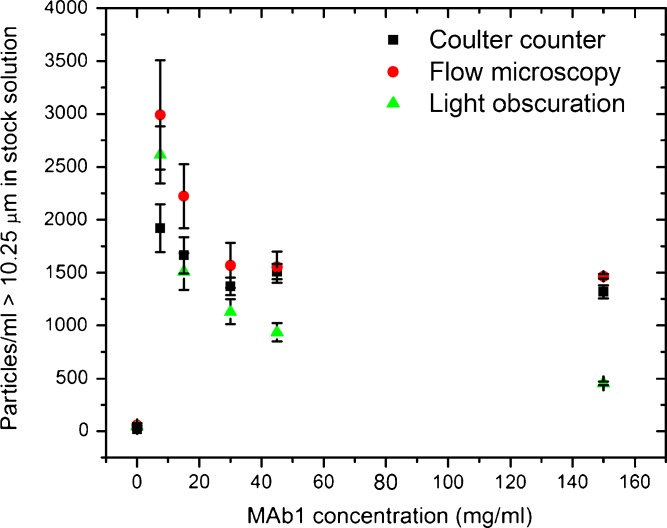
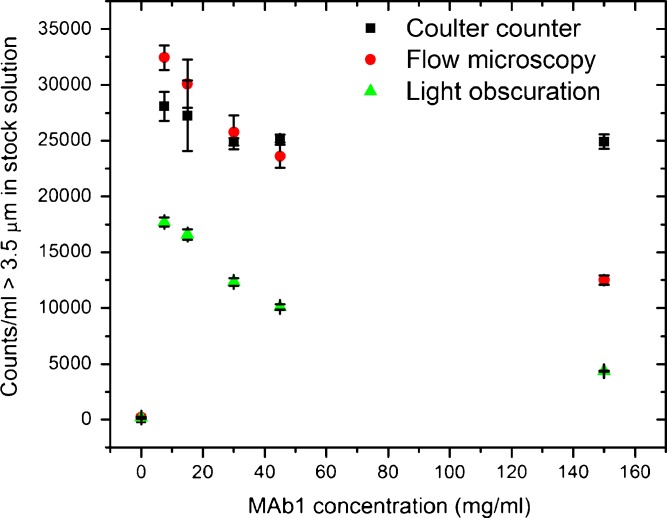
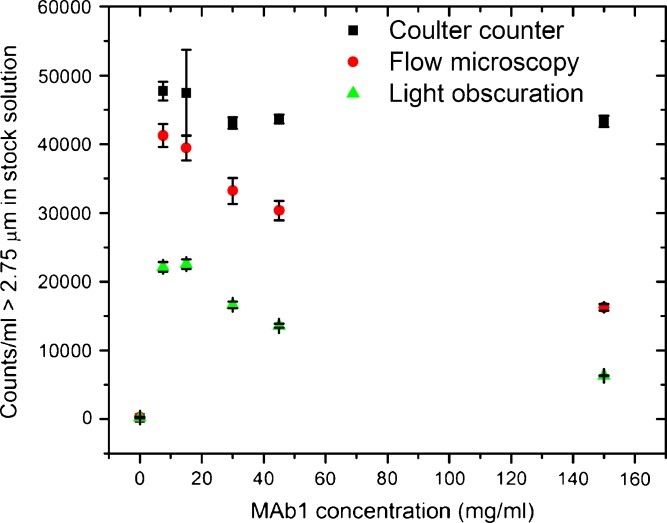
An increasing number of therapeutic proteins, especially monoclonal antibodies, are now formulated at high concentrations (150 mg/ml and more) (14,15). We investigated the effect of high protein concentration on three particle-counting methods: Coulter counter, light obscuration, and flow microscopy. As described in MATERIALS AND METHODS, MAb1 solutions at 150 mg/ml stored in pre-filled syringes were diluted to concentrations ranging from 7.5 to 150 mg/ml and the particle counts obtained from Coulter counter, flow microscopy, and light obscuration were compared. As described in the previous section, most of the particle counts can be attributed to silicon oil droplets. Shape analysis of the particles >5 μm by flow microscopy also supports the attribution of the counts to silicon oil, e.g., in the 15 mg/ml solution >80% of the particles ≥5 μm had an aspect ratio ≥0.85. Once samples are withdrawn from the pre-filled syringes, silicon oil droplets should give consistent counts after dilution, i.e., two times dilutions should result in half the counts since dilution in the presence of surfactant (polysorbate 20 from the formulation buffer) is not expected to alter the stability of the emulsion. Figures 4, 5, and 6 present the particle counts in the 150 mg/ml stock solution, determined at several dilution levels. Since the data are corrected for the dilution factor, the instruments were expected to show the same particle counts in all conditions. Figure 4 shows counts of particles 10.25 μm and larger. Relatively large standard deviations are observed that can be attributed to the low particle counts in the solutions; e.g., in the case of the 7.5-mg/ml solution, the raw particle count from the Coulter counter was 96 particles/ml, which corresponds to 1,920 particles/ml in the stock solution once multiplied by the dilution factor (20). The uncertainty on a 96 particles/ml measurement translates to a larger error on the dilution-corrected count. With the exception of the light obscuration measurement performed at 150 mg/ml, the values from the three instruments are in reasonable agreement.
Fig. 4.
Comparing the performance of Coulter counter, flow microscopy, and light obscuration instruments for particles >10.25 μm in protein solutions. Results are reported as average ± standard deviation. Counting was performed at several protein concentrations; the reported particle numbers have been corrected for the dilution factor and represent the particle content of the stock (150 mg/ml) solution. The three instruments reported similar results, with the exception of light obscuration which underestimated the particle numbers when performing the measurement at 150 mg/ml. The particle counts of the formulation buffer are included (0 mg/ml)
Fig. 5.
Comparing the performance of Coulter counter, flow microscopy, and light obscuration instruments for particles >3.5 μm in protein solutions. Results are reported as average ± standard deviation. Counting was performed at several protein concentrations; the reported particle numbers have been corrected for the dilution factor and represent the particle content of the stock (150 mg/ml) solution. The Coulter counter gave consistent measurements across the studied protein concentrations. Up to 45 mg/ml, flow microscopy gave results similar to the Coulter counter but showed lower counts at 150 mg/ml. Light obscuration reported lower particle numbers than both flow microscopy and the Coulter counter in all the solutions. The particle counts of the formulation buffer are included (0 mg/ml)
Fig. 6.
Comparing the performance of Coulter counter, flow microscopy, and light obscuration instruments for particles >2.75 μm in protein solutions. Results are reported as average ± standard deviation. Counting was performed at several protein concentrations; the reported particle numbers have been corrected for the dilution factor and represent the particle content of the stock (150 mg/ml) solution. The Coulter counter gave consistent measurements across the studied protein concentrations. Both optical methods (flow microscopy and light obscuration) reported lower particle numbers than the Coulter counter. The particle counts of the formulation buffer are included (0 mg/ml)
Figure 5 shows counts of particles 3.5 μm and larger. The Coulter counter gave consistent measurements across the studied protein concentrations. Up to 45 mg/ml, flow microscopy gave results similar to the Coulter counter but showed lower counts at 150 mg/ml. Light obscuration reported lower particle numbers that both the Coulter counter and flow microscopy. Figure 6 shows counts of particles 2.75 μm and larger. Again, the Coulter counter gave consistent results for protein concentrations ranging from 7.5 to 150 mg/ml. Both light obscuration and, to a lesser extent, flow microscopy counted less particles than the Coulter counter. Both optical techniques showed a similar trend: lower counts were reported at high protein concentrations.
Optical techniques (light obscuration and flow microscopy) tended to report lower particle numbers than the Coulter counter, especially for smaller particles sizes and higher protein concentrations. The lower sensitivity of optical techniques probably arises from a lower contrast typical of high-concentration protein formulations (19). The contrast that allows optical detection of particles is caused by a difference in refractive index between the particle and the surrounding medium. The refractive index of the particles does not change but the refractive index of the surrounding medium increases with an increasing (monomeric) protein concentration, thus reducing the difference in refractive index and therefore contrast. In the case of MAb1, the formulation buffer has a refractive index of 1.3419, the 150 mg/ml MAb1 formulation has a refractive index of 1.37151 and the silicon oil that is responsible for most of the particle counts in this particular sample has a refractive index of 1.4042. From 0 to 150 mg/ml, the difference in refractive index (contrast) drops from 0.0623 to 0.0327. The refractive index of protein particles is likely comprised between 1.4 and 1.6 but the detection of protein particles may be further compromised by their irregular shape and indistinct edges (19). Sharma et al. have shown that light obscuration was more affected than flow microscopy by low contrast between the particles and the surrounding buffer (12), which is consistent with our findings that light obscuration detected less particles than flow microscopy for most particle sizes.
We hypothesize that optical techniques are likely to be undercounting particles (rather than the Coulter counter overestimating the particle count), based on the good agreement between flow microscopy and Coulter counter—two orthogonal techniques—at low concentrations and for larger particle sizes. The reduced contrast in solutions of high protein concentration can explain the lower counts observed by optical techniques. It is worth noting that the charge of the particles has no impact on the Coulter counter measurements (22). Nevertheless, despite the good agreement between the Coulter counter and flow microscopy under certain conditions, there is no assurance that the particle counts reflect the true number of particles in solution.
The Effect of Solution Viscosity and Conductivity
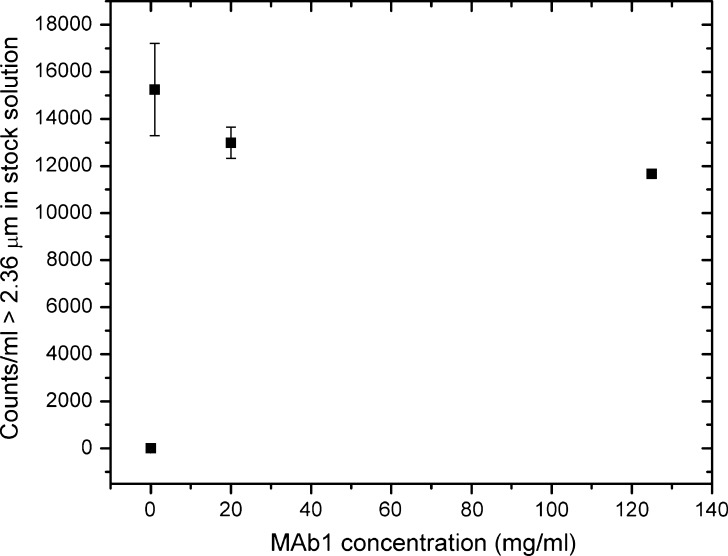
The MAb1 samples formulated in the arginine-containing buffer had a viscosity of ~12 mPa·s at 150 mg/ml and 25°C, and the 200 mM arginine hydrochloride provided ample conductivity for the Coulter counter measurements. A low-conductivity MAb1 solution (see MATERIALS AND METHODS) was used to test the limits of the instruments with regards to solution viscosity and conductivity. Neither light obscuration nor flow microscopy was able to handle the low-conductivity sample due to its high viscosity (80 mPa·s), i.e., the specified flow rates could not be maintained. The Coulter counter, however, was able to analyze the solution, despite its low conductivity and high viscosity. The low conductivity of the sample was reflected in an aperture resistance of up to 320 kΩ. The increased resistance imparted a higher noise level in the measurements, resulting in the smallest measurable size increasing from 2 to 2.36 μm on a 100-μm aperture. The higher viscosity was dealt with by increasing the vacuum in the instrument lines as well as decreasing the flow rate (see MATERIALS AND METHODS). Figure 7 shows the particle counts in the 125 mg/ml low-conductivity solution, determined at several dilution levels. Consistent with our previous observations on arginine-containing MAb1 solutions (Figs. 4, 5, and 6), the Coulter counter gave consistent measurements across the studied protein concentrations. The higher standard deviations observed at low concentrations are due to the low particle counts, as discussed above.
Fig. 7.
Particle counts of a low-conductivity, high-viscosity protein solution measured with the Coulter counter. Results are reported as average ± standard deviation. The error bars are smaller than the symbol in two instances (0 and 125 mg/ml). Counting was performed at several protein concentrations; the reported particle numbers have been corrected for the dilution factor and represent the particle content of the stock (125 mg/ml) solution. The Coulter counter gave consistent measurements across the studied protein concentrations, despite the low conductivity (15 mM histidine acetate) and high viscosity (80 mPa·s). The particle counts of the formulation buffer are included (0 mg/ml)
DISCUSSION
Interference from Silicon Oil
We have shown that silicon oil could be a major source of particle counts when protein formulations were stored in pre-filled syringes. Similar phenomena were observed in the past with silicon oil sloughing off of rubber stoppers (21,23). Differences in protein particle numbers will be difficult to assess in the presence of a large amount of counts due to silicon oil. Like air bubbles, silicon oil droplets could be distinguished from proteinaceous particles based on their spherical shape. Morphological assessments of the particles are however limited to imaging techniques (flow microscopy) and based on the assumption that protein or extraneous particles are not spherical; few orthogonal techniques are available to confirm the assignment of the counts to silicon oil. We have used a modified version of the USP Chapter 788 “Microscopic particle count test” (Fig. 3) to show that the increase in particle counts observed in pre-filled syringes (Fig. 2) was due to silicon oil. Direct comparison of particle counts obtained by the USP microscopy method and light obscuration (or flow microscopy) is however not possible even in the absence of silicon oil due to the differences in sensitivity between the methods (emphasized by the different acceptance criteria defined in the USP Chapter 788).
The presence of silicon oil droplets allowed an efficient testing of the light obscuration, flow microscopy, and Coulter counter instruments. As discussed in the RESULTS section, silicon oil droplets differ from protein particles in terms of shape and to some extent refractive index. Despite the differences between silicon oil and protein particles, testing the instruments on protein particles is not necessarily feasible because particles are typically present in very small numbers in fresh protein formulations, which translates to higher errors in counting and more difficulty in comparing samples. The high number of silicon oil droplets has not contributed to the inferior performance of the light obscuration instrument, which is limited to 18,000 particles/ml: at low or high protein concentrations, the raw particle counts are well within the limits of the instrument e.g., at 7.5 mg/ml the particle count of 22,140 (corrected for the dilution factor) was obtained from a raw count of 1,107 particles/ml (dilution factor = 20; 1,107·20 = 22,140). All light obscuration measurements (total counts >2 μm uncorrected for the dilution factor) were well below the limit of 18,000 counts/ml. Generation of an artificially high number of protein particles (e.g., by shaking) is feasible but in the authors' experience produce unstable suspensions that show counts decreasing with time and increasing or decreasing with dilution. The silicon oil droplets allowed us to characterize the effect of protein concentration on particles counts. On the one hand, characterization of protein particles could be slightly easier due to the potentially higher refractive index of protein particles; on the other hand, characterization could be more difficult due to the irregular shape and indistinct edges typical of protein particles.
The Effect of Protein Concentration
Our data suggest that protein concentrations as low as ~10 mg/ml can impair the detection and characterization of particles <10 μm by optical techniques. Discrepancies between particle-counting techniques have been documented in the past (24). Light obscuration and flow microscopy showed different sensitivities to protein concentration. Consequently, analyzing a protein formulation at tens of milligrams per milliliter or more by optical techniques without dilution will not yield accurate particle numbers <10 μm, although trends can be compared. Dilution is not necessarily a viable option since the process may create or disrupt particles or may result in very low counts, making comparisons difficult. In the case of MAb1, the Coulter counter was an appropriate method for particle analysis due to the high conductivity of the arginine-based formulation buffer. Other buffers may not be equally suited to Coulter counter measurements and dilution in saline or other conductive solutions will raise the question of potential sample alterations caused by changes in solution conditions and the sample preparation process.
Given the difficulty to obtain accurate particle counts <10 μm in protein solutions, utmost care must be exercised when comparing particle numbers from different instruments, different proteins, or even the same protein at different concentrations, or when trying to correlate particle numbers with biological parameters such as immunogenicity. Particle-counting techniques are reaching the limits of their capabilities with protein samples and the analyst must recognize that some samples, especially high-concentration protein formulations, may be extremely challenging to characterize accurately with regards to particle counts.
The Effect of Solution Viscosity and Conductivity
We have observed that a high solution viscosity could compromise measurements on current light obscuration and flow microscopy instruments. Viscosity was less of an obstacle for Coulter counter measurements, mostly because the instrument can readily be configured to handle lower flow rates. There is however a limit to the viscosity that the instrument can handle, which was not determined in our study. Surprisingly, the Coulter counter performed well for this sample even though we performed measurements at conductivities well below the manufacturer's recommendation. Such measurements must be performed in carefully controlled conditions, where the whole instrument is filled with the low-conductivity formulation buffer and the calibration is also performed in formulation buffer. The conductivity of the buffer dictates the minimal size that can be measured with the Coulter counter.
CONCLUSION
Particle-counting techniques described in the current paper are well established and have been shown to provide useful information about protein particles with many samples. Nevertheless, protein particles, especially in high-concentration protein formulations, were shown to pose specific challenges to optical-based particle-counting techniques: light obscuration and flow microscopy. The low refractive index of protein particles combined with an increased refractive index of the background due to the high protein concentration resulted in a significant underestimation of the particle numbers. While comparisons can be performed in well-defined conditions (e.g., to compare two formulations of the same protein at the same concentration), more quantitative measurements of particulate matter <10 μm in protein formulations can only be performed by optical techniques at protein concentrations below 10 mg/ml. Dilution may also introduce artifacts, especially if particle formation is concentration-dependant. The Coulter counter was shown to perform adequately over a large protein concentration range (7.5–150 mg/ml) and provided an orthogonal approach to light obscuration or flow microscopy as long as the formulation buffer was conductive enough. Due to the aforementioned limitations, accurate determination, and characterization of protein sub-visible particles remains a challenging and difficult task. New methods or procedures need to be developed to help us better understand the issue of sub-visible particles in protein pharmaceuticals.
Acknowledgments
Open Access
This article is distributed under the terms of the Creative Commons Attribution Noncommercial License which permits any noncommercial use, distribution, and reproduction in any medium, provided the original author(s) and source are credited.
REFERENCES
- 1.Carpenter JF, Randolph TW, Jiskoot W, Crommelin DJ, Middaugh CR, Winter G, et al. Overlooking subvisible particles in therapeutic protein products: gaps that may compromise product quality. J Pharm Sci. 2009;98(4):1201–5. doi: 10.1002/jps.21530. [DOI] [PMC free article] [PubMed] [Google Scholar]
- 2.Rosenberg AS. Effects of protein aggregates: an immunologic perspective. AAPS J. 2006;8(3):E501–7. doi: 10.1208/aapsj080359. [DOI] [PMC free article] [PubMed] [Google Scholar]
- 3.Braun A, Kwee L, Labow MA, Alsenz J. Protein aggregates seem to play a key role among the parameters influencing the antigenicity of interferon alpha (IFN-alpha) in normal and transgenic mice. Pharm Res. 1997;14(10):1472–8. doi: 10.1023/A:1012193326789. [DOI] [PubMed] [Google Scholar]
- 4.Schellekens H. Lesson learned from Eprex-associated pure red cell aplasia. Kidney Blood Press Res. 2007;30(Suppl 1):9–12. doi: 10.1159/000107095. [DOI] [PubMed] [Google Scholar]
- 5.Singh SK, Afonina N, Awwad M, Bechtold-Peters K, Blue JT, Chou D, et al. An industry perspective on the monitoring of subvisible particles as a quality attribute for protein therapeutics. J Pharm Sci. 2010;99(8):3302–21. doi: 10.1002/jps.22097. [DOI] [PubMed] [Google Scholar]
- 6.Narhi LO, Jiang Y, Cao S, Benedek K, Shnek D. A critical review of analytical methods for subvisible and visible particles. Curr Pharm Biotechnol. 2009;10(4):373–81. doi: 10.2174/138920109788488905. [DOI] [PubMed] [Google Scholar]
- 7.Mahler HC, Friess W, Grauschopf U, Kiese S. Protein aggregation: pathways, induction factors and analysis. J Pharm Sci. 2009;98(9):2909–34. doi: 10.1002/jps.21566. [DOI] [PubMed] [Google Scholar]
- 8.Kiese S, Pappenberger A, Friess W, Mahler HC. Equilibrium studies of protein aggregates and homogeneous nucleation in protein formulation. J Pharm Sci. 2010;99(2):632–44. doi: 10.1002/jps.21858. [DOI] [PubMed] [Google Scholar]
- 9.Tyagi AK, Randolph TW, Dong A, Maloney KM, Hitscherich C, Jr, Carpenter JF. IgG particle formation during filling pump operation: a case study of heterogeneous nucleation on stainless steel nanoparticles. J Pharm Sci. 2009;98(1):94–104. doi: 10.1002/jps.21419. [DOI] [PubMed] [Google Scholar]
- 10.Sharma DK, Oma P, Pollo MJ, Sukumar M. Quantification and characterization of subvisible proteinaceous particles in opalescent mAb formulations using micro-flow imaging. J Pharm Sci. 2010;99(6):2628–42. doi: 10.1002/jps.22046. [DOI] [PubMed] [Google Scholar]
- 11.Wuchner K, Buchler J, Spycher R, Dalmonte P, Volkin DB. Development of a microflow digital imaging assay to characterize protein particulates during storage of a high concentration IgG1 monoclonal antibody formulation. J Pharm Sci. 2010;99(8):3343–61. doi: 10.1002/jps.22123. [DOI] [PubMed] [Google Scholar]
- 12.Sharma DK, King D, Oma P, Merchant C. Micro-flow imaging: flow microscopy applied to sub-visible particulate analysis in protein formulations. AAPS J. 2010;12(3):455–64. doi: 10.1208/s12248-010-9205-1. [DOI] [PMC free article] [PubMed] [Google Scholar]
- 13.Filipe V, Hawe A, Jiskoot W. Critical evaluation of Nanoparticle Tracking Analysis (NTA) by NanoSight for the measurement of nanoparticles and protein aggregates. Pharm Res. 2010;27(5):796–810. doi: 10.1007/s11095-010-0073-2. [DOI] [PMC free article] [PubMed] [Google Scholar]
- 14.Shire SJ, Shahrokh Z, Liu J. Challenges in the development of high protein concentration formulations. J Pharm Sci. 2004;93(6):1390–402. doi: 10.1002/jps.20079. [DOI] [PubMed] [Google Scholar]
- 15.Harris RJ, Shire SJ, Winter C. Commercial manufacturing scale formulation and analytical characterization of therapeutic recombinant antibodies. Drug Dev Res. 2004;61(3):137–54. doi: 10.1002/ddr.10344. [DOI] [Google Scholar]
- 16.Cao S, Jiang Y, Narhi L. A light-obscuration method specific for quantifying subvisible particles in protein therapeutics. Pharmacop Forum. 2010;36(3):824–34. [Google Scholar]
- 17.Cao S, Jiao N, Jiang Y, Mire-Sluis A, Narhi LO. Sub-visible particle quantitation in protein therapeutics. Pharmeur Bio Sci Notes. 2009;2009(1):73–9. [PubMed] [Google Scholar]
- 18.Kanai S, Liu J, Patapoff TW, Shire SJ. Reversible self-association of a concentrated monoclonal antibody solution mediated by Fab-Fab interaction that impacts solution viscosity. J Pharm Sci. 2008;97(10):4219–27. doi: 10.1002/jps.21322. [DOI] [PubMed] [Google Scholar]
- 19.Huang CT, Sharma D, Oma P, Krishnamurthy R. Quantitation of protein particles in parenteral solutions using micro-flow imaging. J Pharm Sci. 2009;98(9):3058–71. doi: 10.1002/jps.21575. [DOI] [PubMed] [Google Scholar]
- 20.Mahler HC, Senner F, Maeder K, Mueller R. Surface activity of a monoclonal antibody. J Pharm Sci. 2009;98(12):4525–33. doi: 10.1002/jps.21776. [DOI] [PubMed] [Google Scholar]
- 21.Pavanetto F, Conti B, Genta I, Modena T. Particulate contamination from siliconized rubber stoppers. Int J Pharm. 1991;74:175–81. doi: 10.1016/0378-5173(91)90234-F. [DOI] [Google Scholar]
- 22.Henriquez RR, Ito T, Sun L, Crooks RM. The resurgence of Coulter counting for analyzing nanoscale objects. Analyst. 2004;129(6):478–82. doi: 10.1039/b404251b. [DOI] [PubMed] [Google Scholar]
- 23.Sendo T, Otsubo K, Hisazumi A, Aoyama T, Oishi R. Particle contamination in contrast media induced by disposable syringes. J Pharm Sci. 1995;84(12):1490–1. doi: 10.1002/jps.2600841218. [DOI] [PubMed] [Google Scholar]
- 24.Groves MJ, Wana D. A comparison of instrumental techniques for the determination of contamination in filtered aqueous solutions. Powder Technol. 1977;18:215–23. doi: 10.1016/0032-5910(77)80011-9. [DOI] [Google Scholar]


