Abstract
The purpose of this research was to evaluate a new wireless and battery-free sensor technology for invasive product temperature measurement during freeze-drying. Product temperature is the most critical process parameter in a freeze-drying process, in particular during primary drying. The product temperature over time profile and a precise detection of the endpoint of ice sublimation is crucial for comparison of freeze-drying cycles. Traditionally, thermocouples are used in laboratory scale units whereas resistance thermal detectors are applied in production scale freeze-dryers to evaluate temperature profiles. However, both techniques show demerits with regard to temperature comparability and biased measurements relative to vials without sensors. A new generation of wireless temperature sensors (Temperature Remote Interrogation System, TEMPRIS) were used in this study to investigate for the first time their value when applied to freeze-drying processes. Measurement accuracy, capability of accurate endpoint detection and effect of positioning were delineated by using product runs with sucrose, mannitol and trehalose. Data were compared to measurements with 36-gauge thermocouples as well as to non-invasive temperature measurement from Manometric Temperature Measurements. The results show that the TEMPRIS temperature profiles were in excellent agreement to thermocouple data when sensors were placed center bottom in a vial. In addition, TEMPRIS sensors revealed more reliable temperature profiles and endpoint indications relative to thermocouple data when vials in edge position were monitored. The results of this study suggest that TEMPRIS may become a valuable tool for cycle development, scale-up and routine manufacturing in the future.
Key words: freeze-drying, process optimization, scale-up, temperature measurement
INTRODUCTION
Freeze-drying is a commonly used and well established process to preserve the original structure of a heat sensitive biological and/or pharmaceutical product (e.g. proteins, peptides, vaccines, etc.) during drying and, moreover, during long-term storage (1,2). The concept of freeze-drying involves the removal of ice from a frozen product by sublimation at low temperatures and pressures. It was recently reported by the Food and Drug Administration (FDA) that about 46% of the approved biological drugs are manufactured by freeze-drying (3).
A typical freeze-drying cycle consists of three steps. First, the solution containing an active pharmaceutical ingredient (API) is completely solidified during the freezing step. During freezing, water crystallizes as ice and (dependent on the excipients or freezing conditions used) the solute either crystallizes or remains amorphous. In the following step, denoted as primary drying, the pressure in the drying chamber is reduced and the shelf temperature is elevated to allow sustaining ice sublimation. After the initial ramping phase to the desired shelf setpoint, the heat supplied by the shelves and the removal of heat by sublimation is balanced and the system is in steady state. Depending on shelf temperature, pressure and resulting sublimation rate, the product will adopt a certain product temperature which is, in turn, a critical parameter for successful freeze-drying (4). If the product temperature at the ice sublimation interface (Tp) exceeds a specific “critical temperature” of the formulation, the product will undergo shrinkage, collapse or eutectic melt (5). The critical temperature of a solution intended for lyophilization is known as the collapse (Tc) or glass transition temperature ( ) for amorphous and the eutectic temperature (Teut) for crystalline materials. The negative impact of shrinkage or collapse on the quality of the cake structure has been reported multifariously in the literature: elevated residual moisture levels of the final product, extended reconstitution times of the sponge-like cake, loss of activity of the API, etc. (5–7). However, the most important factor is that a collapsed product is often rejected due to the unattractive physical appearance. As mentioned above, collapse takes place during primary drying at the sublimation interface and in the part of the cake from which the ice has already been removed. The frozen areas where the thin filament product morphology is still stabilized by the presence of ice crystals do not show collapse. Note that for a high fill volume in a vial or for solutes with high product resistance, a temperature gradient between the product interface temperature and the vial bottom temperature (Tb) has been reported during primary drying (8). Due to increasing product resistance toward the end of primary drying, the product temperature may increase, which makes the bottom part of the cake especially likely to show shrinkage or collapse. In the final step denoted as secondary drying, water dispersed within the product matrix is removed by diffusion and desorption. Since water removal is governed by kinetics and not thermodynamics, the shelf temperature must be raised to +40 or +50°C if low residual moisture levels (i.e. <1%) are desired in the final product. This, in turn, is mandatory for many proteins, peptides or small molecules to guarantee long term stability. For amorphous materials, the shelf temperature ramp rate to the secondary drying set point must be moderate in order to avoid shrinkage caused by increased molecular mobility at temperatures exceeding the glass transition temperature of the cake structure.
Product temperature monitoring during a freeze-drying cycle is traditionally performed using either thin wire thermocouples or resistance thermal detectors (RTD, PT-100). While thermocouples are more frequently used in laboratory scale freeze-drying, RTD’s are preferred in manufacturing due to their mechanical robustness and effective sterilization (9). It is well known that invasive product temperature measurements in a single vial are generally not representative for the entire batch due to variations in the nucleation and freezing behavior of the solution containing the probe (1,4,9). These vials tend to show a lower degree of supercooling than the surrounding vials and therefore form fewer and larger ice crystals which finally results in lower product resistance and shorter drying time relative to the rest of the batch. While this difference may be inconsequential in the laboratory, the sterile and particle-free environment in manufacturing leads to substantially higher supercooling of the solution, resulting in larger differences between vials with and vials without temperature sensors.
Manometric temperature measurement (MTM) was recently introduced as a new PAT technology which is capable of a non-invasive prediction of the batch interface temperature (Tp). However, at this point MTM technology is only available on laboratory scale units and not for pilot or production scale freeze-dryers (8,10). To successfully transfer a cycle recipe developed in the laboratory to pilot or production scale, an identical product temperature over time profile for a given product must be established to avoid product collapse or excessive primary drying times. It is a common procedure to record product temperatures using thermocouples in the laboratory scale which are subsequently compared to temperature data measured with RTD’s in manufacturing. Problems associated with such a comparison are manifold. First, PT-100 probes are usually much larger than thermocouples and the measurement accuracy is distorted by the sensor geometry at lower fill depth (11). Note that the part of the sensor that is exposed to the headspace of a vial receives additional heat by radiation. In addition, the sensor size of RTD probes may cause elevated heat transfer to the product. Next, the positioning of vials equipped with temperature probes is biased in the sterile production environment, i.e. the sensor vials are commonly placed in the first row facing the chamber door to avoid product contamination. These factors may lead to an erroneous assumption of temperature profiles over time when using PT-100 probes. In addition, the use of thermocouples and RTD’s for on-line monitoring of freeze-drying cycles is limited if data loggers are used that provide temperature data only after completion of the run. The greatest drawback for product temperature measurements in manufacturing scale freeze-drying is the fact that conventional RTDs (or even thermocouples) are not compatible with automatic loading systems which have increasingly become standard in production. Some wireless solutions (“active transponders”) have been available for about two decades, using the ISM-frequency-bands for short-range data-transmission from the sensor-units. However, these active transponders show similar demerits as RTD’s. In addition, all of them require batteries for sensor-operation and data-transmission, resulting in limited operating time dependent on battery capacity and finally unpredictable risks when using batteries in a sterile environment.
Recently, a new generation of wireless probes was developed (a “passive transponder”) which generate the energy required for transmission from an electromagnetic field instead of using batteries (12). This study evaluates for the first time the value of the new Temperature Remote Interrogation System (TEMPRIS) sensors for cycle development in the laboratory in a direct comparison to thermocouple and MTM data. Furthermore, this paper discusses the potential use of the new sensors when scaling from laboratory to pilot or production and their implementation to support the PAT initiative of the FDA.
MATERIALS AND METHODS
Mannitol, sucrose and trehalose of analytical grade were purchased from Sigma (Sigma Chemical Company, Germany) and used as received. Water was double distilled from an all-glass apparatus.
TEMPRIS: Operation Principle
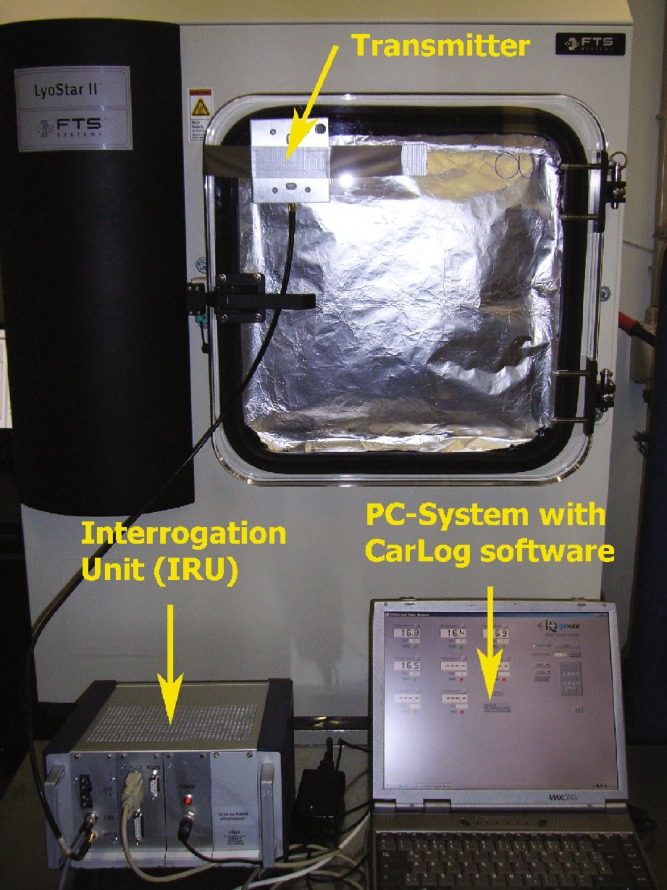
The TEMPRIS wireless temperature system (IQ Mobil Solutions GmbH, Wolfratshausen, Germany) used in this study consisted of 8 sensors, the interrogation unit (IRU) (including transmitter) and a computer system with CarLog software (IQ Mobil Solutions GmbH, Wolfratshausen, Germany) installed to record the data to file (Fig. 1). The battery-free sensors receive their power by excitation of the passive transponder by means of an amplitude-modulated electromagnetic signal in the internationally available 2.4-GHz ISM band, with evaluation of the back-scatter response. The signal is demodulated in the transponder by means of a diode detector and used to stimulate a quartz-based resonance circuit (12). This way the resonator itself is used as an energy storage device. The maximum possible storage time is defined by the quality factor Q of the resonator. In the second step the amplitude modulation is deactivated and the isolated carrier signal is radiated. The stimulated resonant circuit continues to oscillate at its characteristic frequency which depends on its temperature. This free oscillation is mixed with the carrier and re-transmitted to the IRU. The IRU measures the modulation frequency of the response and the exponential drop in amplitude. In combination with statistical parameters of several consecutive responses the key variable is derived. In order to avoid potential interferences, the system changes automatically to a new carrier frequency within the ISM band after each interrogation cycle. As a result, the duration of the usable oscillations depends directly on the resonant frequency and the quality factor of the resonant circuit used (Eq. 1):
 |
1 |
The resonator used has a very high Q value (typically 30.000 to 50.000 at 2–10 MHz), resulting in a slow attenuation of the amplitude of free oscillations without a load. In practice the external circuit provides additional attenuation, so that the usable oscillation shows durations of 1 to 2 ms.
Fig. 1.
Illustration of the TEMPRIS wireless sensor experimental setup: interrogation unit (IRU) with PC system and transmitter attached to the freeze-dryer front door. The TEMPRIS sensor is shown in Fig. 2
Freeze-drying Procedure
Freeze-drying was performed on a laboratory scale freeze-dryer (Lyostar II, FTS Systems, Stone Ridge, NY) equipped with MTM technology and the latest revision of SMART™ Freeze Dryer software. Empty vials (dummy vials) were used in the outer row of the hexagonal packing array to reduce radiative heat transfer from the chamber walls to the product. In addition, aluminum foil was used to reduce heat transfer from the chamber door. Freeze-drying runs were performed using the SMART Freeze Dryer software of the Lyostar II unit (automatic cycle design in primary drying based on product temperature feedback from MTMs) or a predefined cycle recipe (8).
Five freeze drying runs were performed to evaluate measurement accuracy, effects of sensor placement, impact of edge vial effects, comparison of endpoint detection of various methods and differences in freezing behavior (cf. Table I, II, III, IV, V for details). During four of the experiments a pre-defined cycle recipe was used. Two of the runs were performed using 25 mg/mL sucrose solutions in 20 mL vials (Ap: 6.33 cm2) with a total load of 91 vials and a fill volume of 5.8 mL. 50 mg/mL sucrose solution was lyophilized after filling 1.6 mL into 5 mL vials (Ap: 3.46 cm2) with a total load of 203 product vials. A 10% trehalose solution (49 vials, 20 mL, Ap: 6.33 cm2) with 1 cm fill depth was processed to evaluate the effect of high total solid content on TEMPRIS temperature data accuracy relative to MTM measurements where potential limitations in accuracy for the MTM technology have been reported previously (8,10). For the 50 mg/mL mannitol/sucrose solution (10:1), 3 mL was filled into 10 mL vials (Ap: 5.90 cm2) with a total load of 192 product vials, and processed using the SMART technology that generates an optimized freeze-drying recipe in the first laboratory experiment. MTM measurements were performed at 60 min intervals unless otherwise stated.
Table I.
Freeze-drying Recipe #1 Used for 25 mg/mL Sucrose Solution
| 1 | 2 | 3 | |
|---|---|---|---|
| Freezing step | |||
| Shelf setpoint [°C] | +5 | −5 | −40 |
| Ramp rate [°C/min] | 1 | 1 | 1 |
| Time [min] | 30 | 30 | 120 |
| Primary/Secondary drying | |||
| Shelf setpoint [°C] | −30 | +40 | |
| Ramp rate [°C/min] | 1 | 0.2 | |
| Time [min] | 5500 | 240 | |
| Vacuum setpoint [mTorr] | 100 | 100 | |
Table II.
Freeze-drying Recipe #2 Used for 25 mg/mL Sucrose Solution
| 1 | 2 | 3 | |
|---|---|---|---|
| Freezing step | |||
| Shelf setpoint [°C] | +5 | −5 | −40 |
| Ramp rate [°C/min] | 1 | 1 | 1 |
| Time [min] | 30 | 30 | 120 |
| Primary/Secondary drying | |||
| Shelf setpoint [°C] | −15 | +40 | |
| Ramp rate [°C/min] | 1 | 0.1 | |
| Time [min] | 2300 | 240 | |
| Vacuum setpoint [mTorr] | 100 | 100 | |
Table III.
Freeze-drying Recipe Used for 50 mg/mL Sucrose Solution
| 1 | 2 | 3 | |
|---|---|---|---|
| Freezing step | |||
| Shelf setpoint [°C] | +5 | −5 | −40 |
| Ramp rate [°C/min] | 1 | 1 | 1 |
| Time [min] | 30 | 30 | 120 |
| Primary/Secondary drying | |||
| Shelf setpoint [°C] | −25 | +40 | |
| Ramp rate [°C/min] | 0.5 | 0.3 | |
| Time [min] | 1780 | 460 | |
| Vacuum setpoint [mTorr] | 100 | 100 | |
Table IV.
Freeze-drying Recipe Used for 100 mg/mL Trehalose Solution
| 1 | 2 | 3 | |
|---|---|---|---|
| Freezing step | |||
| Shelf setpoint [°C] | +5 | −5 | −40 |
| Ramp rate [°C/min] | 1 | 1 | 1 |
| Time [min] | 30 | 30 | 90 |
| Primary/Secondary drying | |||
| Shelf setpoint [°C] | 0 | +40 | |
| Ramp rate [°C/min] | 1 | 0.1 | |
| Time [min] | 4000 | 240 | |
| Vacuum setpoint [mTorr] | 100 | 100 | |
Table V.
Freeze-drying Recipe Used for the 50 mg/mL Mannitol/Sucrose Mixture
| 1 | 2 | 3 | 4 | 5 | |
|---|---|---|---|---|---|
| Freezing step | |||||
| Shelf setpoint [°C] | +5 | −5 | −40 | −15 | −40 |
| Ramp rate [°C/min] | 1 | 1 | 1 | 1 | 1 |
| Time [min] | 30 | 30 | 0 | 180 | 120 |
| Primary/Secondary drying | |||||
| Shelf setpoint [°C] | −28 | −3 | +1 | −5 | +40 |
| Ramp rate [°C/min] | 0.5 | 0.5 | 0.5 | 0.5 | 0.3 |
| Time [min] | 57 | 57 | 234 | 354 | 240 |
| Vacuum setpoint [mTorr] | 85 | 85 | 85 | 85 | 85 |
Note that the primary drying phase of the recipe was automatically generated by the SMART Freeze Dryer software (16).
Positioning of Thermocouples and TEMPRIS Sensors in a Vial
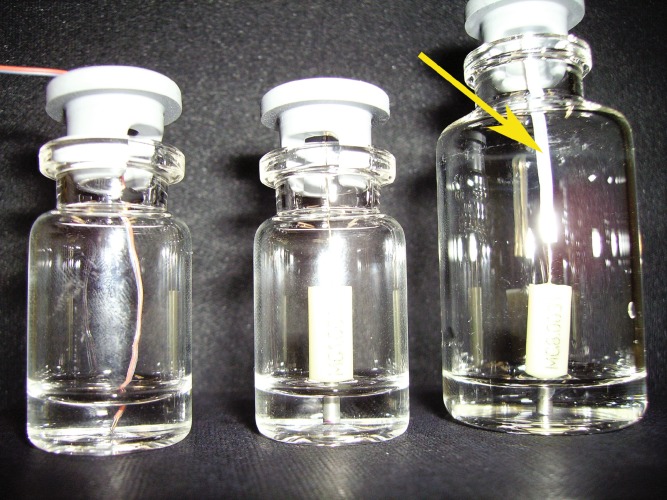
Thin wire thermocouples (36 gauge, Omega, Newport, CT, USA) were calibrated at 0°C by using an ice water bath and then placed carefully in the center of a vial, touching the vial bottom (cf. Fig. 2, left). The TEMPRIS probes were placed in vials adjacent to the vials containing a thermocouple to ensure adequate comparison of the temperature profiles over time. It is important to note that the TEMPRIS sensors were always placed in the same way in all vials to assure “center bottom” position (cf. Fig. 2, right). To avoid changes in position of TEMPRIS probes during the loading procedure (in particular when using 20 mL vials), a thin teflon tube was inserted into the stopper and the TEMPRIS sensor antenna placed into this tube. By carefully arranging the stopper into the vial neck, the probe could always be stabilized in the center bottom position. Both thermocouple and TEMPRIS vials were placed in center and edge positions on the shelf to investigate the temperature bias caused by radiative effects. The accuracy of the calibrated 36 gauge thermocouples and calibrated TEMPRIS probes was obtained from the manufacturer as follows: thermocouples (Omega Engineering, Stamford, CT, USA): ±1 K, TEMPRIS (IQ Mobil, Wolfratshausen, Germany): ±1 K (±0.5 K within −40 to −20 °C).
Fig. 2.
Correct placement (bottom center) of a thermocouple (left) and two TEMPRIS sensors (5 mL and 20 mL vial, right). The TEMPRIS sensor can easily be fixed in this position by a small teflon tube in the stopper
RESULTS AND DISCUSSION
TEMPRIS Sensor Positioning and Impact on Measured Temperature Profile
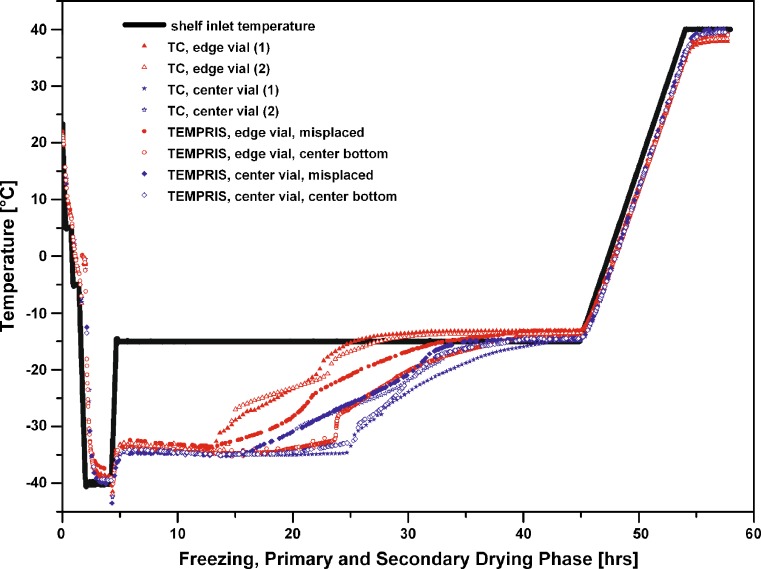
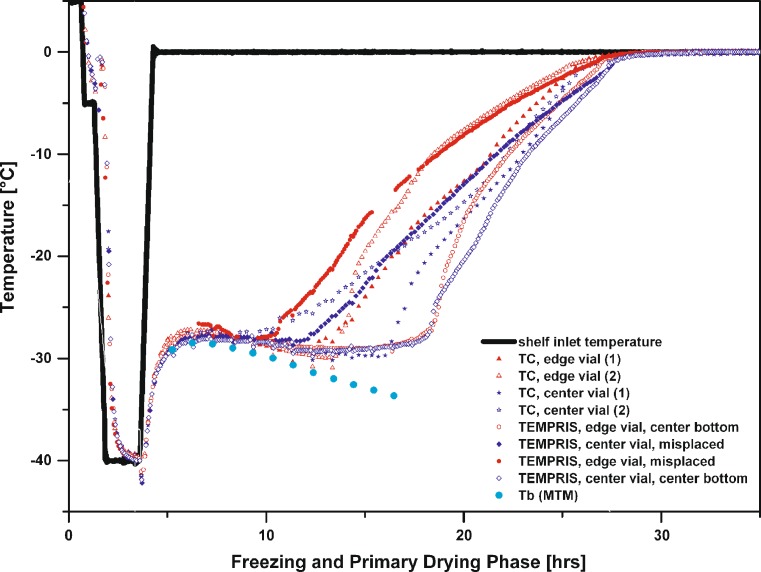
It has been reported that for the majority of vials in a batch, ice sublimation proceeds from the top to the bottom and to a lesser extend, from the side to the center of the product (13). Therefore, it would be expected that the last spot within the freeze-dried cake where a remainder of ice can be found is the center bottom of the vial. It is common practice to place thermocouples (not RTDs) with the tip touching the vial center bottom with a little bit of tension in the thermocouple wire to avoid a misplacement during the loading procedure. However, the wireless sensors do not easily allow such placement in a vial, and the user may be tempted to just drop the probe into the vial solution. As a result, the thermo-sensitive tip will always be located in the corner of a vial due to the low center of gravity of the sensor. This position however might not guarantee a representative monitoring of the temperature profile over time and endpoint detection during primary drying (1). To delineate the significance of probe positioning, a run with 25 mg/mL sucrose at a constant shelf temperature in primary drying (Ts: −15°C) was performed. Here, two TEMPRIS sensors were placed in center bottom position (cf. Fig. 2) and two sensors with the tip in the corner of the vial (denoted further in the text and the figures as “misplaced”). Figure 3 reveals that the temperature over time profile in the early stage of primary drying for the misplaced sensors showed good agreement with the temperature data of sensors located at the bottom center of the vial. However, the misplaced TEMPRIS probes clearly lost contact with the remaining ice earlier than the probes positioned “center bottom”. This observation was confirmed for both center and edge vial positions. The loss of contact with the ice was observable in a slow temperature increase over a period of several hours until the shelf surface temperature was reached. The significance of this observation is that the temperature reading at this point of the process indicates that the product vial is almost free of ice. Indeed, the corner position even receives heat from the surrounding vials which might already be “dry”. However, isolated ice slabs may still be present in the center of the vial and their heat of sublimation still contributes to the effective product temperature over time profile. In turn, it is important to note that (in case of using thermocouples) the commonly accepted definition of reporting the “endpoint” of primary drying is when the temperature reading of the sensor is essentially equivalent to the shelf temperature or (in case of elevated radiative heat transfer to the product) when the temperature reading is higher than the shelf temperature and constant over time. The TEMPRIS probe placed bottom center in the vial and positioned in the center of the batch showed the longest and most consistent steady state product temperature reading at about −35 °C, followed by a sharp step increase to the shelf temperature setpoint. The course of the TEMPRIS temperature reading is in excellent agreement with the adjacent center thermocouple where the thermocouple tip was positioned bottom center as well. However, note from Fig. 3 that the misplaced sensors indicated the end point at almost the same time as the center bottom placed sensors. The overall benefit of center bottom positioning of probes is therefore to obtain a reliable and representative temperature image over time for the longest possible period of time in primary drying and an indication of the primary drying endpoint with a sharper temperature transition from steady state ice sublimation to essentially equilibration of the product temperature to shelf temperature. A correct placement of TEMPRIS provides an opportunity to gain valuable insight into the final phase of primary drying and may therefore allow a more representative transfer of information when scaling to pilot or production.
Fig. 3.
Effect of positioning in the vial: Temperature over time profile of 25 mg/mL sucrose solution
Applicability of TEMPRIS Probes to Evaluate “Edge Vial” Effects
Atypical drying behavior of vials located at the side of a batch or close to the front door (the so called “edge vial” effect) was already reviewed in the literature (e.g. 14) and was depicted as a critical issue when scaling cycle recipes from the laboratory to production (15). Traditionally, the temperature bias between center and edge vials is approximated in the laboratory using thermocouples. However, once the recipe has been transferred to a pilot or production scale freeze-dryer, mandatory information about the extent of edge vial effects is often not available since thermocouples are simply not available or interfere with automatic loading systems. In a few cases, data are available from PT-100 sensors, but this information does often not allow a temperature profile comparison. For example, it was reported that the PT-100 temperature over time profile for a given product and cycle recipe indicated a much higher average temperature profile relative to thermocouple data, based on (1) the PT-100 probe size and therefore elevated contribution of heat from the sensor to the product as well as the probe’s characteristic to measure the temperature as a profile over the entire product and (2) PT-100 misplacement (9). Therefore, the possibility to employ sensors in the development phase in the laboratory and to subsequently use the same sensors in production would be of great value and interest to get more reliable and comparable process information and facilitate scale-up.
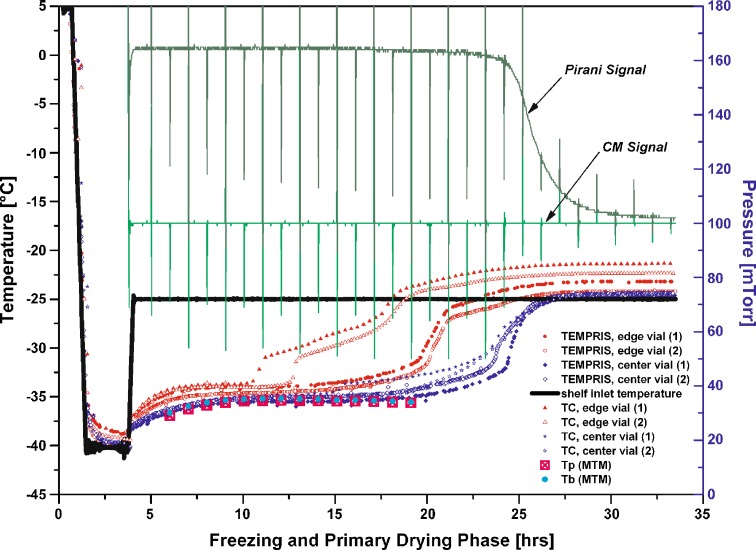
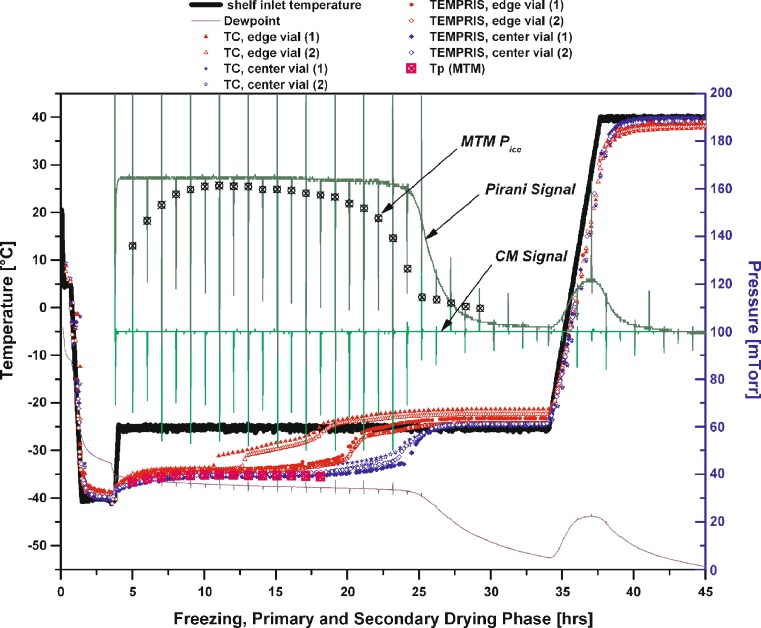
To evaluate the effect of atypical radiation in edge vial positions, a 50 mg/mL sucrose run was performed (Ts: −25 °C, Pc: 100 mTorr in primary drying) where two TEMPRIS probes were located in edge positions and two probes in center positions. The same number of thermocouples was then placed adjacent to the vials containing the TEMPRIS probes. All sensors were carefully positioned center bottom. Figure 4 illustrates the temperature profiles over time for all sensors during primary drying and the corresponding MTM product temperature data obtained in the Auto-MTM mode of the SMART Freeze Dryer software. For center vials, TEMPRIS and thermocouple data revealed very good agreement of the measured temperature profile over time and were both in excellent agreement to MTM Tb data (filled circles, Fig. 4). Again, the TEMPRIS temperature data were found to increase later and less abrupt relative to the 36 gauge thermocouples which showed a sudden step increase in temperature due to a loss of contact with the ice. This difference becomes even more pronounced when comparing only edge vial data. While the thermocouple temperature profiles indicate a very sharp step change in temperature (about 3 °C in less than 30 min) and depict a temperature increase after 10.5 and 12.5 h for the respective vials, the temperature profile provided by the TEMPRIS probes was found to be much more balanced. The temperature reading of the wireless probes increased steadily after 14 h for vials in edge position. Figure 4 also illustrates that the TEMPRIS probes indicated a slightly lower product temperature (closer to the shelf temperature) at the end of primary drying. Considering the much greater temperature-sensitive area at the tip of a TEMPRIS probe, one would expect elevated sensitivity to radiative heat transfer relative to thermocouples. However, based on the delayed temperature increase and the lower temperature response of the TEMPRIS sensor at the end of primary drying, it is possible that the thermocouple itself contributes small amounts of heat to the product. In contrast, the TEMPRIS sensors receive their energy from excitation of the passive transponder without the presence of an electric current. Considering the temperature profiles data in Fig. 4, the TEMPRIS probes describe a more representative temperature bias between center and edge vials (edge vials free from ice after about 24 h, center vials after about 28 h) compared to the more arbitrary thermocouple data (edge vials free from ice including a step change in temperature: after less than 20 h, TC center vials in good agreement with TEMPRIS probes: free of ice after about 28 h).
Fig. 4.
Temperature over time profile monitored for a 50 mg/mL sucrose solution by TEMPRIS sensors, 36 gauge thin wire thermocouples and MTM
TEMPRIS vs. Thermocouple: Temperature Over Time Profile and Endpoint Detection
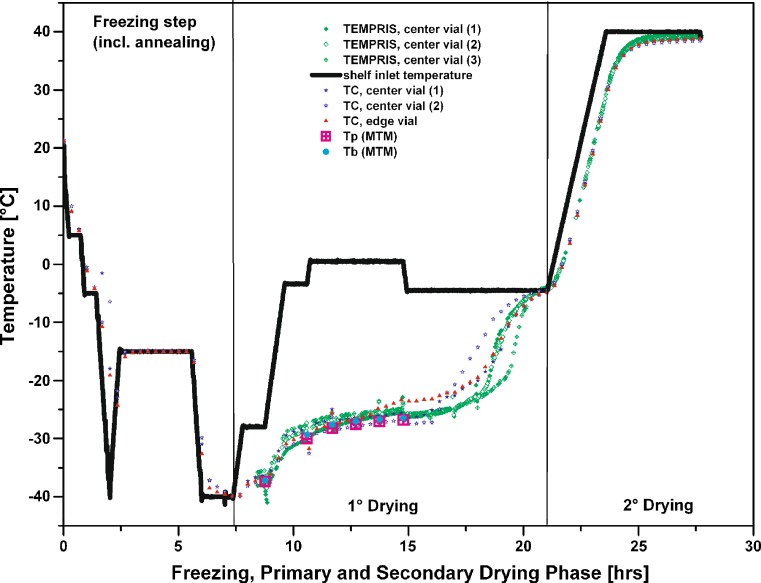
Figure 5 illustrates the temperature over time profiles during 1° and 2° drying for a 50 mg/mL mannitol/sucrose solution, monitored by three different TEMPRIS probes and three 36 gauge thermocouples. In addition, temperature data obtained from (non-invasive) MTM measurements were recorded. Each sensor used was positioned “center bottom” in a vial. During this run, the cycle recipe during primary drying was automatically adjusted by the SMART Freeze Dryer software, based on an user predefined collapse temperature of −25 °C (16). The SMART settings resulted in a stepwise increase in shelf temperature from −28 to +1 °C and a subsequent decrease to −5 °C after about 15 h for this particular formulation. The product temperature was constantly maintained just below the target temperature of −28 °C. The endpoint of primary drying was determined based on MTM measurements, i.e. two consecutive pressure rise measurements must result in a calculated pressure of ice (Pice) within a 10 mTorr interval of the chamber pressure (Pc) (8). This method has already proven great reliability in endpoint detection and was found consistent with the Pirani/Capacitance Manometer differential pressure control (8,9). All TEMPRIS probes showed very good agreement in the temperature over time profile with the data obtained from the thermocouples. Indeed, the TEMPRIS sensors even indicated a faster response to the stepwise temperature increase and decrease relative to the thermocouple data (cf. Fig. 5, cycle time: 7.5 to 12.5 h). It is interesting to note that all TEMPRIS sensors clearly indicated a delayed increase in temperature at the end of primary drying relative to thermocouple data (cycle time: 16 to 18 h). However, all thermocouples and TEMPRIS probes identified the endpoint of primary drying at identical time marks (i.e. after about 21 h). The temperature bias between the individual center thermocouples was found greater (about 2 °C) than for the TEMPRIS probes, but was still within the uncertainty of the measurement.
Fig. 5.
Temperature over time profile monitored by TEMPRIS sensors, 36 gauge thin wire thermocouples and MTM for a 50 mg/mL mannitol/sucrose solution (10:1)
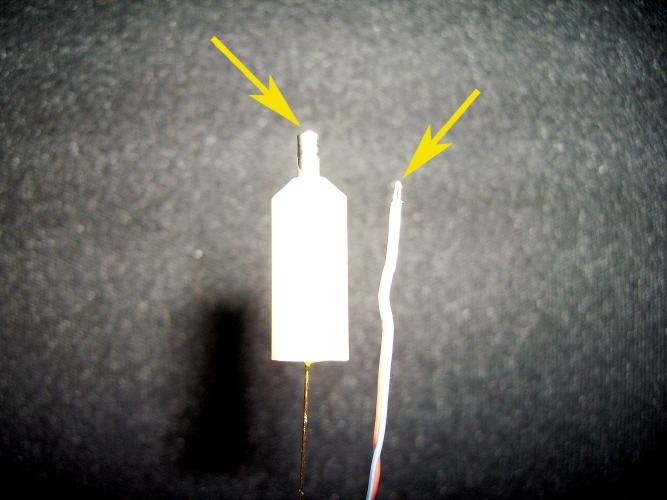
An important aspect that needs to be considered when comparing thermocouples to TEMPRIS probes is the design of the sensor tip. The effective heat flow to the TEMPRIS quartz resonant circuit may pass through a conductive area of about 6 mm2 to stimulate the resonant circuit. As a rough estimate this is about a factor of 100 larger than the total area of the tip of a 36 gauge thermocouple (cf. Fig. 6). Even when ice located adjacent to the TEMPRIS sensor has been removed and very little ice is still present in the vicinity of the probe, TEMPRIS sensors may have sufficient sensitivity to measure the residual cooling derived from sublimation of ice. This, in turn, might be favorable when processing products which are known to form isolated ice slabs within a freeze-dried structure, imposing the risk of premature ramping into secondary drying (8).
Fig. 6.
TEMPRIS probe (left) and 36 gauge thermocouple (right). The picture illustrates the difference in the area of the sensor tip that is exposed to the surrounding temperature (total area, TEMPRIS probe: about 6 mm2)
Figure 7 delineates a representative example for different endpoint monitoring procedures (TEMPRIS, thermocouples, MTM, dew point, Pirani/capacitive differential pressure control), based on a freeze-drying experiment with 50 mg/mL sucrose. The endpoint detection provided by TEMPRIS sensors and thermocouples in center position showed excellent agreement with the MTM endpoint control which calculates the vapor pressure of ice at the sublimation interface (Pice). Comparison of temperature data to Pirani/capacitive differential pressure measurement showed a slightly better agreement of primary drying endpoints indicated by TEMPRIS sensors with the differential pressure method than was the case for thermocouples. Good agreement was observed if comparing endpoint indications by dew point sensor measurement. In all cases, sensors located in edge vials indicated the end of primary drying substantially earlier than sensors in center vials.
Fig. 7.
50 mg/mL sucrose solution: comparison of different “established” primary drying endpoint monitoring techniques with data from the new TEMPRIS wireless probes
Both invasive temperature determination procedures (wireless temperature sensors and thermocouples) showed good agreement to the non-invasive MTM product temperature measurements. The temperature calculation by MTM for the bottom of the vials in the batch revealed a temperature slightly lower (less than 1 °C) than the data measured by the TEMPRIS sensors. Note that the fill depth in the vial during this experiment was rather small (Lice: 0.6 cm) and the product showed intermediate resistance. As a result, a significant difference in temperature between the vial bottom and the sublimation interface would not be expected. The good agreement between MTM and TEMPRIS probes might be important information when considering the application of the wireless temperature probes in manufacturing. Here, MTM is currently not available to monitor the temperature over time profile for a given product. However, when assuming a negligible temperature gradient between product interface and bottom temperature (which can be evaluated in the lab), the use of TEMPRIS probes may compensate this lack of information and cut time during the scale-up procedure.
TEMPRIS vs. MTM: Impact of High Solute Concentrations on Measurement Accuracy
As mentioned above, TEMPRIS and MTM data showed excellent agreement at intermediate product concentration and fill volume in a given vial. However, some product formulations (e.g. monoclonal antibodies (17)) require total solid contents much higher than 100 mg/mL to achieve stabilization of the active component. It has been reported recently that MTM is not a reliable process monitoring tool when processing high concentrated amorphous product solutions. Here, the MTM temperature prediction becomes poor even in the very early phase of primary drying. This effect was attributed to moisture re-adsorption of the product matrix when the chamber is isolated from the condenser during a 25 s measurement interval (8,10). For such cases, TEMPRIS probes could be used to compensate the lack of accuracy of the MTM procedure, assuming that the measurement accuracy of the TEMPRIS sensor itself is not affected by the total solid content. To study the impact of high total solid content solutions on the temperature over time data obtained from TEMPRIS and MTM, a freeze drying run with 100 mg/mL trehalose solution and 1 cm fill depth was performed (Fig. 8). Temperature measurements of thermocouples and TEMPRIS sensors were in good agreement, the effect of sensor placement in the vial was in agreement with previous observations. During the steady state of primary drying (5–10 h of drying time, cf. Fig. 8), the temperature difference between thermocouples as well as misplaced and correctly placed TEMPRIS sensors was negligible. As expected, the misplaced wireless probes lost contact with the ice early, followed by an interval of linear temperature increase not indicative for the process. Note that in this experiment the product temperature during primary drying was controlled between −27 and −28 °C, thereby slightly exceeding the collapse temperature of trehalose (−29 °C (5)). As expected, the MTM product temperature prediction was only representative for the initial 3–4 measurements (within a 1 °C interval to thermocouple data, comparison according to (8)) due to high drying heterogeneity within the batch and the relatively high total solid content of amorphous trehalose. Subsequent MTM measurements deviated significantly from thermocouple and TEMPRIS data and showed a decrease in temperature caused by the reduced number of vials containing ice. Data obtained during this preliminary experiment suggest that the temperature reading of TEMPRIS probes is not prone to distortion even when high solid content materials are present.
Fig. 8.
TEMPRIS and MTM data: impact of high concentration and fill depth on temperature over time profile during a 100 mg/mL trehalose freeze-drying cycle
Evaluation of Nucleation and Freezing Behavior when using TEMPRIS
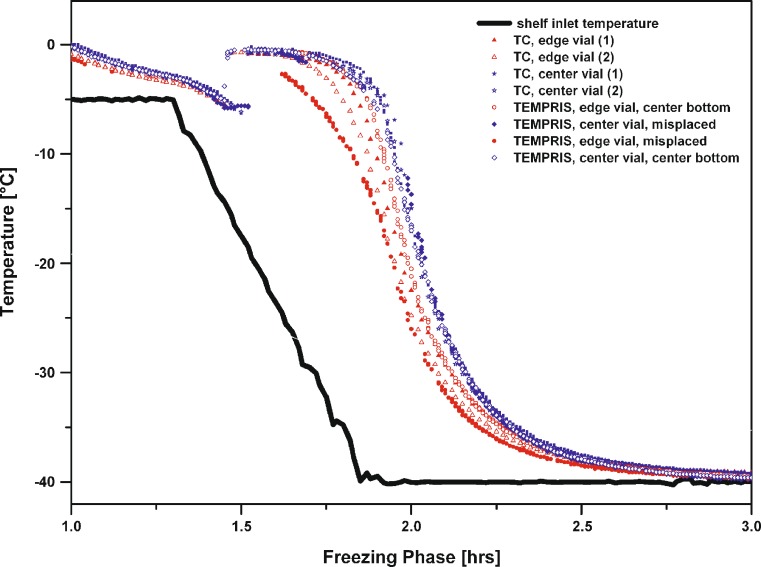
For a given vial size and fill depth, the effective surface area of the TEMPRIS sensor which is in contact with the product solution is greater relative to a thermocouple. Thus, one may be tempted to assume that there is a higher probability for heterogeneous nucleation relative to thin wire thermocouples which, in turn, would have a significant impact on resistance to water vapor flow during the primary drying phase of a freeze-drying cycle. However, analysis of the freezing behavior showed that the nucleation temperature (Tn) in vials containing TEMPRIS as well as thermocouples was only slightly reduced (Tn: −10 to −13 °C) and in the same temperature range (1–2 °C, 100 mg/mL trehalose solution, cf. Fig. 9) during laboratory scale experiments. It is well known from the literature that vials containing ANY type of probe show a different nucleation behavior relative to the rest of the vials in the batch (14,15,18). Freezing is a random event and depends on the probability that a spontaneous template, or nucleus, will form and enable crystallization of water molecules. The probability of ice nucleation varies with the number of nuclei at any time, independent of a surface exposed to a solution (18). Note that even vials (without probes) in the same chamber using the same freezing regimen nucleate at different temperatures and thus, dry at different rates. In the laboratory, the environment contains far more airborne “ice-nucleating” particles than a typical Class 100 production environment. Thus, a freezing procedure optimized in the laboratory may not transfer exactly to a manufacturing scale. The biggest effect probably arises from the cleaner air in the production environment, meaning fewer heterogeneous nucleation sites in the product solution and, hence, higher degrees of supercooling (18). A quantitative evaluation of this effect in sterile and particle-free systems is beyond the scope of this study, but should be investigated when employing TEMPRIS sensors in a production scale freeze dryer.
Fig. 9.
Impact of TEMPRIS sensors on nucleation and freezing of a 100 mg/mL trehalose solution
TEMPRIS Wireless Temperature Sensors: Merits and Demerits
As mentioned above, the greatest problem when using an invasive temperature measurement procedure during freeze-drying are possible differences of the freezing behavior between a vial containing ANY type of sensor and the rest of the batch. The freezing behavior of the vial containing ANY type of probe may be much different from those observed in the rest of the batch. However, considering that (1) most of the recent non-invasive PAT tools to determine the batch average product temperature (i.e. MTM) are currently not available in production (8) and (2) none of the non-invasive batch methods can delineate “edge effects”, implementation of the new TEMPRIS wireless probes might be of great value for laboratory, pilot and production scale freeze-drying to better evaluate heat and mass transfer conditions. Based on the experience gained during these preliminary experiments with the TEMPRIS wireless probes, a user may consider the following merits of the new wireless probes:
availability of additional temperature probes in any type of freeze-dryer. Here, an extension of up to 8 (16 in the near future according to the manufacturer) additional sensors may be used parallel to the number of thermocouples which were initially installed in the factory. TEMPRIS operate independently from the operating system of the freeze-dryer and provide real-time temperature data during the run. All TEMPRIS probes can be steam sterilized to allow their application in a sterile environment.
no heat conduction effects to the product which showed a positive impact on endpoint determination of primary drying. In addition, the slightly larger sensor tip indicated a more sensitive measurement of ice sublimation in the product.
when scaling a recipe from the laboratory to pilot or production, the same sensors may be used in comparable vial position (or patterns) on a shelf. This may facilitate the comparison of the temperature over time profiles for a given load as well as identify differences in the edge vial effect between different freeze-dryers.
The basic development of the TEMPRIS probes originated from tire-pressure measurement concepts supplied for the car industry and was not primarily developed for freeze-drying applications. Demerits of this first generation of wireless TEMPRIS probes may be summarized as follows:
for intermediate or high fill depth in a vial (Lice >0.4 cm), not only the tip but also the corpus of the sensor is located in the product solution. A re-designed sensor geometry is currently in development to allow an increase in Lice to >1 cm without immersing the corpus into the product,
the correct placement of the sensors (i.e. bottom center) in a given vial was found crucial to obtain reliable temperature profiles and endpoint monitoring. Although the TEMPRIS sensors can easily be placed by hand in any type of vial in the laboratory when using the experimental procedure described above, there is currently no technical solution to automatically place TEMPRIS sensors in vials during production (e.g. in a vial filling line or the loading procedure).
CONCLUSIONS
The temperature profiles observed using the new TEMPRIS wireless temperature sensors during freeze-drying of mannitol/sucrose binary mixtures as well as amorphous sucrose and trehalose showed excellent agreement with thermocouple and MTM data. The results obtained from TEMPRIS endpoint detection and edge vial characterization were found to be more representative compared to the corresponding thermocouple data. These results indicate that the TEMPRIS sensors may be used in the future as an additional one-hand tool to monitor product temperature data in the laboratory and production scale units. The overall acceptance of TEMPRIS, however, will likely depend upon a revised sensor design and a technological solution that guarantees a reproducible bottom center position in a vial.
References
- 1.Pikal M. J. Freeze Drying. Encyclopedia of Pharmaceutical Technology. New York: Marcel Dekker; 2002. [Google Scholar]
- 2.Carpenter J. F., Pikal M. J., Chang B. S., Randolph T. W. Rational design of stable lyophilized protein formulations: Some practical advice. Pharm. Res. 1997;14(8):969–975. doi: 10.1023/A:1012180707283. [DOI] [PubMed] [Google Scholar]
- 3.U.S. Food and Drug Administration. FDA-approved protein, peptide, vaccine, oligonucleotide, and cell based products grouped according to dosage form. http://www.fda.gov/cder/ (accessed 02/12/08).
- 4.Tang X., Pikal M. J. Design of freeze-drying processes for pharmaceuticals: Practical advice. Pharm. Res. 2004;21(2):191–200. doi: 10.1023/B:PHAM.0000016234.73023.75. [DOI] [PubMed] [Google Scholar]
- 5.Pikal M. J., Shah S. The collapse temperature in freeze drying: Dependence on measurement methodology and rate of water removal from the glassy phase. Int. J. Pharm. 1990;62:165–186. doi: 10.1016/0378-5173(90)90231-R. [DOI] [Google Scholar]
- 6.Rambhatla S., Obert J. P., Luthra S., Bhugra C., Pikal M. J. Cake shrinkage during freeze drying: A combined experimental and theoretical study. Pharm. Dev. Technol. 2005;1:33–40. doi: 10.1081/PDT-200035871. [DOI] [PubMed] [Google Scholar]
- 7.Wang W. Lyophilization and development of solid protein pharmaceuticals. Int. J. Pharm. 2000;203:1–60. doi: 10.1016/S0378-5173(00)00423-3. [DOI] [PubMed] [Google Scholar]
- 8.Gieseler H., Kramer T., Pikal M. J. Use of manometric temperature measurement (MTM) and SMART freeze dryer technology for cycle development of an optimized freeze-drying cycle. J. Pharm. Sci. 2007;96(12):3402–3418. doi: 10.1002/jps.20982. [DOI] [PubMed] [Google Scholar]
- 9.Oetjen G. W. Freeze Drying. Weinheim: Wiley-VCH; 1999. [Google Scholar]
- 10.H. Gieseler. Process Analytical Technology (PAT) in drying operations: Applications to freeze drying and beyond. Proc. AAPS National Biotechnology Conference, San Diego, CA, USA, June 24–27 (2007).
- 11.I. Presser. Innovative online measurement procedures to optimize freeze-drying processes [Innovative Online Messverfahren zur Optimierung von Gefriertrocknungsprozessen], PhD Thesis 2003, Department of Pharmaceutics, University of Munich. Available online: http://edoc.ub.uni-muenchen.de/1665/ (accessed 10/23/07).
- 12.K. Hammerer. Wireless temperature-measurement as an innovative PAT-method. Proc. 2nd congress on life science process technology, Nuremberg, Germany, March 28 (2007).
- 13.S. von Graberg, and H. Gieseler. Freeze drying from 96-well PCR-plates: Transferability of heat transfer coefficients obtained from sublimation tests to product runs and considerations for cycle design. Proc. AAPS Annual Meeting and Exposition; San Diego, CA, USA, Nov. 11–15 (2007).
- 14.Rambhatla S., Pikal M. J. Heat and mass transfer scale-up issues during freeze drying I: Atypical radiation and the edge vial effect. AAPS PharmSciTech. 2003;4(2):111–120. doi: 10.1208/pt040214. [DOI] [PMC free article] [PubMed] [Google Scholar]
- 15.Rambhatla S., Ramot R., Bhugra C., Pikal M. J. Heat and mass transfer scale-up issues during freeze drying: II. Control and characterization of the degree of supercooling. AAPS PharmSciTech. 2004;5(4):1–9. doi: 10.1208/pt050458. [DOI] [PMC free article] [PubMed] [Google Scholar]
- 16.Tang X., Nail S. L., Pikal M. J. Freeze-drying process design by manometric temperature measurement: Design of a smart freeze-dryer. Pharm. Res. 2005;22(4):685–700. doi: 10.1007/s11095-005-2501-2. [DOI] [PubMed] [Google Scholar]
- 17.Wang W., Singh S., Zeng D. L., King K., Nema S. Antibody structure, instability, and formulation. J. Pharm. Sci. 2007;96(1):1–26. doi: 10.1002/jps.20727. [DOI] [PubMed] [Google Scholar]
- 18.Searles J. A., Carpenter J. F., Randolph T. W. The ice nucleation temperature determines the primary drying rate of lyophilization for samples frozen on a temperature-controlled shelf. J. Pharm. Sci. 2001;90(7):860–871. doi: 10.1002/jps.1039. [DOI] [PubMed] [Google Scholar]


