

Abstract
BACKGROUND
National and population-based information on the increase in patient care by hospitalists in the United States is lacking.
METHODS
Using a 5% sample of Medicare beneficiaries in 1995, 1997, 1999, and the period from 2001 through 2006, we identified 120,226 physicians in general internal medicine who were providing care to older patients in 5800 U.S. hospitals. We defined hospitalists as general internists who derived 90% or more of their Medicare claims for evaluation-and-management services from the care of hospitalized patients. We then calculated the percentage of all inpatient Medicare services provided by hospitalists and identified patient and hospital characteristics associated with the receipt of hospitalist services.
RESULTS
The percentage of physicians in general internal medicine who were identified as hospitalists increased from 5.9% in 1995 to 19.0% in 2006, and the percentage of all claims for inpatient evaluation-and-management services by general internists that were attributed to hospitalists increased from 9.1% to 37.1% during this same period. Accompanying the increase in care by hospitalists was an increase in the percentage of all hospitalized Medicare patients who were treated by general internists (both hospitalists and traditional, non–hospital-based general internists), from 46.4% in 1995 to 61.0% in 2006. In a multilevel, multivariable analysis controlling for patient and hospital characteristics, the odds of receiving care from a hospitalist increased by 29.2% per year from 1997 through 2006. In 2006, there was marked geographic variation in the rates of care provided by hospitalists, with rates of more than 70% in some hospital-referral regions.
CONCLUSIONS
These analyses of data from Medicare claims showed a substantial increase in the care of hospitalized patients by hospitalist physicians from 1995 to 2006.
Since the mid-1990s, there has been rapid growth in the number of hospitalists and the number of hospitals served by hospitalist groups.1–10 The Society of Hospital Medicine estimated a 20% increase in the number of hospitalists between 2005 and 2006.10 A 2005 survey by the American Hospital Association showed that 40% of community hospitals had hospitalist programs, and a 2006–2007 survey showed that at least 59% of all hospitals in California had hospitalist programs.7,8
Surveys also indicate that approximately 85% of hospitalists are trained in internal medicine.4 Approximately 96% of the clinical encounters of self-identified hospitalists are with hospitalized patients.4
Although survey data have shown a sharp increase in the number of hospitalists, the response rates in these surveys are generally low. To our knowledge, there are no national or population-based data on hospitalist care. Using national Medicare data, we assessed the growth in hospitalist care in 5800 U.S. hospitals from 1995 through 2006 and examined variations in this growth according to patient and hospital characteristics.
METHODS
SOURCE OF DATA
Data on hospitalist care were obtained from the Centers for Medicare and Medicaid Services Provider of Service File and claims and enrollment files from the years 1995, 1997, and 1999 and the period from 2001 through 2006 for a 5% national sample of Medicare beneficiaries.
MEASURES
Demographic characteristics of patients were determined from enrollment files, and hospital-admission data (e.g., emergency department vs. nonemergency admission, weekend vs. weekday admission, and diagnosis-related group [DRG]) from the Medicare Provider Analysis and Review (MedPAR) files. Data on the physician’s specialty were obtained from Part B claims in the Medicare carrier files in a given year. Physicians with multiple specialty codes were assigned the specialty that appeared most often in their claims for that year. We also performed analyses in which physicians with more than one specialty code were excluded, and the results of these analyses were similar. Hospital characteristics (e.g., ZIP Code, county, state, total number of beds, type of hospital, and medical-school affiliation) were obtained from 2004 Provider of Service files. Data on the sizes of metropolitan areas were obtained from 2000 Census data.
Hospital-referral regions are described in the Dartmouth Atlas of Health Care.11 The size of each metropolitan area and the total number of beds were categorized according to quartiles. States were grouped as Census regions; the type of hospital was categorized as not-for-profit, for-profit, or government; and the medical-school affiliation was categorized as none, minor, or major.
IDENTIFICATION OF HOSPITALISTS
We defined hospitalists as physicians in general internal medicine who had at least five evaluation-and-management billings in a given year and generated at least 90% of their total evaluation-and-management billings in the year from services to hospital inpatients (Fig. 1). Since our source of data is a 5% sample, these five evaluation-and-management billings represent 100 or more charges to Medicare patients. Using inpatient evaluation-and-management billing codes (Current Procedural Terminology [CPT] codes 99221–99223, 99231–99233, and 99251–99255) and outpatient evaluation-and-management billing codes (CPT codes 99201–99205, 99211–99215, and 99241–99245), we calculated the percentage of each physician’s evaluation-and-management claims that were generated from services provided to hospitalized patients.
Figure 1. Distribution of Physicians in General Internal Medicine According to the Percentage of Evaluation-and-Management Medicare Claims Generated from the Care of Hospitalized Patients, 2001 through 2006.

In 2001, 30.0% of general internists derived less than 10% of their evaluation-and-management billing codes from the care of hospital inpatients, and 9.7% of general internists derived 90% or more of these billing codes from the care of hospital inpatients. From 2001 through 2006, the percentage of physicians generating less than 10% or 90% or more of these billing codes from the care of hospital inpatients increased. Conversely, the percentage of physicians with more balanced distributions between inpatient and outpatient services decreased.
We analyzed the effect of different cutoff points according to the percentage of evaluation-and-management charges generated from care provided to hospitalized patients (≥80% vs. ≥90%) and according to the minimum number of evaluation-and-management charges in a given year in the 5% sample of Medicare data (≥5 vs. ≥10) in the algorithm to identify hospitalists. We tested the algorithm in a validation set of 57 hospitalists and 172 physicians in traditional non–hospital-based general internal medicine (hereafter referred to as nonhospitalists) employed in 2006 at seven hospitals. These hospitals were located in California (University of California, Los Angeles, Medical Center), Michigan (Wayne State University Detroit Medical Center), Virginia (Hospital Corporation of America [HCA]–affiliated hospitals in Richmond, including Henrico Doctors’ Hospital, John Randolph Medical Center, HCA Retreat Hospital, Johnston Willis Hospital, and Chippenham Hospital), Wisconsin (Sinai Samaritan Medical Center), and Texas (University of Texas Medical Branch, Clear Lake Regional Medical Center, and University of Texas Health Science Center at San Antonio). The algorithm requiring a minimum of 5 evaluation-and-management charges per physician in a given year and the algorithm requiring 10 or more such charges, with both requiring that 90% or more of the charges represent the care of hospitalized patients, had a sensitivity of 84.2% and 71.9%, a specificity of 96.5% and 97.1%, and a positive predictive value of 88.9% and 89.1%, respectively. The algorithm requiring 5 or more evaluation-and-management charges and the algorithm requiring 10 or more such charges, with both requiring that 80% or more of the charges represent the care of hospital inpatients, had a sensitivity of 87.7% and 73.7%, a specificity of 93.0% and 94.2%, and a positive predictive value of 80.6% and 80.8%, respectively. The sensitivities of the four algorithms were very similar (91.1%, 88.9%, 91.1%, and 88.9%, respectively) when applied to 45 hospitalists in two hospitalist groups serving community hospitals in the Houston and Austin metropolitan areas. We selected the algorithm requiring at least five evaluation-and-management charges with at least 90% of such charges generated from the care of hospital inpatients because the sensitivity (84.2%) and positive predictive value (88.9%) were acceptable.
We also evaluated the specificity of the algorithm by assessing whether hospitalists in general internal medicine identified by the algorithm submitted claims for procedures that are not usually performed by general internists; these procedures included colonoscopy, upper endoscopy, liver biopsy, hemodialysis, peritoneal dialysis, kidney biopsy, bronchoscopy, and cardiac catheterization. In 1995, the proportion of physicians identified as hospitalists who billed for one or more of these procedures was 14.9%; this percentage decreased to 2.3% in 2006. In some analyses, we also calculated the percentage of physicians in other specialties for whom more than 90% of evaluation-and-management billing codes were generated from services provided to hospitalized patients.
IDENTIFICATION OF PATIENTS WHO RECEIVED CARE FROM A HOSPITALIST
All 5,300,657 hospital admissions in 1995, 1997, 1999, and the period from 2001 through 2006 in MedPAR files were selected. We censored data on 6077 admissions that could not be linked to Provider of Service files. For most analyses, we also censored data on 2,969,722 admissions that did not involve a charge for evaluation-and-management services by a physician in general internal medicine. The admissions were categorized according to whether the evaluation-and-management services by physicians in general internal medicine had been provided by a hospitalist or nonhospitalist. In 174,579 admissions, patients received care from both hospitalists and nonhospitalists (about 3 to 6% of admissions in the period from 1995 through 2001 and 7 to 11% in the period from 2002 through 2006). Data on these admissions were censored, leaving 2,150,279 admissions involving 990,785 patients in 5800 hospitals.
STATISTICAL ANALYSIS
The proportions of admissions involving care by hospitalists were calculated, plotted according to year, and then stratified according to selected patient and hospital characteristics. In this multilevel analysis, the effect of patient and hospital characteristics on whether or not a patient was cared for by a hospitalist was evaluated with the use of a hierarchical generalized linear model with a logistic link to adjust for clustering of admissions (level 1) within hospitals (level 2). Because there were interactions between the year of admission and the characteristics of the patients and hospitals, stratified, hierarchical generalized linear models for the years 1997, 2001, and 2006 were constructed. All tests of statistical significance were two-sided. Analyses were performed with the use of SAS statistical software, version 9.1 (SAS Institute).
RESULTS
IDENTIFICATION OF HOSPITALISTS
Figure 1 shows the distribution of general internists according to the percentage of their evaluation-and-management billing codes generated from the care of hospitalized patients. Data are presented for each year from 2001 through 2006. During this period, the percentage of physicians generating less than 10% or 90% or more of their evaluation-and-management codes from services provided to hospital inpatients increased. Conversely, the percentage of physicians with more balanced distributions between inpatient and outpatient services decreased.
GROWTH IN HOSPITALIST CARE
We next defined hospitalists as physicians who generated more than 90% of their evaluation-and-management claims from the care of hospitalized patients. As shown in Figure 2A, the percentage of hospitalists among general internists increased from 5.9% in 1995 to 19.0% in 2006, with rapid growth starting in 1997. Also shown are the percentages of cardiologists, pulmonologists, gastroenterologists, and family physicians and general practitioners who met the definition of hospitalist. The percentages of cardiologists, gastroenterologists, and family physicians and general practitioners who were hospitalists remained low over time; the percentage of pulmonologists who were hospitalists was higher but increased only slightly over time.
Figure 2. Growth of Hospitalist Care in U.S. Hospitals from 1995 through 2006.

Panel A shows the percentage of hospitalists over time, according to medical specialty. The change over time in the percentage of Medicare admissions involving care by physicians in general internal medicine who received all of their general internal-medical care from hospitalists is shown, stratified according to geographic region (Panel B), teaching status of the hospital (Panel C), hospital size (Panel D), the patient’s race or ethnic group (Panel E), type of admission (emergency vs. nonemergency) (Panel F), and type of surgical (Panel G) or medical (Panel H) diagnosis. Rapid growth of hospitalist care occurred in all patient and hospital groups and in all geographic regions. DRG denotes diagnosis-related group.
The rapid growth in care by hospitalists who were general internists was accompanied by an increase in the percentage of all hospitalized patients who were seen by any general internist (either hospitalist or nonhospitalist). In 1995, a total of 46.4% of all Medicare admissions were associated with an evaluation-and-management claim by a general internist. This percentage increased to 61.0% by 2006. The increase was similar for patients with medical DRG codes (from 47.3% to 62.7%) and those with surgical DRG codes (from 43.3% to 55.3%). All results reported below are limited to analyses of data for patients seen in the hospital by a general internist.
The percentage of all evaluation-and-management claims by physicians in general internal medicine for the care of hospitalized Medicare patients that was attributable to hospitalists increased from 9.1% in 1995 to 37.1% in 2006. Figures 2B through 2H show how the percentage of patients cared for by hospitalists varied over time and according to patient and hospital characteristics. The increase in care by hospitalists was highest in the mountain states and lowest in the mid-Atlantic states (Fig. 2B). Non-teaching hospitals lagged approximately 1 year behind teaching hospitals in terms of the increase in care by hospitalists (Fig. 2C). With respect to this increase, there was a clear relationship to hospital size, with the largest hospitals about 2 years ahead of the smallest hospitals (Fig. 2D). Black patients were more likely than white patients to receive hospitalist care in the late 1990s, but this difference disappeared by 2006 (Fig. 2E). The increase in hospitalist care was greater for admissions from the emergency room than for non–emergency room admissions (Fig. 2F). Among surgical patients, the largest increase in hospitalist care was for orthopedic surgery (Fig. 2G). Differences in the increase in care by hospitalists according to medical diagnoses were relatively small (Fig. 2H); patients with neurologic diagnoses were most likely to be cared for by hospitalists. The results were similar when the data were stratified according to the patient’s age and sex and according to whether the hospital was a not-for-profit or a for-profit hospital.
The percentage of hospitals with at least three hospitalists increased from 11.6% in 1995 to 47.1% in 2006, with an increase from 41.9% to 83.7% among major teaching hospitals and an increase from 5.5% to 38.4% among non-teaching hospitals. Among hospitals with any hospitalists, the median number of hospitalists per hospital was two in 1995, two in 2001, and four in 2006. In major teaching and nonteaching hospitals, the median numbers of hospitalists were 11 and 3, respectively, in 2006.
VARIATION IN HOSPITALIST USE
Figure 3 shows the proportions of admitted Medicare patients who were cared for by hospitalists in 306 hospital-referral regions in 1997, 2001, and 2006. The geographic variation in rates of care by hospitalists increased during this period. By 2006, the hospital-referral regions with the highest percentages of patients who received care from hospitalists included St. Cloud, Minnesota (85.6%), Mesa, Arizona (84.0%), Appleton, Wisconsin (81.6%), Austin, Texas (80.5%), and Bangor, Maine (80.3%). In 56 hospital-referral regions, more than 50% of inpatients cared for by general internists received hospitalist care in 2006.
Figure 3. Hospitalist Care of Medicare Patients in 306 Hospital-Referral Regions in 1997, 2001, and 2006.
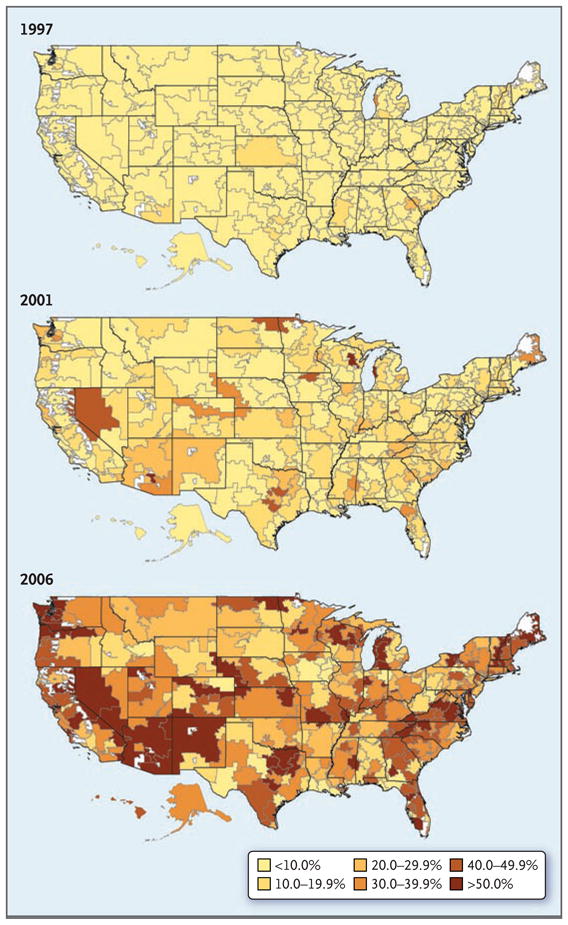
The maps show the percentage of Medicare patients, among those cared for by physicians in general internal medicine, who received all their care from hospitalists, according to the hospital-referral region. In 1997, there was little variation among regions; in 85.0% of the hospital-referral regions, less than 10% of hospitalized Medicare patients received care from a hospitalist. Both the percentage of patients receiving hospitalist care and the variation among hospital-referral regions increased from 1997 to 2001 and from 2001 to 2006. White areas on the maps indicate areas without residents, such as national parks.
In a multilevel, multivariable analysis that included patient and hospital characteristics, the odds that a hospitalized Medicare patient was cared for by a hospitalist increased 29.2% per year during the period from 1997 through 2006. In this analysis, there were significant interactions between the year and most other variables. In Table 1, separate analyses of data from 1997, 2001, and 2006 show the change over time in the relationship of patient and hospital characteristics to the odds of receiving hospitalist care. In 1997, black patients were more likely than white patients to receive hospitalist care, but this difference had diminished by 2006. Similarly, the variations according to the size of the metropolitan area, type of hospital, and hospital teaching status observed in 1997 had decreased by 2006. Conversely, variations according to geographic region and according to the type of hospital admission (emergency room vs. nonemergency type of admission) increased over time. There was clear variation according to hospital size during all three time periods.
Table 1.
Multilevel, Multivariable Analysis of the Odds of Receiving Care by a Hospitalist among Medicare Patients Hospitalized in 1997, 2001, and 2006.*
| Variable | 1997 | 2001 | 2006 |
|---|---|---|---|
| odds ratio (95% CI) | |||
| Patient characteristics | |||
| Age | |||
| <65 yr† | 1.40 (1.33–1.47) | 1.27 (1.22–1.32) | 1.22 (1.18–1.25) |
| 65–74 yr | 1.00 | 1.00 | 1.00 |
| 75–84 yr | 0.90 (0.87–0.94) | 0.93 (0.90–0.96) | 0.92 (0.90–0.94) |
| ≥85 yr | 0.90 (0.86–0.94) | 0.95 (0.92–0.98) | 0.92 (0.89–0.94) |
| Sex | |||
| Male | 1.00 | 1.00 | 1.00 |
| Female | 0.95 (0.92–0.98) | 0.95 (0.92–0.97) | 0.96 (0.95–0.98) |
| Race or ethnic group | |||
| White | 1.00 | 1.00 | 1.00 |
| Black | 1.35 (1.29–1.42) | 1.16 (1.12–1.20) | 1.08 (1.05–1.11) |
| Other | 1.14 (1.06–1.23) | 1.11 (1.04–1.17) | 1.12 (1.07–1.17) |
| Type of admission | |||
| Emergency room vs. nonemergency | 1.15 (1.11–1.19) | 1.43 (1.39–1.47) | 1.55 (1.52–1.59) |
| Weekend vs. weekday | 1.04 (1.00–1.08) | 0.97 (0.95–1.00) | 0.98 (0.96–1.00) |
| Type of diagnosis | |||
| Medical | |||
| Cardiac | 1.00 | 1.00 | 1.00 |
| Neurologic | 1.03 (0.97–1.10) | 1.24 (1.18–1.30) | 1.29 (1.24–1.34) |
| Pulmonary | 1.13 (1.07–1.19) | 1.17 (1.12–1.22) | 1.07 (1.03–1.10) |
| Gastrointestinal | 0.91 (0.86–0.97) | 1.02 (0.97–1.07) | 1.04 (1.00–1.07) |
| Other | 1.20 (1.15–1.26) | 1.21 (1.17–1.25) | 1.17 (1.14–1.21) |
| Surgical | |||
| Orthopedic | 1.16 (1.08–1.25) | 1.42 (1.34–1.49) | 1.47 (1.41–1.53) |
| Cardiac | 1.48 (1.37–1.61) | 0.90 (0.84–0.96) | 0.87 (0.83–0.91) |
| Gastrointestinal | 0.97 (0.88–1.07) | 0.98 (0.91–1.06) | 0.94 (0.89–1.00) |
| Other | 1.25 (1.18–1.33) | 1.34 (1.27–1.41) | 1.24 (1.19–1.30) |
| Hospital characteristics | |||
| Region | |||
| Mid-Atlantic | 1.00 | 1.00 | 1.00 |
| New England | 0.66 (0.41–1.04) | 0.79 (0.50–1.26) | 3.70 (2.50–5.49) |
| Eastern north central | 0.60 (0.44–0.83) | 0.87 (0.64–1.17) | 1.07 (0.81–1.41) |
| Western north central | 0.72 (0.49–1.06) | 1.87 (1.31–2.67) | 2.14 (1.54–2.96) |
| Southern Atlantic | 0.87 (0.64–1.19) | 1.51 (1.11–2.04) | 2.09 (1.58–2.78) |
| Eastern south central | 0.73 (0.49–1.09) | 1.65 (1.14–2.38) | 1.62 (1.16–2.27) |
| Western south central | 0.90 (0.64–1.28) | 1.77 (1.27–2.46) | 1.73 (1.27–2.35) |
| Mountain | 0.47 (0.29–0.75) | 1.99 (1.33–2.98) | 3.42 (2.39–4.89) |
| Pacific | 0.61 (0.43–0.86) | 1.14 (0.81–1.59) | 1.99 (1.47–2.70) |
| Population of metropolitan area | |||
| <100,000 persons | 1.00 | 1.00 | 1.00 |
| 100,000–249,999 persons | 0.48 (0.33–0.71) | 0.60 (0.43–0.85) | 0.98 (0.73–1.31) |
| 250,000–999,999 persons | 0.78 (0.58–1.05) | 1.09 (0.83–1.44) | 1.40 (1.10–1.77) |
| ≥1 million persons | 1.97 (1.54–2.50) | 2.41 (1.93–3.01) | 1.77 (1.45–2.15) |
| Academic status | |||
| Nonteaching | 1.00 | 1.00 | 1.00 |
| Teaching — minor | 1.15 (0.90–1.46) | 1.04 (0.83–1.30) | 1.02 (0.83–1.25) |
| Teaching — major | 1.77 (1.33– 2.37) | 1.27 (0.96–1.68) | 1.24 (0.95–1.62) |
| Type of hospital | |||
| Not-for-profit | 1.00 | 1.00 | 1.00 |
| For-profit | 1.42 (1.09–1.85) | 1.29 (1.02–1.65) | 0.93 (0.74–1.16) |
| Government | 1.55 (1.22–1.97) | 1.20 (0.96–1.50) | 0.94 (0.78–1.14) |
| Size | |||
| <200 beds | 1.00 | 1.00 | 1.00 |
| 200–349 beds | 1.15 (0.91–1.45) | 1.35 (1.09–1.69) | 1.33 (1.09–1.63) |
| 350–499 beds | 1.54 (1.15–2.07) | 2.19 (1.66–2.89) | 1.88 (1.46–2.44) |
| ≥500 beds | 2.29 (1.65–3.17) | 3.72 (2.72–5.08) | 2.27 (1.70–3.04) |
Odds ratios are for the odds that patients who were receiving care from physicians in general internal medicine would receive all their care from hospitalists. CI denotes confidence interval.
Most Medicare patients who are younger than 65 years of age are disabled or have end-stage renal disease.
CHARACTERISTICS OF HOSPITALISTS
The number of hospitalists who were general internists increased from 2770 in 1995 to 13,466 in 2006. In 2006, a total of 4839 hospitalists were practicing at major teaching hospitals, 3905 at minor teaching hospitals, and 7498 at nonteaching hospitals (some hospitalists practiced at more than one type of hospital).
To assess the career trajectory of hospitalists, we examined the billing patterns in the years before and after 2002 among the 6898 general internists identified as hospitalists in 2002 (Fig. 4). The data suggest that most hospitalists in 2002 had been in training within the previous 3 to 5 years, because they had not generated Medicare charges in previous years. Most of the hospitalists in 2002 were still practicing hospital medicine during the following 4 years, with smaller proportions of hospitalists returning to further training or switching to outpatient practice.
Figure 4. Pattern of Medicare Claims in the Years before and after 2002 among Physicians in General Internal Medicine Who Were Identified as Hospitalists in 2002.

In 2002, a total of 6898 physicians in general internal medicine generated 90% or more of their Medicare claims from services to hospitalized patients. The bars show the percentage of these physicians who were predominantly practicing hospital medicine, predominantly practicing outpatient medicine, or generating few or no Medicare claims in the years before and after 2002. Only 36.9% of these physicians devoted the majority of their time to inpatient care in 1999; 9.5% were primarily outpatient physicians, 2.9% were listed in other specialties, and 50.7% had few or no billing cades (indicating that they were still in training). By 2006, a total of 63.0% of the physicians identified as hospitalists in 2002 were still devoting the majority of their time to inpatients, 8.8% were primarily outpatient general internists, 9.2% were in other specialties, and 19.0% had few or no evaluation-and-management charges (suggesting that they might have returned to training). In these analyses, “predominantly practicing hospital or outpatient medicine” was defined as 50% or more of evaluation-and-management claims generated from the care of hospital patients or outpatients, respectively. “Few or no Medicare claim” was defined as fewer than five claims per year. Data for the years 1998 and 2000 were not available
We assessed how the career stability of hospitalists changed over time by calculating the percentage of hospitalists who still generated more than 90% of evaluation-and-management claims from the care of hospitalized patients 2 years later. Of the hospitalists identified in 1995, a total of 33.4% were still generating more than 90% of evaluation-and-management claims from the care of hospitalized patients in 1997. Of the hospitalists identified in 2004, a total of 65.7% were still generating 90% or more of these claims from the care of hospitalized patients in 2006.
DISCUSSION
The major finding of this study is the very rapid growth in care by hospitalists in the late 20th and early 21st century. The odds that a hospitalized Medicare patient would receive care from a hospitalist increased by 29.2% per year from 1997 to 2006. The map of hospitalist penetration according to hospital-referral region (Fig. 3) shows that by 2006, almost all areas of the United States were served by hospitalists. Also, although the growth of care by hospitalists has been greater in large hospitals, teaching hospitals, and in certain geographic areas, substantial growth occurred in every area and type of hospital.
The growth in care by hospitalists who are general internists resulted in an increase in the percentage of all Medicare inpatients who were cared for by a general internist, whether hospitalist or nonhospitalist, from 46.4% in 1995 to 61.0% in 2006. The increase in care by hospitalists (Fig. 2A) started before prospective trials and observational studies showed that hospitalists were associated with decreased hospital costs, with no deleterious effect on outcomes.12–17 Saint and colleagues18 made a similar point in their analysis of 1994 Medicare data from Washington State.
Our data also suggest that the career stability of hospitalists has increased over time. Only 33.4% of physicians identified as being hospitalists in 1995 still met the definition 2 years later, whereas 65.7% of hospitalists identified in 2004 still derived 90% or more of their claims from the care of hospitalized patients 2 years later.
This research has limitations. Analyses of Medicare claims will not identify pediatric hospitalists19,20 and hospitalists who only treat patients in health maintenance organizations (HMOs). Our definition also excludes medical subspecialists and family physicians who are hospitalists. A 2006–2007 survey by the Society of Hospital Medicine showed that 82.3% of hospitalists were general internists, 4.0% were internal-medicine subspecialists, 3.7% were family practitioners, and 10% were pediatricians or pediatricians who were also internists.4
Because we were assessing only hospitalists in general internal medicine, our estimates of the percentage of patients cared for by hospitalists were limited to those patients who received care from any physician in general internal medicine while hospitalized. Including all hospitalized patients in the denominator would result in lower estimates of hospitalist care, but it would not substantially alter the association of patient and hospital characteristics with hospitalist use. The only noteworthy change was a much lower estimate for cardiology surgical DRGs.
We considered a physician to be a “general internist” based on the specialty code shown on the majority of his or her Part B claims in a given year. This method has been used in previous studies,21–23 and it may differ somewhat from other sources of specialty information, such as the Physician Masterfile of the American Medical Association and the Unique Physician Identification Number Directory.24
We used a functional definition of hospitalist, whereas previous studies of hospitalists have been based on self-report (i.e., a hospitalist is a physician who calls himself or herself a hospitalist). We chose a cutoff point of 90% for evaluation-and-management claims generated from the care of hospitalized patients because that was the category that grew rapidly from 2001 through 2006. Our estimate of the number of hospitalists nationally was dependent on cutoff points chosen for the algorithms. For example, the estimated number of hospitalists in 2006 was 13,466 with the use of the cutoff point of 90% for evaluation-and-management charges generated from the care of hospitalized patients. At a cutoff point of 50%, the estimate would be 23,112; at 70%, it would be 17,568; and at 80%, it would be 15,560. Many early descriptions of hospitalists were of physicians who devoted more than 50% of their clinical time to inpatient care but continued to provide outpatient care.12,13,18 Our definition would have missed many of these persons. It is not clear to what extent this model is still followed.25 A 2007–2008 survey of hospitalist physicians showed that, on average, only 1.1% of their total encounters were with outpatients and only 0.9% were with patients in the emergency room, suggesting that the great majority of hospitalists today are devoting their time almost exclusively to the care of hospitalized patients.4
The estimate of hospitalists was also dependent on the cutoff point chosen for the minimum number of Medicare evaluation-and-management charges in the 5% Medicare sample in order for a physician to be included in the analyses. If we had changed the cutoff point from 5 evaluation-and-management charges to 10, then the estimated number of hospitalists in 2006 would have decreased from 13,466 to 11,897. However, the use of different cutoff points for the number of evaluation-and-management charges or the percentages of these charges generated from services provided to hospitalized patients did not greatly affect the dramatic growth of hospitalists over the period from 1995 through 2006.
The specificity of our definition seems to have improved over time. As noted in the Methods section, 14.9% of physicians who were identified as hospitalists in 1995 billed for procedures normally performed by subspecialists, and this percentage decreased to 2.3% in 2006.
Another limitation of our study is that some of our inferences are based on indirect data. For example, we inferred from the data in Figure 4 that an absence of Medicare billing indicated that the physician was in training, but retired physicians or full-time employees of HMOs or government hospitals also might not generate Medicare charges.
The rapid growth of care by hospitalists exemplifies the dynamic nature of medical care in the United States in recent years. The decreased variation in rates of hospitalist care over time according to most patient and hospital characteristics is consistent with previous studies of the diffusion of new medical practices and techniques.26,27 Medicare data allow us to track many of those changes at a national level.
Acknowledgments
Supported by grants from the Claude D. Pepper Older Americans Independence Center (5P30AG024832) and the Center for Population Health and Health Disparities (5P50CA105631) at the University of Texas Medical Branch.
We thank Hyunsu Ju, Ph.D., for assistance with preparation of an earlier version of the map and Kelley Prevou and Sarah Toombs Smith, Ph.D., for assistance with preparation of an earlier version of the manuscript.
Footnotes
Dr. Sharma reports receiving lecture fees from Pfizer. No other potential conflict of interest relevant to this article was reported.
References
- 1.Coffman J, Rundall TG. The impact of hospitalists on the cost and quality of inpatient care in the United States: a research synthesis. Med Care Res Rev. 2005;62:379–406. doi: 10.1177/1077558705277379. [DOI] [PubMed] [Google Scholar]
- 2.Freed D. Hospitalists: evolution, evidence, and eventualities. Health Care Manag (Frederick) 2004;23:238–56. doi: 10.1097/00126450-200407000-00008. [DOI] [PubMed] [Google Scholar]
- 3.Wachter RM, Goldman L. The emerging role of “hospitalists” in the American health care system. N Engl J Med. 1996;335:514–7. doi: 10.1056/NEJM199608153350713. [DOI] [PubMed] [Google Scholar]
- 4.Society of Hospital Medicine releases results of the 2007–2008 survey on the state of hospital medicine movement. Philadelphia: SHM; 2008. [Accessed February 17, 2009]. at http://www.hospitalmedicine.org/AM/Template.cfm?Section=Home&TEMPLATE=/CM/ContentDisplay.cfm&CONTENTID=18782. [Google Scholar]
- 5.Lindenauer PK, Pantilat SZ, Katz PP, Wachter RM. Hospitalists and the practice of inpatient medicine: results of a survey of the National Association of Inpatient Physicians. Ann Intern Med. 1999;130:343–9. doi: 10.7326/0003-4819-130-4-199902161-00003. [DOI] [PubMed] [Google Scholar]
- 6.Kralovec PD, Miller JA, Wellikson L, Huddleston JM. The status of hospital medicine groups in the United States. J Hosp Med. 2006;1:75–80. doi: 10.1002/jhm.82. [DOI] [PubMed] [Google Scholar]
- 7.Vasilevskis E, Knebel J, Wachter R, Auerbach A. The rise of the hospitalist in California. Oakland: California Healthcare Foundation; Jul, 2007. [Accessed February 17, 2009]. http://www.chcf.org/topics/hospitals/index.cfm?itemID=133365. [Google Scholar]
- 8.Wachter RM. The state of hospitalist medicine in 2008. Med Clin North Am. 2008;92:265–73. doi: 10.1016/j.mcna.2007.10.008. [DOI] [PubMed] [Google Scholar]
- 9.Glasheen JJ, Epstein KR, Siegal E, Kutner JS, Prochazka AV. The spectrum of community-based hospitalist practice: a call to tailor internal medicine residency training. Arch Intern Med. 2007;167:727–8. doi: 10.1001/archinte.167.7.727. [DOI] [PubMed] [Google Scholar]
- 10.Hospital medicine specialty shows 20 percent growth. Philadelphia: Society of Hospital Medicine; 2007. [Accessed February 17, 2009]. at http://www.hospitalmedicine.org/AM/Template.cfm?Section=Press_Releases&Template=/CM/HTMLDisplay.cfm&ContentID=16196. [Google Scholar]
- 11.The Dartmouth Atlas of Health Care. [Accessed February 17, 2009];ZIP Code crosswalk files: HRR boundaries. at http://www.dartmouthatlas.org/data/download.shtm.
- 12.Wachter RM, Katz P, Showstack J, Bindman AB, Goldman L. Reorganizing an academic medical service: impact on cost, quality, patient satisfaction, and education. JAMA. 1998;279:1560–5. doi: 10.1001/jama.279.19.1560. [DOI] [PubMed] [Google Scholar]
- 13.Palmer HC, Armistead NS, Elnicki M, et al. The effect of a hospitalist service with nurse discharge planner on patient care in an academic teaching hospital. Am J Med. 2001;111:627–32. doi: 10.1016/s0002-9343(01)00976-7. [DOI] [PubMed] [Google Scholar]
- 14.Kearns PJ, Wang CC, Morris WJ, et al. Hospital care by hospital-based and clinic-based faculty: a prospective, controlled trial. Arch Intern Med. 2001;161:235–41. doi: 10.1001/archinte.161.2.235. [DOI] [PubMed] [Google Scholar]
- 15.Meltzer D, Manning WG, Morrison J, et al. Effects of physician experience on costs and outcomes on an academic general medicine service: results of a trial of hospitalists. Ann Intern Med. 2002;137:866–74. doi: 10.7326/0003-4819-137-11-200212030-00007. [DOI] [PubMed] [Google Scholar]
- 16.Auerbach AD, Wachter RM, Katz P, Showstack J, Baron RB, Goldman L. Implementation of a voluntary hospitalist service at a community teaching hospital: improved clinical efficiency and patient outcomes. Ann Intern Med. 2002;137:859–65. doi: 10.7326/0003-4819-137-11-200212030-00006. [DOI] [PubMed] [Google Scholar]
- 17.Lindenauer PK, Rothberg MB, Pekow PS, Kenwood C, Benjamin EM, Auerbach AD. Outcomes of care by hospitalists, general internists, and family physicians. N Engl J Med. 2007;357:2589–600. doi: 10.1056/NEJMsa067735. [DOI] [PubMed] [Google Scholar]
- 18.Saint S, Christakis DA, Baldwin LM, Rosenblat R. Is hospitalism new? An analysis of Medicare data from Washington State in 1994. Eff Clin Pract. 2000;3:35–9. [PubMed] [Google Scholar]
- 19.Freed GL, Brzoznowski K, Neighbors K, Lakhani I. Characteristics of the pediatric hospitalist workforce: its roles and work environment. Pediatrics. 2007;120:33–9. doi: 10.1542/peds.2007-0304. [DOI] [PubMed] [Google Scholar]
- 20.Landrigan CP, Conway PH, Edwards S, Srivastava R. Pediatric hospitalists: a systematic review of the literature. Pediatrics. 2006;117:1736–44. doi: 10.1542/peds.2005-0609. [DOI] [PubMed] [Google Scholar]
- 21.Ayanian JZ, Landrum MB, Guadagnoli E, Gaccione P. Specialty of ambulatory care physicians and mortality among elderly patients after myocardial infarction. N Engl J Med. 2002;347:1678–86. doi: 10.1056/NEJMsa020080. [DOI] [PubMed] [Google Scholar]
- 22.Keating NL, Landrum MB, Ayanian JZ, Winer EP, Guadagnoli E. The association of ambulatory care with breast cancer stage at diagnosis among Medicare beneficiaries. J Gen Intern Med. 2005;20:38–44. doi: 10.1111/j.1525-1497.2004.40079.x. [DOI] [PMC free article] [PubMed] [Google Scholar]
- 23.Snyder CF, Earle CC, Herbert RJ, Neville BA, Blackford AL, Frick KD. Trends in follow-up and preventive care for colorectal cancer survivors. J Gen Intern Med. 2008;23:254–9. doi: 10.1007/s11606-007-0497-5. [DOI] [PMC free article] [PubMed] [Google Scholar]
- 24.Baldwin LM, Adamache W, Klabunde CN, Kenward K, Dahlman C, Warren JL. Linking physician characteristics and Medicare claims data: issues in data availability, quality, and measurement. Med Care. 2002;40(Suppl):IV-82–IV-95. doi: 10.1097/00005650-200208001-00012. [DOI] [PubMed] [Google Scholar]
- 25.Vansaghi LM, Stites SW, Pingleton SK, Turner S, Hansen C. Evolution of an academic hospitalist program: clinical, educational, and financial value. Am J Med. 2008;121:349–54. doi: 10.1016/j.amjmed.2007.11.019. [DOI] [PubMed] [Google Scholar]
- 26.Lackan NA, Ostir GV, Freeman JL, Mahnken JD, Goodwin JS. Decreasing variation in the use of hospice among older adults with breast, colorectal, lung, and prostate cancer. Med Care. 2004;42:116–22. doi: 10.1097/01.mlr.0000108765.86294.1b. [DOI] [PubMed] [Google Scholar]
- 27.Greer AL. The state of the art versus the state of the science: the diffusion of new medical technologies into practice. Int J Technol Assess Health Care. 1988;4:5–26. doi: 10.1017/s0266462300003202. [DOI] [PubMed] [Google Scholar]