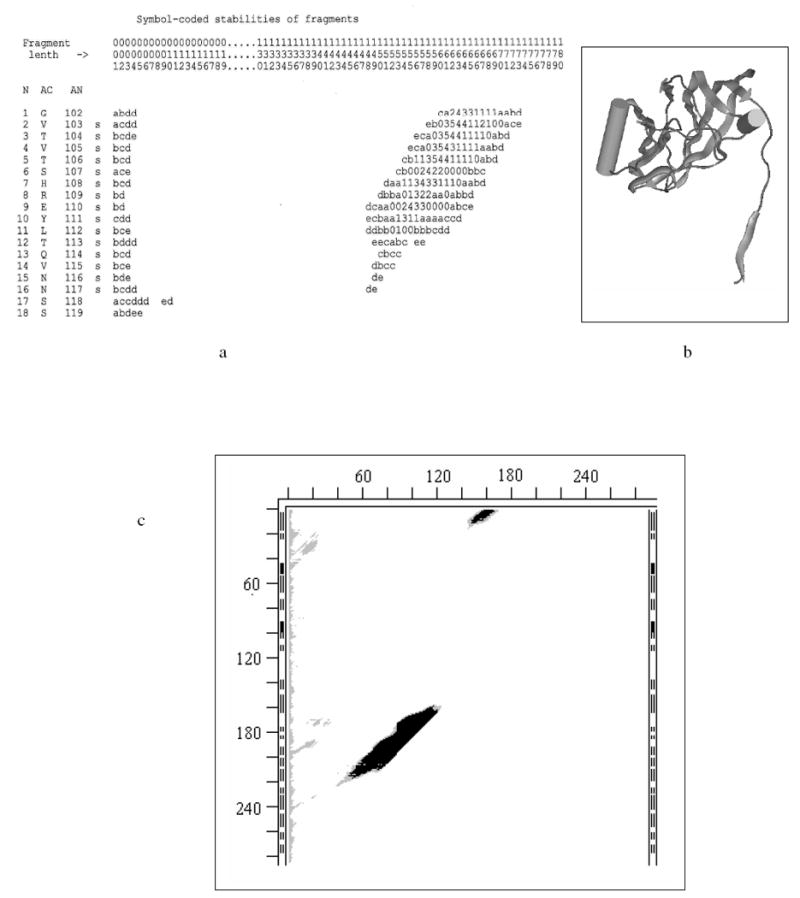
Fig. 3.

- Stability Map (SM) for 180 N-terminal residues of subunit A of 2tbv (large parts of SM that do not contain stable fragments are omitted for figure’s compactness); location of continuous fragments in the chain are uniquely defined by two perpendicular axes: fragment’s length (L) (horizontal), and position (N) of the fragment’s first residue relative to the N-terminus of the entire chain/molecule (vertical on extreme left); the matrix elements of SM are fragments’ stabilities (rounded to the nearest integer) represented by one character symbols: e.g., 1, 2, … 9, “-” denote ‘stable’ ΔG of -1, -2, …-9, -10 kcal/mol; capital letters A, B, C, D, etc, denote ‘stable’ ΔG of -11, -12, -13, -14, etc. kcal/mol; 0 denotes ΔG of 0 kcal/mol (the fragment spends half time in its x-ray fold and half in an unfolded state); lower case letters a, b, c, d, e, etc, denote positive ΔG of +1, +2, +3, +4, +5, etc kcal/mol; white spaces denote instabilities above the cutoff value (here – above 5 kcal/mol); horizontal coordinate axis “Fragment length” (L) is marked by columns of three numbers (to be read vertically to save on SM sizes); dots in the L-axis markings indicate that a vertical strip of the full SM is omitted (there are no stable fragments of omitted lengths); three columns to the right of the N-axis markings are: AC – one letter residue codes, AN – the residue numbering of the chain accepted in the PDB file, and the last one shows whether the residue in the X-ray structure is in β-strand (s), helix (H) or coil (white space).
- Ribbon diagram of the X-ray structure of the same 180 residues (MOLE CD and manual are available from G.P. Privalov, gpriv@axonx.com – wire molecular images in this paper are also made with MOLE.).
- Bitmap SM for all continuous fragments in 2tbvA; the ticks (distance between them is 20 residues) notations on the left of the SM are the same as in Fig. 1 and mark position of fragment’s beginning (N-terminus) in the entire sequence; ticks on the top of the SM measure the length of the fragment from its N-terminus; black areas in the SM correspond to negative ΔG (stable), grey areas denote marginal stabilities (0 kcal/mol to +5 kcal/mol), white areas indicate instabilities with a cutoff ΔG > +5 kcal/mol (larger cutoffs are sometimes used for more reliable estimates in the text and Table 3.)
For the rest, see Table 1 and the figure legends.
