Abstract
Context:
Outcomes assessment is an integral part of ensuring quality in athletic training, but few generic instruments have been specifically designed to measure disablement in the physically active.
Objective:
To assess the psychometric properties of the Disablement in the Physically Active Scale (DPA), a patient-report, generic outcomes instrument.
Design:
Observational study.
Setting:
We collected data in 5 settings with competitive and recreational athletes. Participants entered into the study at 3 distinct points: (1) when healthy and (2) after an acute injury, or (3) after a persistent injury.
Patients or Other Participants:
Measures were obtained from 368 baseline participants (202 females, 166 males; age = 20.1 ± 3.8 years), 54 persistent participants (32 females, 22 males; age = 22.0 ± 8.3 years), and 28 acutely injured participants (8 females, 20 males; age = 19.8 ± 1.90 years).
Main Outcome Measure(s):
We assessed internal consistency with a Cronbach α and test-retest reliability with intraclass correlation (2,1) values. The scale's factor structure was assessed with a hierarchical confirmatory factor analysis. Concurrent validity was assessed with a Pearson correlation. Responsiveness was calculated using a receiver operating characteristic curve and a minimal clinically important difference value.
Results:
The Cronbach α scores for the DPA were 0.908 and 0.890 in acute and persistent groups, respectively. The intraclass correlation (2,1) value of the DPA was 0.943 (95% confidence interval = 0.885, 0.972). The fit indices values were 1.89, 0.852, 0.924, 0.937, and 0.085 (90% confidence interval = 0.066, 0.103) for the minimum sample discrepancy divided by degrees of freedom, goodness-of-fit index, Tucker-Lewis Index, comparative fit index, and root mean square error of approximation, respectively. The DPA scores accounted for 51% to 56.4% of the variation in global functioning scores. The area under the curve was statistically significant, and the minimally clinically important difference values were established.
Conclusions:
The DPA is a reliable, valid, and responsive instrument.
Keywords: injuries, evaluation, measurement
Key Points
The Disablement in the Physically Active scale is a new generic, patient-report outcomes instrument designed for the physically active.
Analysis of the psychometric properties of the scale indicates that it is a reliable, valid, and responsive instrument that can be useful in the evaluation of physically active participants with musculoskeletal injuries.
Regular evaluation of patient outcomes during the treatment process is an integral part of measuring treatment success. Outcomes are the result of an intervention and are part of a quality assurance framework first described by Donabedian.1–3 As the business adage “You manage what you measure” indicates, outcomes assessment affords a clinician the benefit of daily scrutiny of treatment practices.4,5 In essence, by measuring outcomes, clinicians can assess the effectiveness of their practice patterns or habits. Outcomes also serve a broader function in athletic training by documenting the value of certified athletic trainers in a range of settings.
Outcomes assessment can take a variety of forms. In health fields, outcomes are commonly assessed through clinician-report and patient-report instruments.6–9 An outcomes instrument can measure a single construct, such as pain, or it can measure a wider set of constructs, such as activities of daily living and function. Instruments that examine multiple constructs are known as multidimensional instruments. A high-quality multidimensional outcomes instrument is typically rooted in a disablement paradigm, which provides the structure for the values being placed on the measurement constructs.8,10–12 To attain a full picture of a patient's injury status, clinicians are encouraged to measure disablement using both patient and clinician reports.
Outcomes instruments are categorized as disease-specific, region-specific, and generic instruments. Disease-specific outcomes instruments, such as the Western Ontario and McMaster Universities (WOMAC) Index of Osteoarthritis,13 are designed to measure a specific condition or injury type, whereas region-specific tools, such as the Disabilities of the Arm, Shoulder and Hand (DASH),14 are instruments created to measure a variety of injuries to the upper extremity. Disease-specific and region-specific outcomes instruments can be clinician reported or patient reported or a combination of these 2 types. Generic outcomes tools are specific neither to an injury nor to a region in the body. Instead, generic tools have been developed to measure general disablement and health-related quality-of-life (HRQOL) constructs. Generic instruments are strictly patient-report tools that provide the patient with an opportunity to describe difficulties with function, disability, and HRQOL associated with injury. The subjective nature of patient-report instruments has led clinicians to believe that they are considered unreliable, but studies15–17 in physical medicine have shown patient-report tools to be reliable and predictive of disablement. Ideally, athletic trainers would use both patient-report and clinician-report tools to provide the clinician with the information with which to judge the value of an intervention and a patient's progress.
However, the most commonly used generic outcomes instrument, the Short Form 36 (SF-36), is not without problems. The SF-36 and its abbreviated version, the Short Form 12, provide only general information regarding a patient's health and were not designed to measure the specific problems of a physically active population after musculoskeletal injury.18–20 An important consideration during the construction of an outcomes instrument is identifying the patient population, which means that the instrument should measure constructs that are meaningful for the patient.21 Athletic trainers work with physically active patients whose expectations for activity participation may differ from those of patients from a sedentary population. A study20 performed on athletes demonstrated a difference at baseline and after injury in the domains of the SF-36 when compared with normative values. In addition, authors19,22–24 who have investigated the use of the SF-36 in orthopaedics demonstrated that the instrument displayed floor or ceiling effects. Because of these limitations, a generic instrument that measures constructs of disablement and HRQOL and is specific to a physically active population should be developed and tested for appropriate psychometric properties, including reliability, validity, and responsiveness.9,25–27
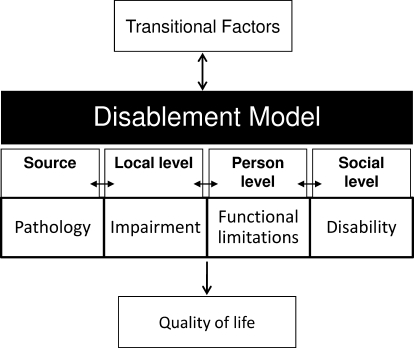
The purpose of our study was to establish the standard values and to evaluate the psychometric properties of a new generic, patient-report outcomes instrument created for the physically active. The Disablement in the Physically Active (DPA) scale is derived from a disablement framework that includes measures of impairments (IMPs), functional limitations (FLs), and disability (DIS). In addition, the scale includes questions regarding HRQOL (Figure 1).28,29 For the psychometric analysis, we used classic test theory by assessing reliability, validity, sensitivity to change, and responsiveness. Additionally, modern measurement methods were used for a hierarchical confirmatory factor analysis of the measurement model.
Figure 1.
Disablement framework from which the Disablement in the Physically Active Scale was derived.
METHODS
Instruments
The DPA Scale. The DPA is a multidimensional, patient-report scale that is rooted in both current disablement and HRQOL paradigms.21,28–36 The scale includes questions designed to assess disablement across 3 interrelated domains: IMP, FL, and DIS.10,28 Additionally, an HRQOL domain, quality of life, was added to the scale to measure the psychosocial effects of injury on the patient. The terminology used to describe the disablement domains has also been used by a number of models in the field of physical medicine.34 The HRQOL models generally include symptom status, functional status, health perceptions, and overall quality of life. The latter is influenced by values preferences and social and psychological supports. To avoid redundancy with disablement components that measure symptoms and function, the last element in the conceptual framework, overall quality of life, was the focus of the last domain of the DPA.30,31
The instrument items were created from our previous study, which consisted of mixed methods and was performed on 31 participants (17 females, 14 males; mean age = 21.2 years [range, 14–53 years]; 18 lower extremity injuries, 13 upper extremity injuries) from competitive and recreational settings to describe the transient disablement process, as experienced by physically active people with musculoskeletal injuries. We focused on the descriptive terminology used by the participants to help to develop the themes within the disablement domains (IMP, FL, and DIS) and the HRQOL domain that ultimately became items on the DPA scale. We confirmed the model with a follow-up focus group consisting of 6 participants (3 females, 3 males; mean age = 22.2 years [range, 16–28 years]).37
A copy of the scale is provided in Figure 5 of the Vela and Denegar37 article entitled “Transient disablement in the physically active with musculoskeletal injuries, part I: a descriptive model”.37 Scale responses are based on an adjectival scale that ranges from 1 to 5, where 1 indicates that a patient does not have a problem with the listed item and 5 indicates that a patient is severely affected by the problem. Each item and domain on the DPA is weighted equally, and 16 points are subtracted from the final tally, so that the DPA is scored from 0 (floor) to 64 (ceiling). The 16 points are subtracted because the scale uses a 1 through 5 interval to rate each item. Thus, a patient with no disablement would still score 16 points on the scale. A higher score on the DPA indicates a higher level of disablement. Before this study, an expert panel with experience in outcomes assessment and instrument creation reviewed the DPA scale for its item content relevance using methods described by Dunn et al38 and developed by Aiken.39 Each of the 7 judges rated the applicability of each DPA scale item to the 4 domains using a 1 through 5 scale. A rating of 1 represented a poor match, whereas a rating of 5 represented an excellent match. For example, the first item on the scale, pain, was assessed with regard to its fit as an IMP, FL, DIS, and HRQOL measure using a 1 through 5 scale. A validity coefficient (V) was calculated from the responses given by each judge for each item on all 4 domains to test the statistical significance of the ratings for the construct. Calculating the V coefficient is a 3-step process. First, each rater's scores were converted into a validity rating (s = r − lo), where r equals the judge's rating for each of the 16 items for each of the 4 domains and lo equals the lowest possible fit value (1 in this case). The next step was to sum the ratings of all 7 judges to produce S. Finally, the V coefficient is calculated by V = S/(n [c − 1]) (for n judges and c successive integers on the rating scale).
Figure 5.
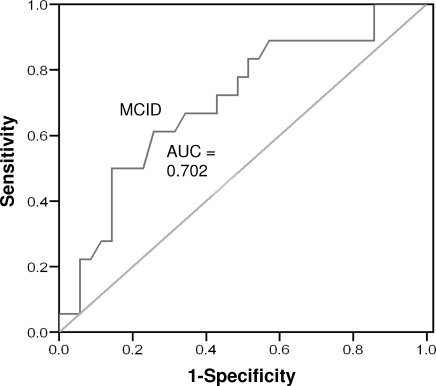
Receiver operating curve for persistent participants, week 3. Abbreviations: AUC, area under the curve; MCID, minimal clinically important difference.
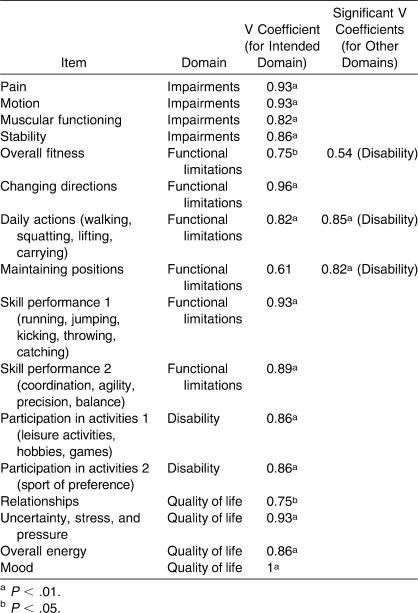
The item content relevance analysis revealed that all but 1 item had a coefficient greater than 0.75, indicating relationships between the item and the “excellent-match” rating. An item content relevance analysis with 7 judges should yield a V coefficient equal to or above 0.75 to be statistically significant. This value was taken from a right-tailed binomial probability table provided by Aiken.39 After analyzing the other domain areas, we found that the expert panel established 2 items as better matches in other domain areas (Table 1). The judges considered daily actions and maintaining positions to be better disability measures than functional limitations.
Table 1.
Item Content Relevance V Coefficient Analysis
The DPA was modified slightly based on the results of the item content relevance analysis. The question regarding fitness was reworded to ask about the problems a patient would have with activities performed to maintain fitness, such as cardiovascular training and weight lifting, rather than asking about the patient's actual fitness level. This slight modification made the fitness item a better measure of disability than was the functional-limitation measurement. Maintaining positions was kept as a functional limitation rather than a disability because it is considered an action (functional limitation) and not an activity (disability).10 Follow-up testing was not performed with the expert panel, but modifications were completed based on feedback from the expert panel and discussion between the authors.
Global Functioning
Global functioning (GF) is a single item that is a 10-cm line anchored by a number at each end of the line.40 The left side of the scale is labeled with 0%, whereas the right side is labeled with 100%. Participants marked a perpendicular line along the scale that represented their current level of functioning as compared with their normal function level. Participants were asked to complete a GF scale every time the DPA was completed.
Global Rating of Change
The global rating of change (GRC) is a retrospective, patient-report, 15-point rating scale in which the participant reports the degree of perceived change in status. The GRC wording was slightly modified in this study to ask the participant to rate the change in injury status. The GRC scale has been used and validated in previous studies25,41–44 to establish whether a participant has experienced clinically meaningful change over time. Because the scale is reported by the patient, it is typically considered to be the external criterion, or “gold standard,” for actual change. The participant was first asked if there had been a change in injury status since the time he or she entered the study. The participant then rated the amount of perceived change on either a positive 1 through 7 scale or a negative 1 through 7 scale. A clinically significant change can be positive or negative, and a change to +4 or greater or −4 or less has been used in a previous study41 to signify a clinically significant change. Participants who reported a rating between +3 and −3 were placed in the stable group.
Participants
All participants completed an informed consent approved by the institutional review board before volunteering for this study. Data were collected from physically active competitive or recreational athletes from 5 sites, including National Collegiate Athletic Association Division I and Division III athletics programs, a large high school interscholastic athletics program, an intramurals program at a large university, and a large outpatient orthopaedic center.
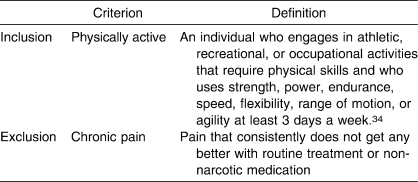
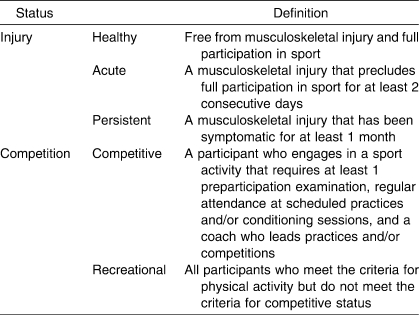
Participants entered the study at 3 distinct points in order to allow for instrument analysis on both healthy and injured volunteers: (1) at baseline, to establish normative values in healthy participants; (2) when identified as having a persistent injury at baseline, for further analysis in the persistent injury group; and (3) after an acute injury, as identified by an athletic trainer or physician. Injured participants were stratified as having experienced an acute or persistent injury in order to test for differences between these groups. We used the definitions in Tables 2 and 3 for inclusion into the study as well as for injury-stratification purposes. Participants who reported chronic pain were excluded from the study because chronic pain does not behave in predictable patterns.45
Table 2.
Inclusion and Exclusion Criteria Definitions
Table 3.
Participant Stratification Definitions
A total of 388 people volunteered for the baseline portion of this study that would allow us to establish standard values in healthy individuals and from whom participants with existing, persistent musculoskeletal injuries would be recruited for further investigation. Twenty participants were excluded for not meeting the physical activity requirement or for reporting that they suffered from chronic pain. A total of 368 participants (202 females, 166 males; 281 competitive, 87 recreational; age = 20.1 ± 3.8 years) were included at baseline, and their data were used to establish standard values for the DPA. Of the participants who completed baseline data, 271 (153 females, 118 males; 210 competitive, 61 recreational; age = 19.7 ± 2.0 years) reported that they were injury free, whereas 97 (49 females, 48 males; 71 competitive, 26 recreational; age = 21.1 ± 6.4 years) had an existing musculoskeletal injury. Of the 97 participants with existing musculoskeletal injuries, 43 (30 persistent, 13 acute) either had an injury that did not meet the persistent injury criteria or chose not to continue in the study.
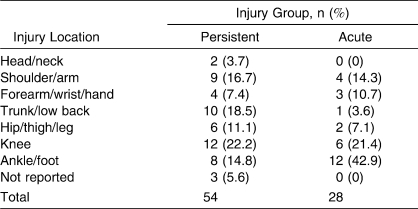
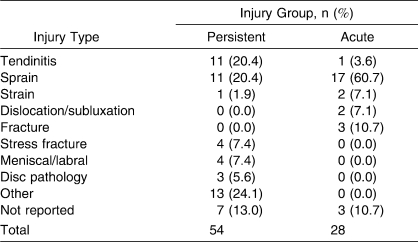
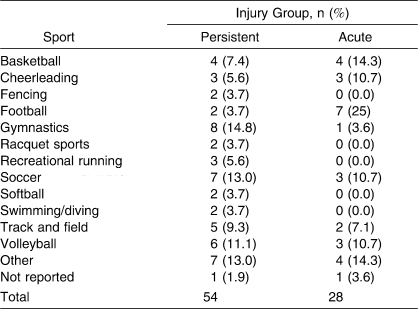
A total of 54 participants (32 females, 22 males; 40 competitive, 14 recreational; 30 collegiate, 9 high school, 15 recreational athletes; age = 22.0 ± 8.3 years) chose to continue to participate in the study from the baseline data after being identified as having persistent symptoms, and they were placed in the persistent-injury group. The 28 individuals (8 females, 20 males; 22 competitive, 6 recreational; 18 collegiate, 4 high school, 6 recreational athletes; age = 19.8 ± 1.90 years) who participated in the study were identified separately from the baseline participants by an athletic trainer, physician, or physical therapist as having an acute injury and agreed to participate in the study. Tables 4 through 7 show demographics based on injury location, type, sport, and days lost from full physical activity, as reported by the participants. Test-retest reliability was calculated in 31 participants with persistent injuries (15 females, 16 males; 21 recreational, 10 competitive; age = 23.4 ± 9.2 years).
Table 4.
Injury Locations for Acute and Persistent Injury Participants
Table 5.
Injury Group by Type of Injury
Table 6.
Injury Group by Sport
Table 7.
Number of Days to Return to Full Activity: Acute-Injury Group
Protocol
Upon entry into the study, participants provided demographic information to ensure they met the inclusion criteria for the study. All volunteers completed the same set of study packets that included a question regarding their participation status as well as the DPA and GF scales. Healthy participants completed the study packet once upon entry into the study. We administered study packets to participants with acute injuries on 4 occasions. The first administration occurred on day 1, or within 24 hours of the initial injury. The participants also completed study packets plus the GRC scale on day 3 and day 7 postinjury. The last study packet was completed upon return to full participation, as determined by the athletic trainer or physician, and included the GRC scale. The days on which data were collected were chosen based on effect sizes from a previous investigator,46 who examined the psychometric properties of another patient-report outcome tool. Participants with persistent injuries were asked to complete a study packet upon entry into the study at baseline as well as at 3 and 6 weeks. The GRC scale was also completed at 3 and 6 weeks of participation. This time frame was chosen because patients with persistent injuries are typically slow to demonstrate change; an extended time frame was necessary to capture change, if it occurred at all. Other groups41,47,48 who have examined the psychometric properties of an instrument with a chronically injured population have used similar time periods. Because treatment effectiveness was not relevant to this study, treatment protocols were not controlled or monitored in participants with acute and persistent injuries.
Statistical Analysis
Data analyses were performed using SPSS (version 13.0; SPSS Inc, Chicago, IL) and Analysis of Moment Structure (version 17.0; SPSS Inc) programs. We treated missing values for interval data in the DPA and GF scales conservatively and replaced them with the mean values for each variable in each respective data set (baseline, acute, and persistent) if fewer than 5% of the total values for each variable were missing. In no cases did the missing data exceed the 5% threshold for any single item on the DPA or the GF.9 Any missing nominal data were left as missing values.
Reliability
We performed a reliability analysis to assess the test-retest reliability and internal consistency of the DPA. We assessed the internal consistency of the DPA instrument by calculating a Cronbach α for the combined scale items in participants with acute and persistent injuries. We also calculated the item-total correlation to assess the correlation of each item with the total score if the scale item was omitted. An item-total threshold of 0.20 was used to drop items from the scale.9 Internal consistency was evaluated at day 1 for the acutely injured participants and at baseline for the participants who were in the persistent group.
Test-retest reliability was established by calculating intraclass correlation coefficient (2,1) values for 2 separate test administrations.49 We asked each participant to complete the scale at the time of entry into the study. The scale was then completed 24 ± 2 hours later. A 24-hour period was designated as the appropriate time frame to avoid any significant change in a participant's injury status. To avoid answer recall, the items were presented in a different order on the second scale administration.
Scale Structure
We used all injured participants' DPA scores from the first administration to assess the scale structure. For the analysis, we used data from the 43 participants at baseline who reported injury but did not participate further in the study, the 54 persistently injured participants, and the 28 participants after acute injury (n = 125). We performed tests for univariate and multivariate normality before assessing the 4-factor structure using confirmatory factor analysis with the Analysis of Moment Structure program and the maximum likelihood estimation procedures. In addition, we performed a hierarchical confirmatory factor analysis that grouped the disablement factors separately from the HRQOL factor. Several fit indices were used as indicators for the goodness of fit of the measurement model. Fit indices used were the minimum sample discrepancy divided by degrees of freedom (CMIN/DF), goodness-of-fit index (GFI), Tucker-Lewis Index (TLI), comparative fit index (CFI), and root mean square error of approximation (RMSEA). The CMIN/DF values should be smaller than 3.0, whereas the GFI, TLI, and CFI have values ranging from 0 to 1, with values above 0.90 indicating a good fit of the empirical data to the model. The RMSEA provides values that represent the goodness of fit of the model if it was estimated in the population. Acceptable RMSEA values range between 0.05 and 0.08, with lower values indicating a closer model fit. Path analyses were completed on hierarchical confirmatory factor analysis with standardized regression weights and factor group correlations reported.
Validity
We assessed the concurrent validity of the DPA by comparing all DPA scores with GF scores in participants with acute and persistent injuries using a 2-tailed Pearson correlation. Participants with acute injuries (n = 28) completed the DPA and GF on 4 separate occasions, totaling 112 data points, whereas participants with persistent injuries (n = 54) completed the instruments on 3 occasions, thereby providing 162 data points.
Responsiveness
We calculated the DPA's responsiveness with 2 methods that required creating a receiver operating characteristic (ROC) curve for acute and persistent injury data.9,50 Both the GRC scores (obtained on days 3 and 7 and upon return for acute participants and at weeks 3 and 6 for persistent participants) and DPA scores were used to calculate the plots for the ROC curve. Participants who reported having a GRC score of 4 or greater were considered to have undergone a clinically significant change, whereas those who had not undergone a clinically significant change were classified as the stable group (GRC scores between 3 and −3).41–43 Placing participants into 2 groups essentially created a dichotomous scale that distinguished if an individual had experienced a desired outcome. Change scores were calculated by subtracting the total DPA score from one administration to the next. For example, DPA scores on day 1 were subtracted from DPA scores on day 3 in participants with acute injuries. The same occurred between scores on days 3 and 7 and day 7 scores and return scores for participants with acute injuries. In participants with persistent injuries, the baseline and week 3 scores as well as the week 3 and week 6 scores were subtracted to determine change scores. Sensitivity and specificity values were then calculated for every point of change on the DPA scale based on the number of participants classified as having experienced a clinically significant change versus those classified as being stable.
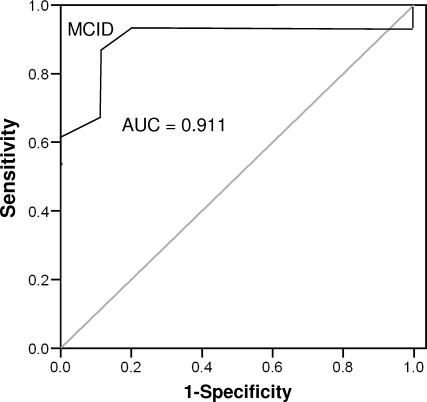
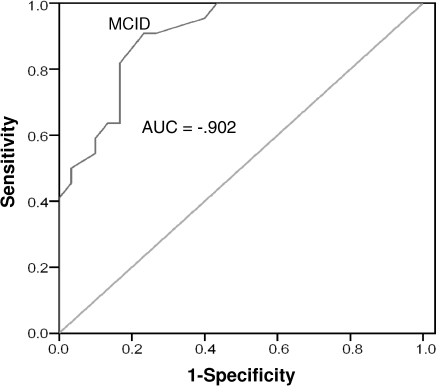
Each point change was then used to plot an ROC curve in which the Y-axis represented the sensitivity values and the X-axis represented 1 − specificity values. An optimal test or measure should create a curvilinear plot that extends above a diagonal line from the lower left-hand corner to the upper right-hand corner. The area under the curve (AUC) is termed D′ and tests the “goodness” of a test. Essentially, the AUC value indicates the ability of a test to correctly discriminate between the participants who had a meaningful change versus the participants who remained stable. An AUC value close to 1.00 indicates a test with perfect discrimination, whereas a value of 0.50 indicates a meaningless test that provides results that are no better than chance. Three ROC curves were calculated for participants with acute injuries, and 2 curves were calculated for participants with persistent injuries.
We determined the minimal clinically important difference (MCID) value by choosing the point on the ROC curve nearest the upper left-hand corner.9,50 This point represents the smallest overall error rate, whereas a move to the right of that point increases sensitivity but decreases specificity. The MCID value was confirmed with the coordinates of the curve data provided by SPSS. The MCID represents the change value on the DPA scale that indicates that the participant has undergone a significant important change, as perceived by the patient.
RESULTS
Standard Values
Standard DPA values in healthy and injured participants are shown in Table 8. No administration of the DPA resulted in more than 10% of the participants reporting a score of either 0 or 64, indicating that no floor or ceiling effects occurred.
Table 8.
Disability in the Physically Active Scale Values in Participants at Baseline and With Injury
Reliability
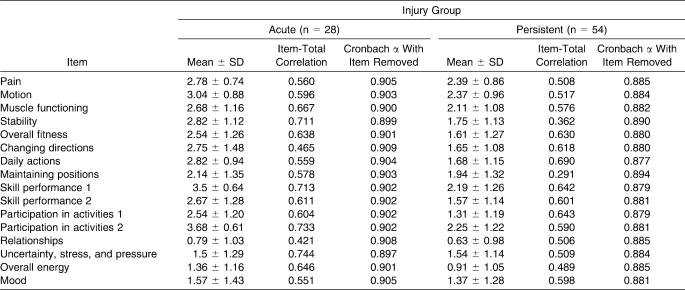
The Cronbach α score of the overall DPA instrument in injured participants 1 day after injury (n = 28) was 0.908. All items in the scale demonstrated an item-total correlation above 0.20, indicating that it should not be removed. The Cronbach α for the baseline scores in participants with persistent injuries (n = 54) was 0.890. All items in this scale also demonstrated an item-total correlation above 0.20. Table 9 illustrates the results for internal consistency in participants with acute and persistent injuries. The intraclass correlation coefficient for injured participants (n = 31) was 0.943 (95% confidence interval = 0.885, 0.972).
Table 9.
Participants' Internal-Consistency Values
Scale Structure
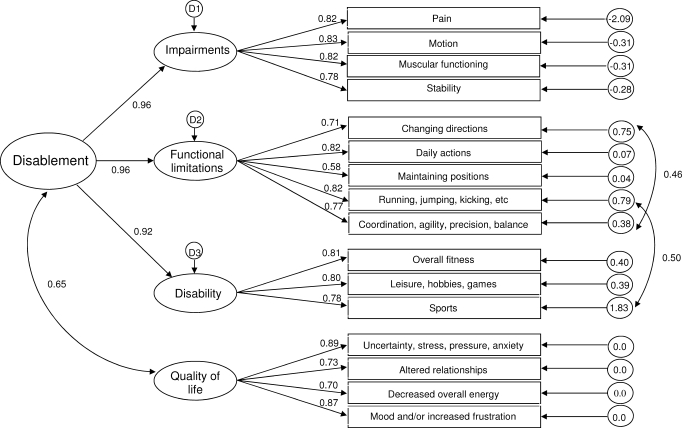
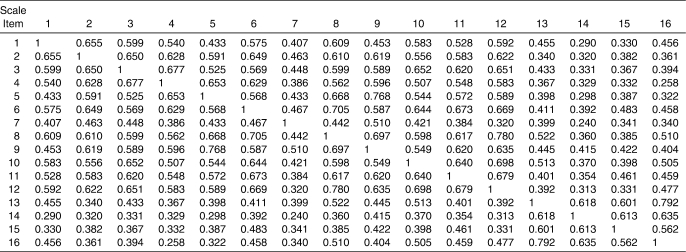
Initial evaluation of the 4-factor structure of the DPA revealed that the 3 disablement components (IMP, FL, and DIS) were highly interrelated. The correlations between IMP and FL, FL and DIS, and IMP and DIS resulted in values above 0.90 in a confirmatory factor analysis. Therefore, a hierarchical confirmatory factor analysis rather than a confirmatory factor analysis was used to determine the fit of the scale structure. The path analysis (Figure 2) shows the structure model created for the DPA, including the standardized path coefficients and the standardized residual covariance values, on the right-hand side of the path model. The interitem correlation matrix is provided in Table 10. The disablement components were combined to create an exogenous variable labeled Disablement, whereas HRQOL was freed to co-vary with the Disablement variable. The modification indices revealed that on 2 occasions the model could be improved if the error measurements between E5 and E9 and E8 and E12 were freed to co-vary. In both cases, the modification indices were greater than 17.0. The fit indices value for the CMIN/DF was 1.89, for GFI it was 0.852, for TLI it was 0.924, for CFI it was 0.937, and for RMSEA it was 0.085 (90% confidence interval = 0.066, 0.103). The CMIN/DF was below 3.0, and the 2 indices (TLI and CFI) were above the recommended 0.90 level, whereas the GFI closely approached the desired 0.90. The RMSEA was at the upper limits of the 0.050 to 0.080 range.
Figure 2.
Path specification of hierarchical confirmatory factor analysis with loadings.
Table 10.
Interitem Correlation Matrix
Validity
An inverse relationship was noted between individual DPA and GF scores in participants with acute injuries (r = −0.751, P < .001), with the DPA score accounting for 56.4% of the variation in the GF score. The DPA and GF scores in participants with persistent injuries also demonstrated an inverse relationship (r = −0.714, P < .001), with the DPA score accounting for 51% of the variation in GF score.
Responsiveness
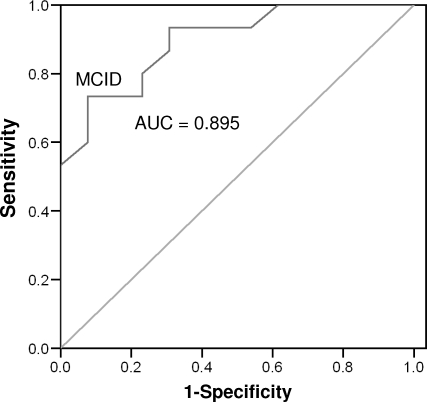
Fifteen participants (53.6%) with acute injuries reported experiencing a clinically significant change by day 3 after injury. The number increased to 18 participants (64.3%) at day 7 and to all participants (100%) upon return to full participation. The AUC values constructed for participants with acute injuries ranged between 0.895 (95% confidence interval = 0.78, 1.00; P < .001) and 0.911 (95% confidence interval = 0.79, 1.00; P < .001) for days 3 and 7, respectively (Figures 3 and 4). An ROC curve could not be plotted for participants upon return to full participation because all had experienced a clinically significant change. The MCID value calculated for the ROC curve on day 3 was 8.225 points (sensitivity = 0.733, 95% confidence interval = 0.619, 0.847; 1 − specificity = 0.077, 95% confidence interval = 0.00, 0.191), whereas for day 7, it was 8.5 points (sensitivity = 0.889, 95% confidence interval = 0.767, 1.00; 1 − specificity = 0.100, 95% confidence interval = 0, 0.222). The 2 values were averaged and rounded up to create a conservative MCID value of 9 points in participants with persistent injuries.
Figure 3.
Receiver operating curve for acute participants, day 3. Abbreviations: AUC, area under the curve; MCID, minimal clinically important difference.
Figure 4.
Receiver operating curve for acute participants, day 7. Abbreviations: AUC, area under the curve; MCID, minimal clinically important difference.
Of the participants with persistent injuries, 18 (33.9%) reported experiencing a clinically significant change between baseline and week 3. At week 6, 22 participants (42.3%) reported experiencing a clinically significant change. The AUC was 0.702 (95% confidence interval = 0.55, 0.85; P = .017) at week 3 and 0.902 (95% confidence interval = 0.82, 0.98; P < .001) at week 6 (Figures 5 and 6). The MCID values for weeks 3 and 6 were 5.50 (sensitivity = 0.611, 95% confidence interval = 0.46, 0.76; 1 − specificity = 0.257, 95% confidence interval = 0.108, 0.406) and 4.62 (sensitivity = 0.909, 95% confidence interval = 0.831, 0.987; 1 − specificity = 0.233, 95% confidence interval = 0.155, 0.311), respectively. The 2 values were averaged and rounded up to create a conservative MCID value of 6 points in participants with acute injuries.
Figure 6.
Receiver operating curve for persistent participants, week 6. Abbreviations: AUC, area under the curve; MCID, minimal clinically important difference.
DISCUSSION
The purpose of our study was to establish the standard values and to evaluate the psychometric properties of a new, generic, patient-report outcomes instrument created for the physically active. For the psychometric analysis, we used classic test theory by assessing reliability, validity, and responsiveness. Additionally, modern measurement methods were used for a hierarchical confirmatory factor analysis of the measurement model.
Much of the research regarding outcomes literature discusses the importance of using and creating an outcomes tool based on a theoretical paradigm. Biopsychosocial disablement paradigms, such as those used by the Institute of Medicine (IOM), the National Center for Medical Rehabilitation and Research, and the World Health Organization (WHO), detail the interrelated but discrete events in disablement. Most paradigms have similar constructs but have semantic differences in terms of how the constructs are described.51 We used an older model described by the IOM as the theoretical basis for the disablement constructs used in the DPA scale. More recently, several fields, including physical therapy, have made a general shift toward the model proposed by the WHO. We do not feel that the use of the IOM model has created potential flaws in the DPA. In fact, a limitation of the current WHO model is that its distinction between 2 of the latter components (FL and DIS) is slightly blurred when compared with the IOM model.34 Nonetheless, the DPA measures multiple disablement constructs, which is an important feature of a multidimensional instrument, both theoretically and practically. The measurement of multiple disablement constructs has been examined in a variety of studies in sports medicine. Many authors10,11,15–17,28,52,53 highlight the fact that to fully assess the effects of disablement, it must be measured along multiple constructs, including impairments, functional limitations, and disability. Including HRQOL in the scale was important to understanding the effects of disablement on patients. We feel that quality of life is a particularly salient dimension to measure in the DPA because disability has been described as a limitation in a sociocultural environment, but this effect is not directly measured in the IMP, FL, or DIS components. Therefore, to add a focus on patient values and expectations, we added a quality-of-life domain to the scale.
Standard Values
Regarding floor and ceiling effects, the accepted standard9 is that no more than 10% of participants should have a floor or ceiling score. Floor effects did not occur in the acute or persistent injury groups at any time point, as expected, because the DPA was created with a response set designed to avoid such a problem. The DPA provides a response that allows participants with subtle problems to be identified rather than making a broad jump between no problem and the problem slightly affects me.
Reliability
Test-retest reliability assesses the reliability of a participant's responses when the same instrument is administered on 2 separate occasions, whereas internal consistency assesses the consistency of the items within a scale. An acceptable Cronbach α is between 0.70 and 0.90; a score higher than 0.90 indicates that the scale is too homogeneous and may only measure a single construct.9 An item-total correlation score of less than 0.20 indicates that the item should be dropped from the scale.9
The Cronbach α value for the internal consistency of the DPA in participants with acute injuries was 0.908. This value only slightly exceeds the value suggested for adequate internal consistency. Upon examining the item-total correlation, no item fell below 0.20, which indicates that if the item was dropped, relationships among the other items would not be significantly altered. However, if 2 items on the scale were dropped, the α score would dip to slightly below 0.90. The α value declined to 0.897 if the item uncertainty was dropped from the scale. The drop was even smaller when the item stability was removed, changing the score to 0.899. Neither decrease was large enough to warrant dropping the items from the scale. The Cronbach α of the DPA in participants with persistent injuries fell within the acceptable range, at 0.890. All item-total correlations were above 0.20, so no items were dropped from the scale.
The DPA's test-retest intraclass correlation coefficient values were above 0.75, which indicates excellent test-retest reliability according to the values set forth by Shrout and Fleiss.49,54 The test and retest administrations of the DPA in this study occurred within a 24-hour period. Some sources9,55 maintain that test-retest reliability administrations should be separated by approximately 1 week to reduce a participant's recollection of previous answers. Other authors56,57 have shortened the period between administrations, with mean intervals ranging from 24 hours to 2 weeks. We decided to use a 24-hour period for 2 reasons: (1) because the injured participants did not change significantly over time and (2) in order to maximize participants' willingness to complete the scale.
Scale Structure
The DPA was created using the theoretical constructs from disablement and HRQOL theory. The hierarchical structure was used for 2 reasons: (1) the disablement structures should be separated from HRQOL, and (2) the correlations between the disablement constructs (IMP, FL, and DIS) warranted an alternate structure rather than a traditional confirmatory factor analysis. We feel that the interrelatedness of the disablement domains strengthens the scale and is not a weakness. In his seminal work, Nagi28 proposed that disablement constructs are interrelated yet distinct components giving unique information about the disablement process, as experienced by a patient. Theoretically, the relationships among these components are cyclical in nature, meaning that changes in one component can have a feed-forward or feed-backward effect. For example, a change in muscle tone (IMP) may lead to problems with squatting (FL), which may in turn lead to overcompensatory actions, which then result in more pain (IMP). Therefore, each construct is important to measure, even if the constructs are highly related.
The DPA met several requirements for fit indices in the hierarchical confirmatory factor analysis. We modified the model using the index cut-off point of 17. Each change was made separately, and the changes to the fit indices were examined after the errors associated with the items changing directions and skill performance 2 were freed to co-vary (E5 and E9). The same occurred after skill performance 1 and activity 2 errors were freed to co-vary (E8 and E12). We believe that the modifications are theoretically sound because the inability to change directions affects the ability to perform skills with coordination, agility, precision, and balance (modification 1). Additionally, we felt that a change in the ability to perform basic skills in sport would affect participation in sport (modification 2).
Validity
Criterion validity has 2 forms: concurrent and predictive. Although concurrent validity tests an instrument against a gold standard, predictive validity is compared with a desired outcome, such as return to play. The GF scale is psychometrically sound and has been used in a number of studies18,40 to gain a broad understanding of GF in one dimension and as a gold standard to establish criterion validity.
We found a high correlation between the DPA and GF scores in participants with acute and persistent injuries. As GF scores increased, DPA scores decreased, signifying that the participants were improving over time. The correlations were significant, and DPA mean scores accounted for 51.0% and 56.4% of the variation in GF scores in the acute and persistent injury groups, respectively. More studies and, ultimately, meta-analyses are needed to further assess the validity of the DPA.
Responsiveness
We used 2 methods for determining the responsiveness of the DPA in participants with acute and persistent injuries. The first measurement, the AUC, was statistically significant in every analysis in both data sets. Large AUC values indicate that the DPA is highly capable of detecting meaningful changes in an individual's condition.25 The AUC was not calculated with the last administration of the DPA in the acute-injury group because all participants responded that they had experienced a clinically significant change, which did not provide enough data points to allow for an ROC curve to be constructed.
The second method we used to determine the DPA's responsiveness established the MCID of the DPA and was intended to help clinicians who use the DPA. Establishing MCID values is important in providing the clinician with a means of interpreting reports from individual patients. An MCID value supplies information for interpreting true clinical change in a patient, which is important if an outcomes tool is to have clinical utility. In participants with acute injuries, the MCID value of 9 points was established. Thus, if a patient with an acute injury reports a 9-point or greater change on the DPA scale, then in most cases he or she has experienced a clinically significant change. In participants with persistent injuries, the MCID value was a slightly lower 6 points. Further research is needed to determine the MCID value for the DPA in a larger sample.
LIMITATIONS
Several limitations to this study provide avenues for further work on the DPA. The study was completed on a cross section of patients, but the greatest response rate was by recreational and competitive collegiate athletes. Further investigation of the applicability of the DPA in adolescent and mature athletes may be required. Although the DPA was shown to have adequate psychometric properties, the small sample size with injured participants also warrants additional study to ensure that the DPA displays the same properties with larger samples.
CONCLUSIONS
The DPA is a reliable, valid, and responsive instrument, useful in the evaluation of physically active participants with musculoskeletal injuries. The test-retest reliability and internal consistency of the DPA were well above the norms for appropriate reliability. The DPA scores in both participant groups demonstrated a relationship with a gold standard, establishing concurrent validity. We found that the DPA was a sensitive instrument, displaying large effects between day 1 of injury and return to full participation in the acute-injury group, as well as between baseline and week 6 in the persistent-injury group. The DPA is a responsive instrument that detects when participants have undergone a significant change, and we established the clinically significant values for the DPA in participants with musculoskeletal injuries.
More research should be conducted with larger sample sizes and across diverse settings to ensure that the DPA can be used by all certified athletic trainers in all situations. In particular, a large-scale, prospective study that implements the DPA and clinician-reported outcome variables could be used to demonstrate certified athletic trainers' effectiveness in treating and rehabilitating musculoskeletal injuries in the physically active. Furthermore, the DPA can be used in research and clinical practice to assess treatment efficacy. The information garnered by using a generic, patient-report instrument created for a physically active population (eg, the DPA) adds valuable insight into the complicated puzzle of clinical decision making.
Acknowledgments
We thank Larry Price, PhD, at Texas State University for his assistance with the statistical analysis used in this manuscript.
REFERENCES
- 1.Donabedian A. The Criteria and Standards of Quality. Vol 2. Ann Arbor, MI: Health Administration Press; 1982. pp. 1–13. [Google Scholar]
- 2.Donabedian A. Quality assessment and assurance: unity of purpose, diversity of means. Inquiry. 1998;25(1):173–192. [PubMed] [Google Scholar]
- 3.Donabedian A. An Introduction to Quality Assurance in Health Care. New York, NY: Oxford University Press; 2003. pp. 45–56. [Google Scholar]
- 4.Sackett D. L., Straus S. E., Richardson W. J., Rosenberg W., Haynes R. B. Evidence-Based Medicine: How to Practice and Teach EBM. Vol 2. Edinburgh, Scotland: Churchill Livingstone; 2000. [Google Scholar]
- 5.Lowenstein R. The quality cure? The New York Times Magazine. March 13, 2005;6:46–51. [Google Scholar]
- 6.Kane R. Approaching the outcomes question. J Rehabil Outcomes Meas. 1999;3(1):50–58. [Google Scholar]
- 7.Kane R. L. Looking for physical therapy outcomes. Phys Ther. 1994;74(5):425–429. doi: 10.1093/ptj/74.5.425. [DOI] [PubMed] [Google Scholar]
- 8.Dobrzykowski E. The methodology of outcomes measurement. J Rehabil Outcomes Meas. 1997;1(1):8–17. [Google Scholar]
- 9.Streiner D. L., Norman G. R. Health Measurement Scales. 3rd ed. Oxford, United Kingdom: Oxford University Press; 2003. pp. 14–60. [Google Scholar]
- 10.Verbrugge L. M., Jette A. M. The disablement process. Soc Sci Med. 1994;38(1):1–14. doi: 10.1016/0277-9536(94)90294-1. [DOI] [PubMed] [Google Scholar]
- 11.Jette A. M. Outcomes research: shifting the dominant research paradigm in physical therapy. Phys Ther. 1995;75(11):965–970. doi: 10.1093/ptj/75.11.965. [DOI] [PubMed] [Google Scholar]
- 12.Watts J., Clement D. Conceptual framework for rehabilitation outcomes research. J Rehabil Outcomes Meas. 2000;4(2):55–61. [Google Scholar]
- 13.Bellamy N., Buchanan W. W., Goldsmith C. H., Campbell J., Stitt L. W. Validation study of WOMAC: a health status instrument for measuring clinically important patient relevant outcomes to antirheumatic drug therapy in patients with osteoarthritis of the hip or knee. J Rheumatol. 1988;15(12):1833–1840. [PubMed] [Google Scholar]
- 14.Hudak P. L., Amadio P. C., Bombardier C. Development of an upper extremity outcome measure: the DASH (disabilities of the arm, shoulder and hand) [corrected]. The Upper Extremity Collaborative Group (UECG) Am J Ind Med. 1996;29(6):602–608. doi: 10.1002/(SICI)1097-0274(199606)29:6<602::AID-AJIM4>3.0.CO;2-L. [DOI] [PubMed] [Google Scholar]
- 15.Wilson R. W., Gansneder B. M. Measures of functional limitation as predictors of disablement in athletes with acute ankle sprains. J Orthop Sports Phys Ther. 2000;30(9):528–535. doi: 10.2519/jospt.2000.30.9.528. [DOI] [PubMed] [Google Scholar]
- 16.Wilson R. W., Gieck J. H., Gansneder B. M., Perrin D. H., Saliba E. N., McCue F. C., III Reliability and responsiveness of disablement measures following acute ankle sprains among athletes. J Orthop Sports Phys Ther. 1998;27(5):348–355. doi: 10.2519/jospt.1998.27.5.348. [DOI] [PubMed] [Google Scholar]
- 17.Cross K. M., Worrell T. W., Leslie J. E., Van Veld K. R. The relationship between self-reported and clinical measures and the number of days to return to sport following acute lateral ankle sprains. J Orthop Sports Phys Ther. 2002;32(1):16–23. doi: 10.2519/jospt.2002.32.1.16. [DOI] [PubMed] [Google Scholar]
- 18.Jenkinson C. Measuring Health and Medical Outcomes. Vol 215. London, United Kingdom: UCL Press Ltd; 1994. pp. 89–110. [Google Scholar]
- 19.Campbell H., Rivero-Arias O., Johnston K., et al. Responsiveness of objective, disease-specific, and generic outcome measures in patients with chronic low back pain: an assessment for improving, stable, and deteriorating patients. Spine (Phila Pa 1976) 2006;31(7):815–822. doi: 10.1097/01.brs.0000207257.64215.03. [DOI] [PubMed] [Google Scholar]
- 20.McAllister D. R., Motamedi A. R., Hame S. L., Shapiro M. S., Dorey F. J. Quality of life assessment in elite collegiate athletes. Am J Sports Med. 2001;29(6):806–810. doi: 10.1177/03635465010290062201. [DOI] [PubMed] [Google Scholar]
- 21.Guyatt G. H., Feeny D. H., Patrick D. L. Measuring health-related quality of life. Ann Intern Med. 1993;118(8):622–629. doi: 10.7326/0003-4819-118-8-199304150-00009. [DOI] [PubMed] [Google Scholar]
- 22.SooHoo N. F., Vyas R., Samimi D. Responsiveness of the foot function index, AOFAS clinical rating systems, and SF-36 after foot and ankle surgery. Foot Ankle Int. 2006;27(11):930–934. doi: 10.1177/107110070602701111. [DOI] [PubMed] [Google Scholar]
- 23.Martin D. P., Engelberg R., Agel J., Swiontkowski M. F. Comparison of the Musculoskeletal Function Assessment questionnaire with the Short Form-36, the Western Ontario and McMaster Universities Osteoarthritis Index, and the Sickness Impact Profile health-status measures. J Bone Joint Surg Am. 1997;79(9):1323–1335. doi: 10.2106/00004623-199709000-00006. [DOI] [PubMed] [Google Scholar]
- 24.Turner J. A., Fulton-Kehoe D., Franklin G., Wickizer T. M., Wu R. Comparison of the Roland-Morris Disability Questionnaire and generic health status measures: a population-based study of workers' compensation back injury claimants. Spine (Phila Pa 1976) 2003;28(10):1061–1067. doi: 10.1097/01.BRS.0000062007.95197.08. [DOI] [PubMed] [Google Scholar]
- 25.Stratford P. W., Binkley F. M., Riddle D. L. Health status measures: strategies and analytic methods for assessing change scores. Phys Ther. 1996;76(10):1109–1123. doi: 10.1093/ptj/76.10.1109. [DOI] [PubMed] [Google Scholar]
- 26.Krishner B., Guyatt G. A methodological framework for assessing health indices. J Chronic Dis. 1985;38(1):27–36. doi: 10.1016/0021-9681(85)90005-0. [DOI] [PubMed] [Google Scholar]
- 27.Bombardier C., Tugwell P. A methodological framework to develop and select indices for clinical trials: statistical and judgmental approaches. J Rheumatol. 1982;9(5):753–757. [PubMed] [Google Scholar]
- 28.Nagi S. Disability concepts revisited: implications for prevention. In: Pope A., Tarlov A., editors. Disability in America: Toward a National Agenda for Prevention. Washington, DC: National Academies Press; 1991. pp. 309–327. [Google Scholar]
- 29.Brandt E. N., Pope A. M. Enabling America: Assessing the Role of Rehabilitation Science and Engineering. Washington, DC: National Academies Press; 1997. pp. 1–24. [PubMed] [Google Scholar]
- 30.Ebrahim S. Clinical and public health perspectives and applications of health-related quality of life measurements. Soc Sci Med. 1995;41(10):1383–1394. doi: 10.1016/0277-9536(95)00116-o. [DOI] [PubMed] [Google Scholar]
- 31.Wilson I. B., Cleary P. D. Linking clinical variables with health-related quality of life: a conceptual model of patient outcomes. JAMA. 1995;273(1):59–65. [PubMed] [Google Scholar]
- 32.Jette A. Using health-related quality of life measures in physical therapy outcomes research. Phys Ther. 1993;73(8):528–537. doi: 10.1093/ptj/73.8.528. [DOI] [PubMed] [Google Scholar]
- 33.National Center for Medical Rehabilitation Research. Report to the National Advisory Chile Health and Human Development Council. Washington, DC: US Dept of Health and Human Services; 2006. [Google Scholar]
- 34.Whiteneck G. Field M., Jette A., Martin L., editors. Conceptual models of disability: past, present, and future. Workshop on Disability in America: A New Look. Summary and Background Papers. http://www.nap.edu/catalog/php?record_id=11579#toc. Accessed June 10, 2006.
- 35.Jette A. Toward a common language for function, disability and health. Phys Ther. 2006;86(5):726–734. [PubMed] [Google Scholar]
- 36.World Health Organization. International Classification of Functioning, Disability and Health (ICF) Geneva, Switzerland: World Health Organization; 2001. pp. 1–25. [Google Scholar]
- 37.Vela L. I., Denegar C. Transient disablement in the physically active with musculoskeletal injuries, part I: a descriptive model. J Athl Train. 2010;45(6):615–629. doi: 10.4085/1062-6050-45.6.615. [DOI] [PMC free article] [PubMed] [Google Scholar]
- 38.Dunn J., Bouffard M., Rogers W. T. Assessing item content-relevance in sport psychology scale-construction research: issues and recommendations. Meas Phys Educ Exerc Sci. 1999;3(1):15–36. [Google Scholar]
- 39.Aiken L. R. Three coefficients for analyzing the reliability and validity of ratings. Educ Psychol Meas. 1985;45:131–142. [Google Scholar]
- 40.Wilkin D., Hallam L., Doggett M. A. Measures of Need and Outcome for Primary Care. Oxford, United Kingdom: Oxford University Press; 1992. [Google Scholar]
- 41.Fritz J. M., Irrgang J. J. A comparison of a modified Oswestry Low Back Pain Disability Questionnaire and the Quebec Back Pain Disability Scale. Phys Ther. 2001;81(2):776–788. doi: 10.1093/ptj/81.2.776. [DOI] [PubMed] [Google Scholar]
- 42.Spadoni G. F., Stratford P. W., Solomon P. E., Wishart L. R. The evaluation of change in pain intensity: a comparison of the P4 and single-item numeric pain rating scales. J Orthop Sports Phys Ther. 2004;34(4):187–193. doi: 10.2519/jospt.2004.34.4.187. [DOI] [PubMed] [Google Scholar]
- 43.Jaeschke R., Singer J., Guyatt G. H. Measurement of health status: ascertaining the minimal clinically important difference. Control Clin Trials. 1989;10(4):407–415. doi: 10.1016/0197-2456(89)90005-6. [DOI] [PubMed] [Google Scholar]
- 44.Hurst H., Bolton J. Assessing the clinical significance of change scores recorded on subjective outcome measures. J Manipulative Physiol Ther. 2004;27(1):26–35. doi: 10.1016/j.jmpt.2003.11.003. [DOI] [PubMed] [Google Scholar]
- 45.Strong J., Unruh A. M., Wright A., Baxter G. D. Pain: A Textbook for Therapists. Edinburgh, Scotland: Churchill Livingstone; 2002. pp. 425–443. [Google Scholar]
- 46.Evans T. The Reliability, Sensitivity, and Standard Values of the Athletic Training Outcomes Assessment Self-Report Instrument [dissertation] University Park: The Pennsylvania State University; 2002. [Google Scholar]
- 47.Beurskens A. J., de Vet H. C., Koke A. J. Responsiveness of functional status in low back pain: a comparison of different instruments. Pain. 1996;65(1):71–76. doi: 10.1016/0304-3959(95)00149-2. [DOI] [PubMed] [Google Scholar]
- 48.Williams R. M., Myers A. M. A new approach to measuring recovery in injured workers with acute low back pain: Resumption of Activities of Daily Living Scale. Phys Ther. 1998;78(6):613–623. doi: 10.1093/ptj/78.6.613. [DOI] [PubMed] [Google Scholar]
- 49.Shrout P. E., Fleiss J. L. Intraclass correlations: uses in assessing rater reliability. Psychol Bull. 1979;86(2):420–428. doi: 10.1037//0033-2909.86.2.420. [DOI] [PubMed] [Google Scholar]
- 50.Vinning D. J., Gladish G. W. Receiver operating characteristic curves: a basic understanding. Radiographics. 1992;12(6):1147–1154. doi: 10.1148/radiographics.12.6.1439017. [DOI] [PubMed] [Google Scholar]
- 51.Jette A. M. The changing language of disablement. Phys Ther. 2005;85(2):118–119. [PubMed] [Google Scholar]
- 52.Pugia M. L., Middel C. J., Seward S. W., et al. Comparison of acute swelling and function in subjects with lateral ankle injury. J Orthop Sports Phys Ther. 2001;31(7):384–388. doi: 10.2519/jospt.2001.31.7.384. [DOI] [PubMed] [Google Scholar]
- 53.Gerber J. P., Williams G. N., Scoville C. R., Arciero R. A., Taylor D. C. Persistent disability associated with ankle sprains: a prospective examination of an athletic population. Foot Ankle Int. 1998;19(10):653–660. doi: 10.1177/107110079801901002. [DOI] [PubMed] [Google Scholar]
- 54.Fleiss J. L. The Design and Analysis of Clinical Experiments. New York, NY: John Wiley and Sons Inc; 1986. pp. 1–28. [Google Scholar]
- 55.Deyo R. A., Diehr P., Patrick D. L. Reproducibility and responsiveness of health status measures: statistics and strategies for evaluation. Control Clin Trials. 1991;12(suppl 4):142S–158S. doi: 10.1016/s0197-2456(05)80019-4. [DOI] [PubMed] [Google Scholar]
- 56.Marx R. G., Jones E. C., Allen A. A., et al. Reliability, validity, and responsiveness of four knee outcome scales for athletic patients. J Bone Joint Surg Am. 2001;83(10):1459–1469. doi: 10.2106/00004623-200110000-00001. [DOI] [PubMed] [Google Scholar]
- 57.Hart D. L. Test-retest reliability of an abbreviated self-report overall health status measure. J Orthop Sports Phys Ther. 2003;33(12):734–744. doi: 10.2519/jospt.2003.33.12.734. [DOI] [PubMed] [Google Scholar]


