

Abstract
Objective
Spindles are rhythmic bursts of 10–16Hz activity, lasting ~1s, occur during normal stage 2 sleep. Spindles are slower in frontal EEG and possibly MEG. The posterior-fast EEG pattern may predominate early in the spindle, and the anterior-slow pattern late. We aimed to determine the proportion of spindles showing this spatio-spectro-temporal interaction for EEG, and whether it occurs in MEG.
Methods
We recorded high density EEG and MEG from 7 healthy subjects during normal stage 2 sleep. High vs. low frequency (12 vs. 14 Hz) power was measured early vs. late (25th–45th vs. 55th–75th duration percentile) in 183 spindle discharges.
Results
The predicted spatio-spectro-temporal interaction was shown by 48% of EEG and 34% of MEG spindles (chance=25%). Topographically, high frequency EEG power was greatest at midline central contacts, and low frequency power at midline frontal. This frequency-specific topography was fixed over the course of the spindle.
Conclusions
An evolution from posterior-fast to anterior-slow generators commonly occurs during spindles, and this is visible with EEG and to a lesser extent, MEG.
Significance
The spatio-spectral-temporal evolution of spindles may reflect their possible involvement in coordinating cortical activity during consolidation.
Keywords: Spindle, Synchrony, MEG, EEG, Cortex, thalamus, Inverse solution
Introduction
Thalamic synchronizing mechanisms are thought to be instrumental in the large-scale synchronization and selection of cortical processing (Buzsaki, 2006). The prototypical thalamo-cortical synchronizing process is the sleep spindle, first described 75 years ago by Loomis et al. (1935). In healthy humans, ~1 s duration runs of ~10–16 Hz oscillations occur several times a minute during stage 2 NREM sleep (Gibbs and Gibbs, 1950). Similar sleep spindles have been found in all tested mammalian species (Zepelin et al., 1994). Closely related phenomena occur during barbiturate anesthesia (Contreras et al., 1997), and can be reproduced in vitro (Kim et al., 1995). In addition to serving as a model system for neurophysiological studies of the alpha rhythms (Andersen and Andersson, 1968), spindles appear to play a role in memory consolidation and regulation of arousal (Schabus et al., 2004). Spindles recorded at the scalp are generated by the synapses of rhythmically-firing thalamo-cortical neurons onto cortical pyramidal cells. Extensive intracellular and extracellular recordings from single neurons, combined with local field recordings, lesions and other manipulations have culminated in tightly-constrained computational models able to reproduce the essential spindle phenomena (Destexhe and Sejnowski, 2003; Traub et al., 2005). These models provide a means whereby whole-brain phenomenological observations in humans can be interpreted within reductionist models leading to mechanistic hypotheses integrating multiple levels of neuronal resolution.
A prominent phenomenon in human sleep spindles that thus far has not been mechanistically modeled is the slower frequency of spindles in electrode leads over the frontal lobes. First described 60 years ago by Gibbs and Gibbs (1950), this interaction of frequency and site has been replicated many times (De Gennaro and Ferrara, 2003; Jankel and Niedermeyer, 1985; Jobert et al., 1992; Werth et al., 1997; Zygierewicz et al., 1999). The faster frequency spindles have been reported to appear earlier during stage 2 sleep than the slower spindles (Tanaka et al., 1997; Werth et al., 1997). Faster and slower spindles have also been found to have different developmental trajectories and pharmacology (Dijk, 1995; Dijk and Czeisler, 1995; Dijk et al., 1995; Jobert et al., 1992; Landolt et al., 1996; Shinomiya et al., 1999).
A similar pattern has also been described for MEG spindles, although the size of this effect appears to be smaller (Gumenyuk et al., 2009; Ishii et al., 2003; Manshanden et al., 2002; Urakami, 2008). Urakami et al (2008) selected spindles based on the presence of faster parietal or slower frontal EEG rhythms. MEG source modeling found that four equivalent currents dipoles (ECDs), placed in the deep parieto-central and fronto-central regions bilaterally, are adequate to explain most of the variation in spindles, including the tendency for frontal spindles to be slower (Urakami, 2008). In contrast, Gumenyuk et al (2009), using a distributed inverse method, concluded that the same central sources could generate both faster and slower spindle components.
The temporal dimension of this phenomenon was investigated by Zygierewcz et al (Zygierewicz et al., 1999). They found that the topographical distribution of higher versus lower EEG power can vary over the course of individual spindles. They described two patterns in spindles: a higher frequency pattern earlier in the spindle and maximal in parieto-central leads, and a lower frequency pattern later in the spindle and maximal in fronto-central leads. Apparently, only 5% of spindles showed overlap of the patterns, drawing into question the importance of this phenomenon. Further, only example data are shown, with no overall quantification of a representative sample of spindle discharges. One goal of the current study is to determine how common this pattern is for EEG, and to quantify its extent in a large number of representative spindles. In addition, although as noted above, the posterior fast- frontal slow pattern has been described for MEG, a comparable temporal evolution within the spindle has not been observed for that modality. Thus, we also sought in this paper to determine whether the posterior faster rhythms observed with MEG occur earlier in the spindle, compared to the anterior slower rhythms.
Methods
We recorded the electromagnetic field of the brain during sleep from seven healthy adults (3 males, 4 females, ages 20–35). Participants had no neurological problems including sleep disorders, epilepsy, or substance dependence, were taking no medications and did not consume caffeine or alcohol on the day of the recording. Written informed consent was provided, monitored by the local Institutional Review Boards. We used a whole-head MEG scanner (Neuromag Elekta) within a magnetically shielded room (IMEDCO, Hagendorf, Switzerland) and recorded simultaneously with 60 channels of EEG and 306 MEG channels. MEG SQUID (super conducting quantum interference device) sensors are arranged as triplets at 102 locations; each location contains one “magnetometer” and two orthogonal planar “gradiometers” (GRAD1, GRAD2). Unless otherwise noted, MEG will be used here to refer to the gradiometer recordings. HPI (head position index) coils were used to measure the spatial arrangement of head relative to the scanner. Four subjects had full night sleep in the scanner and three had daytime sleep recordings (2 hours). Padding was provided under the arms and knees, and around the head and neck, in order to make the subjects more comfortable and minimize movements. Every 20 min, the recording was stopped, data were saved, HPI locations were re-measured, and recordings were restarted. Analyses were limited to epochs where the subject did not move between the beginning and end of the 20 min recording. Prior to sampling at 603Hz the signal at MGH was low pass filtered at 173Hz to prevent aliasing. At UCSD, sampling rate was 1007Hz and low pass was 341. Signals from both sites were then low pass filtered at 40Hz before further analysis. An independent component analysis (ICA) algorithm was used to remove ECG contamination (Delorme and Makeig, 2004). Sleep staging was confirmed by three neurologists according to standard criteria.
Spindles were selected during stage 2 NREM sleep through visual inspection of all EEG channels. Events lasting ~1 sec and containing 10–15 Hz oscillations with a crescendo-decrescendo morphology were selected. We excluded spindles that immediately preceded or followed K-complexes. These standard clinical criteria identified 183 spindles from the 7 subjects with a mean duration and std of 721 ± 235 ms (range 427 to 1386 ms) (fig. 1). Spectral power was calculated as the squared Morlet wavelet transform of the spindles over 10–16 Hz (Caplan et al., 2001). The beginning and end of spindles were defined where the average power for the frequency range of 10–16 Hz was more than 90% greater than the background noise wavelet power for at least 5 channels and duration of at least 4 cycles in the EEG recordings). Methods for automatic detection of oscillatory period offsets and offsets were based on methods introduced earlier (Caplan et al., 2001), and were confirmed by visual examination as well. Next, each spindle was time normalized and from 25 to 45 percentile of the spindle was categorized as the “early” and from 55 to 75 percentile was defined as the “late” part of spindle. Thus, in an average 720 ms duration spindle, early period wavelet power was averaged from 180 to 324 ms from spindle onset, and late period wavelet power was averaged from 396 to 540 ms from spindle onset. Power at 12 and 14 Hz were taken to characterize low and high frequency energy, respectively. Using Morlet wavelets with wave number six, the standard deviation of the estimate of the power in the frequency domain was ~2.1Hz, and in the temporal domain was ~74ms. In order to prevent edge effects and accurately determine spindle onset and offset, prior to the wavelet transform, epochs with visually-identified spindles were expanded to include the 3 s before and after the spindle, plus an additional 250 ms padding.
Figure 1. Example spindle recordings.

Selected EEG and MEG (GRAD1 and GRAD2) channels are shown during sample spindles. The first and second halves of the spindle are indicated with boxes. Complete recording profiles are shown in Supplementary Figure S1. L (Left), M (Middle), R (Right), F (Frontal), T (Temporal), C (Central).
Results
In order to examine the dynamics of frequency and topography across successive oscillations within spindle discharges, wavelets were used to estimate the power in one Hertz steps from 10–16Hz, from the beginning to end of each individual spindle, separately for EEG and MEG. As is illustrated by the example spindle in Figure 2, many EEG spindles showed a typical spatiotemporal pattern, wherein higher frequencies occurred earlier in the spindle and in more posterior contacts, with lower frequencies in more anterior contacts being relatively more prominent later in the spindle.
Figure 2. Spatiotemporal evolution of different frequency during an example spindle.

A. All sensors, labeled according to the 10-10 system. Power in different frequencies is color coded (warmer colors are higher frequencies). For a given sensor, all frequency plots are scaled to the maximum of the highest amplitude frequency. Early in the spindle, higher frequencies predominate in posterior sites, whereas later in the spindle, lower frequencies predominate in anterior sites. B. Average across all sensors.
In order to quantify this phenomenon, power in low (12 Hz) and high (14 Hz) frequency bands was measured in each spindle burst during an early (25th to 45th percentile of spindle duration) and late (55th to 75th percentile of spindle duration) period, at each sensor, for each spindle. Topographical maps of these measures for EEG clearly show very regular differences (Fig. 3AB). Specifically, higher frequencies are maximal in the central midline, and are larger at the beginning of the spindle (Fig. 3A2), whereas lower frequencies are maximal in the frontocentral midline, and are larger at the end of the spindle (Fig. 3B1).
Figure 3. Topography of power in higher and lower frequencies over the course of the spindle discharge.
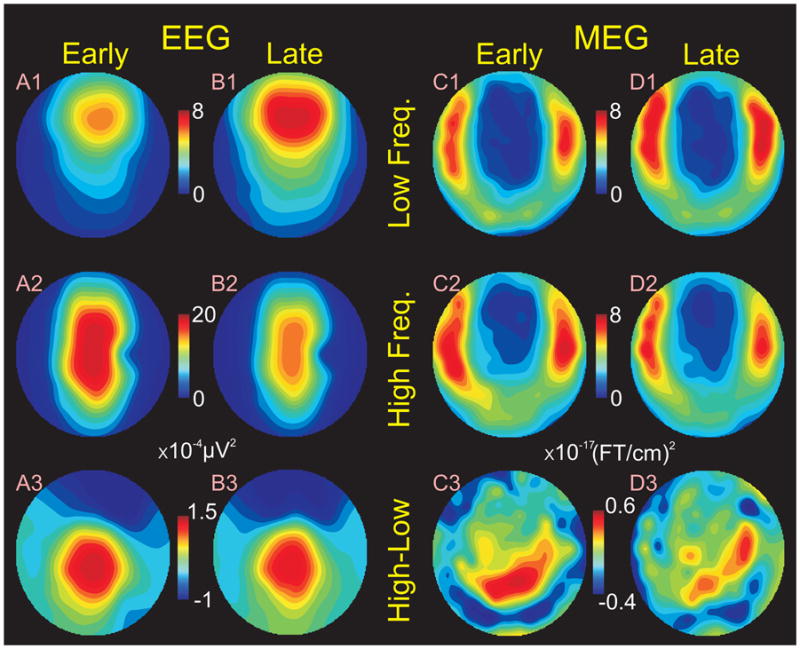
Column A. EEG power early in the spindle (from 25 to 45% of its duration). B. EEG power later in the spindle (from 55 to 75% of its duration). C. MEG gradiometer power early in the spindle. D. MEG power late in the spindle. Row 1. Topography of power in lower frequencies (12 Hz). 2. Topography of power in higher frequencies (14 Hz). 3. Relative topographies of high and low power, obtained by subtracting the zero mean normalized maps in 1 and 2 and averaging the subtractions across the subjects (after McCarthy and Wood (McCarthy and Wood, 1985)). Note that early in the spindle, higher frequency EEG power is maximal centrally (A2), whereas later in the spindle, lower frequency EEG power is maximal frontally (B1). The relative topographies of high and low power do not change over the course of the spindle (A3 versus B3). Overall power is greater in higher frequencies (note differences in scale). C,D. MEG gradiometer power has the complementary topography compared to simultaneous EEG, being minimal in anterior and midline sites. It also shows the greater high frequency power early in the spindle (C2), and greater low frequency power later (D1), but the changes are much smaller than those for EEG. Like EEG, the higher frequency MEG power has a posterior distribution which does not change over the course of the spindle (C3, D3).
The significance of these differences were examined with an ANOVA using factors of frequency (low and high), period in the spindle (early and late), anterior-posterior location, and medio-lateral location. For the location analysis, power was averaged for all of the channels in each of three regions: anterior, middle and posterior. Significant main effects were found for frequency (F(1, 6100)= 308.08, p<0.00001) and region (F(2,6100 = 47.17, p<0.00001) but not for period (F(1,6100)= 1.58, p<0.208). Examination of the marginals suggests that these effects were due to an overall greater amplitude of the higher frequencies (Figure 4A), in the central midline (Figure 4C). Also significant were the interactions of frequency with period (F(1,6100) = 21.13, p<0.00001), and frequency with region (F(2,6100) = 21.89, p< 0.00001). These interactions reflect the change in frequency from high to low over the course of the spindle burst, and the predominance of higher frequencies posteriorly and lower frequencies anteriorly. However, neither the interaction of region with period (F(2,6100) = 0.25, p = 0.78), nor the three way interaction (F(2,6100) = 0.43, p = 0.65), were significant, indicating that for a given frequency, changes between periods were similar in different regions. Thus, for example, although high frequencies were greatest in central sites early in the spindle, they decreased everywhere to about the same degree over the time-course of the spindle burst.
Figure 4. Power in different frequencies periods and locations during spindles.

A. Lo (12 Hz) frequency EEG power increases from early to late periods, whereas Hi (14 Hz) frequency power decreases. Lo frequency power is overall lower than high. B. MEG gradiometers (GRADs) show the same pattern of low frequency power increasing and high frequency power decreasing over the course of the spindle, but the changes are much smaller and the overall frequency power differences are absent. C. EEG power is greatest in midline sensors (MF: Mid-Frontal, MC: Mid-Central, MO: Mid-Occipital). D. In contrast, GRAD power is greatest in lateral sensors (LF: Left-Frontal, RF: Right-Frontal, LT:Left-Temporal, RT:Right-Temporal, LP:Left-Parietal, RP:Right-Parietal). Values are averaged across all patients and spindles. Error bars are SEM.
MEG gradiometers were examined to determine if the same spatiotemporal evolution of power in different frequency bands could be found over the course of spindle bursts. In contrast to EEG, gradiometers showed relatively subtle differences between high vs. low frequencies or early vs. late periods (Figures 3 and 4). The same conclusion, that the modulation of MEG by frequency is present but less pronounced than for EEG, was confirmed using quantitative measures. While EEG low frequency power increased 35.1% from early to late in the spindle (Figure 4A), MEG only increased 6.9% (Figure 4B). Similarly, while EEG low frequency power decreased 18.4% from early to late in the spindle (Figure 4A), MEG only decreased 9.4% (Figure 4B). Furthermore, there was a general tendency for MEG power to be approximately equal for low and high frequencies, whereas EEG was much larger at the higher frequency. Specifically, early in the spindle, 14 Hz power was 231% greater than 12 Hz in EEG, but only 9% larger in MEG. Similarly, late in the spindle 14 Hz power was 100% greater than 12 Hz for EEG, but was 8% smaller for MEG.
ANOVA was again performed with factors of frequency, period within the spindle, and three regions. Unlike EEG, the main effect of frequency (F(1,6552) =0.21, p = 0.64) was not significant. Like EEG, the main effect of period (F(1,6552) = 0.53, p = 0.46) was also not significant, but the effect of region was (F(2,6552) =106.02, p <0.00001). However, for EEG, this reflected the concentration of power in midline sites, whereas for MEG, this reflected the concentration of power in lateral sites (Fig. 3). Also like EEG, the period by region (F(2,6552)= 0.49, p = 0.61), and three-way interactions (F(2,16552) =0.20, p = 0.81) were not significant, but the period by frequency (F(1,6552) = 13.35, p < 0.0003) interaction was significant. The period by frequency effect is due to an increase of low frequency power and decrease of high frequency power from early to late within the spindle, i.e., the same pattern as found for EEG (fig. 4B). Unlike EEG, which showed a more posterior localization of high frequencies, the MEG frequency by region interaction was not significant (F(2,6552) = 1.57, p = 0.20).
The lack of significance in the period × region, and or period × region × frequency interactions, suggests that the topography of EEG and MEG power in each frequency remains constant between periods, even though their amplitudes change. This was further examined by plotting the topographical differences between higher and lower frequencies, separately for early and late in the spindle, after normalization for overall power changes between periods (bottom row of Figure 3) The normalized topographical differences between high and low frequencies are remarkably similar during the early and late periods of the spindle for EEG (Figures 3A3 vs 3B3) as well as for MEG (Figures 3C3 vs 3D3).
All of the above analyses were carried out by analyzing the mean and variance of the entire sample of spindles. A simple analysis was performed to determine whether this pattern of early/high-frequency, late/low-frequency could also be discerned in individual spindle bursts. Of the 183 spindles, 48% of EEG recordings and 34% of MEG recordings were found to have greater 14 Hz power (averaged across all sensors) early as compared to late in the spindle, and greater 12 Hz power late as compared to early in the spindle (fig. 5). Under the null hypothesis of no consistent temporal evolution of the spindle burst, the number of spindles that would be expected to show both phenomena is 25%, from which the observed proportion is significantly different at p<.0.00001 for EEG and p = 0.0017 for MEG (binomial test).
Figure 5. Spindles categorized by evolution of high and low frequency power.

In EEG recordings (left), 48% of spindles show a decline in high frequency power and an increase in low frequency power from early to late in the spindle (chance = 25%). These characteristics are also more common (34%) in MEG recordings (right) than expected from chance. The opposite pattern, where high frequency power increases and low frequency power decreases over the course of the spindle, is uncommon (14% for EEG and 15% for MEG). Also uncommon are spindles where both high and low frequency power increase (15% for EEG and 22% for MEG), while 23% of EEG spindles and 29% of MEG spindles show a fall in both high and low frequencies, similar to the frequency expected from chance.
Discussion
This paper demonstrates that higher frequency EEG power is stronger during the earlier parts of spindle bursts, whereas lower frequency power is stronger toward the end of the spindle; these modulations also occur in MEG but are smaller. Lower EEG frequencies during spindles are largest in frontal midline sensors whereas higher frequencies are largest in central midline sensors. The finding that EEG spindles are composed of slower anterior and faster posterior components confirms several previous studies over the past 60 years (De Gennaro and Ferrara, 2003; Gibbs and Gibbs, 1950; Jankel and Niedermeyer, 1985; Jobert et al., 1992; Werth et al., 1997; Zygierewicz et al., 1999). We also confirm Zygierewicz et al (1999) regarding the temporal evolution of these patterns during the course of the spindle and further show for the first time that it is a common phenomenon, being present in about half of spindle discharges.
An interesting aspect of these data was the finding that although the same posterior-faster, anterior-slower patterns could be detected with MEG (confirming Urakami (2008)), and although these also had a temporal evolution, these effects were small compared to EEG. The weaker effect in MEG may be related to the fact that the spindles studied here were chosen based on the EEG, and several authors have noted that EEG and MEG spindles do not necessarily coincide (Hughes et al., 1976; Manshanden et al., 2002; Nakasato et al., 1990; Urakami, 2008; Yoshida et al., 1996). In fact, it is noteworthy that high frequency power was about twice that of low frequency for EEG, but they were about equal for MEG. These observations provide additional evidence that the generators of EEG and MEG spindles are at least partially distinct (Dehghani et al., 2010).
The sensor topographies of EEG and MEG were also highly distinct, with EEG maximum over the central midline and MEG over the basal temporofrontal area. This in itself is not evidence for differential generators. Although the MEG gradiometers are mainly sensitive to activity originating in the directly underlying cortex, EEG sensors have broad cortical leadfields. A similar distribution is seen for the N400 evoked by words, which is maximal at Fz in EEG and in basal temporofrontal leads in MEG (Halgren et al., 2002). Since extensive intracranial recordings have confirmed a basal temporofrontal generator for the N400 (Halgren et al., 1994a; Halgren et al., 1994b), the EEG topography is assumed to reflect volume conduction. An exclusively basal temporofrontal generator cannot be the case for spindles, because intracranial recordings have identified generators in multiple cortical areas (Asano et al., 2007; Nakabayashi et al., 2001; Nakamura et al., 2003). In addition, we found MEG activity over multiple locations, including the superior parietal lobe, where the maximum difference was found between high and low frequency power (Figures 3C and 3D).
Although the spindles recorded in the current study were no doubt generated by current dipoles in the cortex, animal studies have shown that they are the result of a thalamic pacemaker which projects to the cortex. Spindle rhythms arise in interactions of thalamic projection cells with inhibitory neurons in the nucleus reticularis thalami, due to both intrinsic currents and network interactions (Contreras et al., 1997; Destexhe and Sejnowski, 2003; McCormick and Bal, 1997). Computational models for spindle discharges predict that spindle frequency can be modulated by changes in the membrane potential or other cellular properties of thalamic cells (Destexhe and Sejnowski, 2003). Thus, differences in spindle frequency could be due to differences in channel properties, in membrane potential, or in network delays and characteristics (Bazhenov et al., 2002). All of these mechanisms could be characteristics of the same cells at different times, or consistent characteristics of different cell populations. In other words, neurobiological findings indicate that different frequencies could arise within the same generators, or could be characteristics of different generators.
In this regard, it is worth noting that in our data the scalp topographies of low and high frequency power remained constant over the course of the spindle, even though their relative quantities changed substantially. This suggests that the generators underlying low and high frequency spindle components remain constant over the course of the spindle, and may be characteristic of particular circuits rather than reflecting a dynamic modulation of the same circuit. The identity of these circuits remain to be identified, but the topography observed here suggests that the early part of the spindle involving higher frequencies may preferentially engage posterior cortical modules that then spread to frontal modules with lower characteristic frequencies. A special role for prefrontal cortex in spindle synchronization is suggested by anatomical projections from BA 46, 9, and 13 to extensive regions of the nucleus reticularis thalami (Zikopoulos and Barbas, 2006), which may play a critical role in synchronizing the spindle discharge (Contreras et al., 1997).
Increasing evidence suggests a role for sleep processes in the consolidation of memories. For example, the number of words recalled overnight in a cued recall task is correlated with the number of intervening spindles (Schabus et al., 2004). Lesion evidence shows that cued recall performance is dependent on hippocampal-cortical interactions. In rats, cortical spindles interact with hippocampal sharp waves (Siapas and Wilson, 1998), during which there may be replay of cell assemblies activated during the preceding wakefulness (Wilson and McNaughton, 1994). Thus, it has been proposed that replay of events in hippocampal-cortical circuits during spindles may contribute to the consolidation of declarative memories. Our results suggest a tendency for activation during spindles to move from more posterior to more anterior cortex, and this may reflect a replay of activation from sensory-perceptual to motor-executive representations, as occurs during many events where a stimulus evokes a response.
In summary, the current results indicate that about half of spindle discharges are initially dominated by more posterior higher rhythms, and terminate with more frontal lower frequencies. The temporal evolution within spindle discharges appears to be the result of successive engagement of spindle generating circuits with different characteristic frequencies, rather than modulation of a unified circuit.
Supplementary Material
EEG (blue) and MEG (grad1- red; grad2- black) channels are highlighted in yellow (first half of the spindle) and green (second half).
Acknowledgments
This research was supported by NIH grants NS18741, EB009282 and NS44623. We thank Andrea Rossetti, Chin Chuan Chen, Robert Thomas, Ken Kwong, Maxim Bazhenov, and Terry Sejnowski for valuable collaborations. Equivalent contributions were made by the three authors to the work reported here.
Footnotes
Publisher's Disclaimer: This is a PDF file of an unedited manuscript that has been accepted for publication. As a service to our customers we are providing this early version of the manuscript. The manuscript will undergo copyediting, typesetting, and review of the resulting proof before it is published in its final citable form. Please note that during the production process errors may be discovered which could affect the content, and all legal disclaimers that apply to the journal pertain.
References
- Andersen P, Andersson SA. Physiological basis of the alpha rhythm. New York: Meredith Corp; 1968. [Google Scholar]
- Asano E, Mihaylova T, Juhasz C, Sood S, Chugani HT. Effect of sleep on interictal spikes and distribution of sleep spindles on electrocorticography in children with focal epilepsy. Clin Neurophysiol. 2007;118:1360–8. doi: 10.1016/j.clinph.2007.02.021. [DOI] [PMC free article] [PubMed] [Google Scholar]
- Bazhenov M, Timofeev I, Steriade M, Sejnowski TJ. Model of thalamocortical slow-wave sleep oscillations and transitions to activated States. J Neurosci. 2002;22:8691–704. doi: 10.1523/JNEUROSCI.22-19-08691.2002. [DOI] [PMC free article] [PubMed] [Google Scholar]
- Buzsaki G. Rhythms of the Brain. Oxford: Oxford Univ. Press; 2006. [Google Scholar]
- Caplan JB, Madsen JR, Raghavachari S, Kahana MJ. Distinct patterns of brain oscillations underlie two basic parameters of human maze learning. J Neurophysiol. 2001;86:368–80. doi: 10.1152/jn.2001.86.1.368. [DOI] [PubMed] [Google Scholar]
- Contreras D, Destexhe A, Sejnowski TJ, Steriade M. Spatiotemporal patterns of spindle oscillations in cortex and thalamus. J Neurosci. 1997;17:1179–96. doi: 10.1523/JNEUROSCI.17-03-01179.1997. [DOI] [PMC free article] [PubMed] [Google Scholar]
- De Gennaro L, Ferrara M. Sleep spindles: an overview. Sleep Med Rev. 2003;7:423–40. doi: 10.1053/smrv.2002.0252. [DOI] [PubMed] [Google Scholar]
- Dehghani N, Cash SS, Rossetti A, Chen CC, Halgren E. Magnetoencephalography demonstrates multiple asynchronous generators during human sleep spindles. J Neurophysiol. 2010 doi: 10.1152/jn.00198.2010. in press. [DOI] [PMC free article] [PubMed] [Google Scholar]
- Delorme A, Makeig S. EEGLAB: an open source toolbox for analysis of single-trial EEG dynamics including independent component analysis. Journal of Neuroscience Methods. 2004;134:9–21. doi: 10.1016/j.jneumeth.2003.10.009. [DOI] [PubMed] [Google Scholar]
- Destexhe A, Sejnowski TJ. Interactions between membrane conductances underlying thalamocortical slow-wave oscillations. Physiol Rev. 2003;83:1401–53. doi: 10.1152/physrev.00012.2003. [DOI] [PMC free article] [PubMed] [Google Scholar]
- Dijk DJ. EEG slow waves and sleep spindles: windows on the sleeping brain. Behav Brain Res. 1995;69:109–16. doi: 10.1016/0166-4328(95)00007-g. [DOI] [PubMed] [Google Scholar]
- Dijk DJ, Czeisler CA. Contribution of the circadian pacemaker and the sleep homeostat to sleep propensity, sleep structure, electroencephalographic slow waves, and sleep spindle activity in humans. J Neurosci. 1995;15:3526–38. doi: 10.1523/JNEUROSCI.15-05-03526.1995. [DOI] [PMC free article] [PubMed] [Google Scholar]
- Dijk DJ, Roth C, Landolt HP, Werth E, Aeppli M, Achermann P, et al. Melatonin effect on daytime sleep in men: suppression of EEG low frequency activity and enhancement of spindle frequency activity. Neurosci Lett. 1995;201:13–6. doi: 10.1016/0304-3940(95)12118-n. [DOI] [PubMed] [Google Scholar]
- Gibbs FA, Gibbs EL. Atlas of Electroencephalography. Vol. 1. Cambridge: Addison-Wesley Press; 1950. [Google Scholar]
- Gumenyuk V, Roth T, Moran JE, Jefferson C, Bowyer SM, Tepley N, et al. Cortical locations of maximal spindle activity: magnetoencephalography (MEG) study. J Sleep Res. 2009;18:245–53. doi: 10.1111/j.1365-2869.2008.00717.x. [DOI] [PubMed] [Google Scholar]
- Halgren E, Baudena P, Heit G, Clarke JM, Marinkovic K. Spatio-temporal stages in face and word processing. 1. Depth-recorded potentials in the human occipital, temporal and parietal lobes. Journal of Physiology (Paris) 1994a;88:1–50. doi: 10.1016/0928-4257(94)90092-2. [DOI] [PubMed] [Google Scholar]
- Halgren E, Baudena P, Heit G, Clarke JM, Marinkovic K, Chauvel P. Spatio-temporal stages in face and word processing. 2. Depth-recorded potentials in the human frontal and Rolandic cortices. Journal of Physiology (Paris) 1994b;88:51–80. doi: 10.1016/0928-4257(94)90093-0. [DOI] [PubMed] [Google Scholar]
- Halgren E, Dhond RP, Christensen N, Van Petten C, Marinkovic K, Lewine JD, et al. N400-like magnetoencephalography responses modulated by semantic context, word frequency, and lexical class in sentences. Neuroimage. 2002;17:1101–16. doi: 10.1006/nimg.2002.1268. [DOI] [PubMed] [Google Scholar]
- Hughes JR, Hendrix DE, Cohen J, Duffy FH, Mayman CI, Scholl ML, et al. Relationship of the magnetoencephalogram to the electroencephalogram. Normal wake and sleep activity. Electroencephalogr Clin Neurophysiol. 1976;40:261–78. doi: 10.1016/0013-4694(76)90150-4. [DOI] [PubMed] [Google Scholar]
- Ishii R, Dziewas R, Chau W, Soros P, Okamoto H, Gunji A, et al. Current source density distribution of sleep spindles in humans as found by synthetic aperture magnetometry. Neurosci Lett. 2003;340:25–8. doi: 10.1016/s0304-3940(03)00048-x. [DOI] [PubMed] [Google Scholar]
- Jankel WR, Niedermeyer E. Sleep spindles. J Clin Neurophysiol. 1985;2:1–35. doi: 10.1097/00004691-198501000-00001. [DOI] [PubMed] [Google Scholar]
- Jobert M, Poiseau E, Jhnig P, Schulz H, Kubicki S. Topographical analysis of sleep spindle activity. Neuropsychobiology. 1992;26:210–7. doi: 10.1159/000118923. [DOI] [PubMed] [Google Scholar]
- Kim U, Bal T, McCormick DA. Spindle waves are propagating synchronized oscillations in the ferret LGNd in vitro. J Neurophysiol. 1995;74:1301–23. doi: 10.1152/jn.1995.74.3.1301. [DOI] [PubMed] [Google Scholar]
- Landolt HP, Dijk DJ, Achermann P, Borbely AA. Effect of age on the sleep EEG: slow-wave activity and spindle frequency activity in young and middle-aged men. Brain Res. 1996;738:205–12. doi: 10.1016/s0006-8993(96)00770-6. [DOI] [PubMed] [Google Scholar]
- Loomis AL, Harvey EN, Hobart G. Potential rhythms of cerebral cortex during sleep. Science. 1935;81:597–598. doi: 10.1126/science.81.2111.597. [DOI] [PubMed] [Google Scholar]
- Manshanden I, De Munck JC, Simon NR, Lopes da Silva FH. Source localization of MEG sleep spindles and the relation to sources of alpha band rhythms. Clin Neurophysiol. 2002;113:1937–47. doi: 10.1016/s1388-2457(02)00304-8. [DOI] [PubMed] [Google Scholar]
- McCarthy G, Wood CC. Scalp distributions of event-related potentials: an ambiguity associated with analysis of variance models. Electroencephalography and Clinical Neurophysiology. 1985;62:203–208. doi: 10.1016/0168-5597(85)90015-2. [DOI] [PubMed] [Google Scholar]
- McCormick DA, Bal T. Sleep and arousal: thalamocortical mechanisms. Annu Rev Neurosci. 1997;20:185–215. doi: 10.1146/annurev.neuro.20.1.185. [DOI] [PubMed] [Google Scholar]
- Nakabayashi T, Uchida S, Maehara T, Hirai N, Nakamura M, Arakaki H, et al. Absence of sleep spindles in human medial and basal temporal lobes. Psychiatry Clin Neurosci. 2001;55:57–65. doi: 10.1046/j.1440-1819.2001.00785.x. [DOI] [PubMed] [Google Scholar]
- Nakamura H, Kashii S, Nagamine T, Matsui Y, Hashimoto T, Honda Y, et al. Human V5 demonstrated by magnetoencephalography using random dot kinematograms of different coherence levels. Neurosci Res. 2003;46:423–33. doi: 10.1016/s0168-0102(03)00119-6. [DOI] [PubMed] [Google Scholar]
- Nakasato N, Kado H, Nakanishi M, Koyanagi M, Kasai N, Niizuma H, et al. Magnetic detection of sleep spindles in normal subjects. Electroencephalogr Clin Neurophysiol. 1990;76:123–130. doi: 10.1016/0013-4694(90)90210-b. [DOI] [PubMed] [Google Scholar]
- Schabus M, Gruber G, Parapatics S, Sauter C, Klosch G, Anderer P, et al. Sleep spindles and their significance for declarative memory consolidation. Sleep. 2004;27:1479–85. doi: 10.1093/sleep/27.7.1479. [DOI] [PubMed] [Google Scholar]
- Shinomiya S, Nagata K, Takahashi K, Masumura T. Development of sleep spindles in young children and adolescents. Clin Electroencephalogr. 1999;30:39–43. doi: 10.1177/155005949903000203. [DOI] [PubMed] [Google Scholar]
- Siapas AG, Wilson MA. Coordinated interactions between hippocampal ripples and cortical spindles during slow-wave sleep. Neuron. 1998;21:1123–8. doi: 10.1016/s0896-6273(00)80629-7. [DOI] [PubMed] [Google Scholar]
- Tanaka H, Hayashi M, Hori T. Topographical characteristics and principal component structure of the hypnagogic EEG. Sleep. 1997;20:523–34. doi: 10.1093/sleep/20.7.523. [DOI] [PubMed] [Google Scholar]
- Traub RD, Contreras D, Cunningham MO, Murray H, LeBeau FE, Roopun A, et al. Single-column thalamocortical network model exhibiting gamma oscillations, sleep spindles, and epileptogenic bursts. J Neurophysiol. 2005;93:2194–232. doi: 10.1152/jn.00983.2004. [DOI] [PubMed] [Google Scholar]
- Urakami Y. Relationships between sleep spindles and activities of cerebral cortex as determined by simultaneous EEG and MEG recording. J Clin Neurophysiol. 2008;25:13–24. doi: 10.1097/WNP.0b013e318162a8a4. [DOI] [PubMed] [Google Scholar]
- Werth E, Achermann P, Dijk DJ, Borbly AA. Spindle frequency activity in the sleep EEG: individual differences and topographic distribution. Electroenceph clin Neurophysiol. 1997;103:535–42. doi: 10.1016/s0013-4694(97)00070-9. [DOI] [PubMed] [Google Scholar]
- Wilson MA, McNaughton BL. Reactivation of hippocampal ensemble memories during sleep. Science. 1994;265:676–9. doi: 10.1126/science.8036517. [DOI] [PubMed] [Google Scholar]
- Yoshida H, Iramina K, Ueno S. Source models of sleep spindles using MEG and EEG measurements. Brain Topogr. 1996;8:303–307. doi: 10.1007/BF01184789. [DOI] [PubMed] [Google Scholar]
- Zepelin H, Siegel JM, Tobler I. Mammalian sleep. In: Kryger MH, Roth T, Dement WC, editors. Principles and Practice of Sleep Medicine. London: Saunders; 1994. pp. 91–100. [Google Scholar]
- Zikopoulos B, Barbas H. Prefrontal projections to the thalamic reticular nucleus form a unique circuit for attentional mechanisms. J Neurosci. 2006;26:7348–61. doi: 10.1523/JNEUROSCI.5511-05.2006. [DOI] [PMC free article] [PubMed] [Google Scholar]
- Zygierewicz J, Blinowska KJ, Durka PJ, Szelenberger W, Niemcewicz S, Androsiuk W. High resolution study of sleep spindles. Clin Neurophysiol. 1999;110:2136–47. doi: 10.1016/s1388-2457(99)00175-3. [DOI] [PubMed] [Google Scholar]
Associated Data
This section collects any data citations, data availability statements, or supplementary materials included in this article.
Supplementary Materials
EEG (blue) and MEG (grad1- red; grad2- black) channels are highlighted in yellow (first half of the spindle) and green (second half).