Abstract
Arterial spin labeling (ASL) based cerebral blood flow (CBF) imaging complements blood oxygenation level dependent (BOLD) imaging with a measure that is more quantitative and has better specificity to neuronal activation. Relative to gradient echo (GE) BOLD, spin echo (SE) BOLD has better spatial specificity because it is less biased to large draining veins. While there have been many studies comparing simultaneously acquired CBF data with GE BOLD data in fMRI, there have been few studies comparing CBF with SE BOLD and no study comparing all three. We present a pulse sequence that simultaneously acquires CBF data with a separate labeling coil, GE BOLD and SE BOLD images. Simultaneous acquisition avoids inter-scan variability, allowing more direct assessment and comparison of each contrast’s relative specificity and reproducibility. Furthermore, it facilitates studies that may benefit from multiple complementary measures.
INTRODUCTION
Blood oxygenation level dependent (BOLD) contrast can be used to study hemodynamic response secondary to brain activity by detecting changes in deoxyhemoglobin levels near the site of neuronal activity (1). BOLD contrast using fMRI has been the most prominent functional neuroimaging method in the last 15 years owing to its high sensitivity and ease of use. However, BOLD signal is dependent on a combination of physiological parameters, including cerebral blood flow (CBF), cerebral blood volume (CBV) and cerebral metabolic rate of oxygen (CMRO2) and therefore produces relative, not absolute results that vary longitudinally (2). Furthermore, the magnitude of the signal change is largely dependent on brain vasculature. Gradient echo (GE) BOLD signal originates from the venous concentration of deoxyhemoglobin so “activation” may be aligned more with draining veins than actual neuronal activity (3). While deoxyhemoglobin levels in large vessels improve GE BOLD sensitivity, spatial specificity and resolution of activation are inferior to methods using other means of contrast such as CBF (4,5) or spin echo (SE) BOLD (6,7).
T2-weighted SE BOLD differs from T2*-weighted GE BOLD because it refocuses static dephasing that occurs around large vessels. Therefore, SE BOLD contrast results from dynamic dephasing inside and surrounding small vessels and inside large vessels (8). As static magnetic field increases, large vessel’s SE BOLD contribution is further diminished due to shorter T2 of venous blood (7). Even at 3 Tesla, SE BOLD has been applied for experiments requiring a high degree of spatial localization (6).
CBF imaging with ASL is more quantitative and has better specificity to neuronal activation relative to BOLD (5). Specifically, ASL uses magnetically labeled arterial blood water as an endogenous tracer for measuring CBF (4,5). The performance of ASL can be enhanced by using a separate labeling coil to improve arterial labeling efficiency and minimize magnetization transfer (MT) effects (9,10). While CBF is more reproducible than GE BOLD (2), it has not been directly compared with simultaneous SE BOLD acquisition. One study did compare SE BOLD and CBF data demonstrating reproducibility across repeated measures at 4 and 7 T (7). However, that study relied on separate acquisition of each contrast and did not include GE BOLD. The ability to simultaneously acquire all 3 contrasts could provide a better basis for comparison between them.
Pulse sequences that acquire multiple images with different contrasts have several advantages over single contrast sequences. First, multiple readout sequences improve scanning efficiency relative to imaging protocols that would require separate scans for multiple contrasts. Second, simultaneous acquisition does not suffer from inter-scan variability, allowing more direct comparison of multiple contrasts. Third, unlike single readout sequences used to extract both CBF and BOLD, multiple readout sequences allow the use of appropriate TE for different contrasts. One such approach utilizes two readouts with ASL, minimizing echo time (TE) for CBF (reducing BOLD contamination) and optimizing TE for GE BOLD (matching to gray matter T2*) using both EPI (11) and spiral (12) readouts. However, there have been no previous attempts implementing simultaneous CBF and SE BOLD acquisition.
This paper presents a pulse sequence that simultaneously acquires CBF images with a separate labeling coil, GE BOLD and SE BOLD images. This approach optimizes imaging parameters for each contrast. SNR and CBF quantification of the CBF contrast of the new sequence are compared to those of the stand-alone SE CBF sequence. The sequence’s utility for fMRI is demonstrated with a visual stimulation paradigm. Activations from the 3 contrasts are assessed and compared.
METHODS
Five healthy male subjects (age 27-32 years) participated in this experiment after providing written informed consent. All scans were performed according to guidelines of the Emory University Institutional Review Board and were acquired in a single session for each subject.
Visual Stimuli
Visual stimulation was presented using a block design. The stimulus used was a flashing checkerboard covering 8 radial visual field degrees and reversing contrast at 8 Hz. Each scan consisted of two 63-second fixation blocks interleaved with two 63-second visual stimulation blocks.
Image Acquisition
Data were acquired on a Siemens 3T MAGNETOM Tim Trio scanner (Siemens Medical Solutions, Erlangen, Germany) utilizing a stand-alone SE CBF sequence and the new triple contrast sequence described here. Both sequences were programmed in the Siemens IDEA environment. Arterial blood was labeled with a home-built butterfly labeling coil (10) (labeling duration of 3 s, post-label delay of 700 ms) and control and labeled images were interleaved. Additionally, an MPRAGE T1-weighted anatomical image with 1 mm3 resolution was acquired for each subject.
Stand-Alone SE CBF
For each participant, one 4.5 minute resting scan using a single readout stand-alone SE CBF sequence (10) acquired 5 ascending slices (TR of 4500 ms, 3.43 × 3.43 × 5 mm resolution with 75% partial Fourier acquisition and a TE of 27 ms).
Simultaneous CBF, GE BOLD and SE BOLD
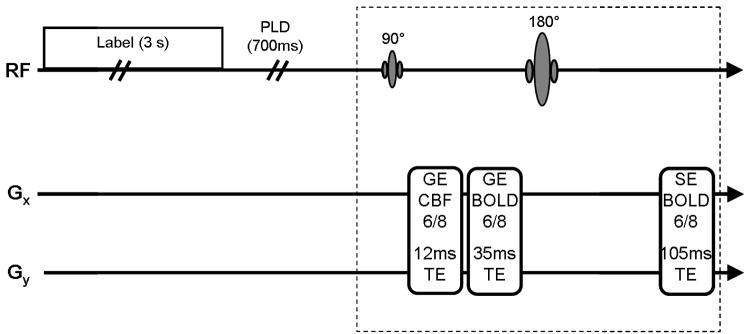
Following labeling and post-label delay, the simultaneous sequence consists of a 90 degree excitation followed by two acquisitions at short and long TEs for CBF and GE BOLD, respectively (Fig. 1). After subsequent 180 degree refocusing pulse, the SE BOLD image was acquired. Echo times were optimized for each contrast; CBF utilized the shortest possible TE (12 ms) to minimize BOLD contamination, GE BOLD matched TE (35 ms) to gray matter T2* and SE BOLD readout is symmetric about the echo at a TE of 105 ms close to gray matter T2. Consistent with the stand-alone SE sequence, the simultaneous sequence acquired 5 ascending slices using a TR of 4500 ms and 3.43 × 3.43 × 5 mm resolution with partial Fourier acquisition (75%) in the phase encoding direction. Following a 4.5 minute resting scan for the comparison of CBF data quality with standard single readout CBF acquisition, four scans were acquired with visual stimulation using the same imaging parameters as the resting scan. Expanding slice coverage would be possible if a slightly longer TR is acceptable. For instance, expanding from 5 to 10 slices would increase the TR from ~4.5 s to ~5 s. However, all scans in the current study used 5 slices.
Fig. 1.
Simultaneous sequence acquires CBF, GE BOLD and SE BOLD following a 3 second label and 700 ms post-label delay (w).
Data Analysis
Following motion correction, control and labeled images were subtracted for CBF and averaged for SE and GE BOLD. Next, CBF was quantified using the following equation (13):
| [1] |
where CBF denotes quantified perfusion, λ is blood/water partition coefficient, ΔS is the difference between control and label images, R1,BLOOD is the longitudinal relaxation rate of blood, w is the slice-specific post-labeling delay, τ is the label duration, M0 is the equilibrium magnetization of brain, and α is the tagging efficiency. Eq. [1] was applied using an M0 approximated by the control images and α of 0.75, R1,BLOOD of 0.67 s-1 (14), and λ of 0.98 ml/g (15).
Next, all functional data were coregistered to the corresponding high resolution anatomical image, normalized to the standard Montreal Neurological Institute (MNI) template and spatially smoothed (5 mm FWHM kernel). For resting scans, CBF data for both stand-alone SE and simultaneous sequences were masked with segmented anatomical data for the same subject. Resting CBF data for gray matter voxels was assessed for each sequence by quantifying resting CBF using Eq. [1] and calculating SNR using
| [2] |
where SCONTROL and SLABEL are mean signal of control and labeled acquisitions, respectively. Data acquired during the visual stimulation paradigm were statistically analyzed using SPM2 (Wellcome Department, University College of London, London, UK). A general linear model (GLM) was applied to smoothed data in original and MNI coordinates.
Region of Interest (ROI) Selection
Two methods of ROI selection were used for the analysis of task-related data. First, CBF activation was determined using a threshold of p<0.05 corrected for false discovery rate (FDR) (16). This ROI served as a “CBF localizer” for each subject and contrast because ROI selection based on CBF is known to be more specific to neuronal activity than BOLD and has been shown to reduce variation of CBF and BOLD signals (17). Second, SE and GE BOLD ROIs were defined by matching corresponding suprathreshold voxel counts to the CBF localizer for each subject. These ROIs served as the subject-specific “matched voxel count localizer” for GE and SE BOLD. Therefore, CBF utilized a single ROI (CBF Localizer) while GE and SE BOLD used two types of ROIs (CBF and matched voxel count localizers).
RESULTS
The expected characteristics of minimal T2/T2* decay in echo 1, T2* weighting in echo 2 and T2 weighting in echo 3 are observed in the images acquired (Fig. 2). Activation maps also reflect the expected behavior for each contrast when a common statistical threshold (FDR < 0.05) is used for all contrasts. Specifically, CBF shows the most localized activation, reflecting the highest specificity and lowest sensitivity of the 3 contrasts (Fig 3A). In contrast, GE BOLD shows the largest activation region, consistent with its expected high sensitivity. SE BOLD led to activation patterns that fall between those of CBF and GE BOLD. On one hand, SE BOLD activation is more localized, consistent with the notion that SE BOLD is less sensitive to large vessels than GE BOLD. On the other hand, SE BOLD has a higher sensitivity than CBF, detecting more activated voxels. The matched voxel count localizer, which controls for variable sensitivities of these contrasts, is shown in Fig. 3B. Matching activation extent between contrasts allows a fair comparison of each contrast’s specificity without significant influence from the differences in contrast-to-noise ratios.
Fig. 2.
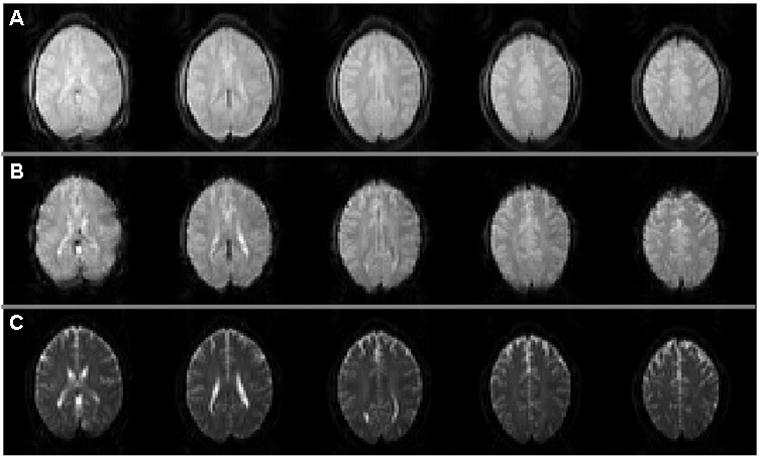
Simultaneously acquired (A) control image for CBF, (B) GE BOLD and (C) SE BOLD data.
Fig. 3.
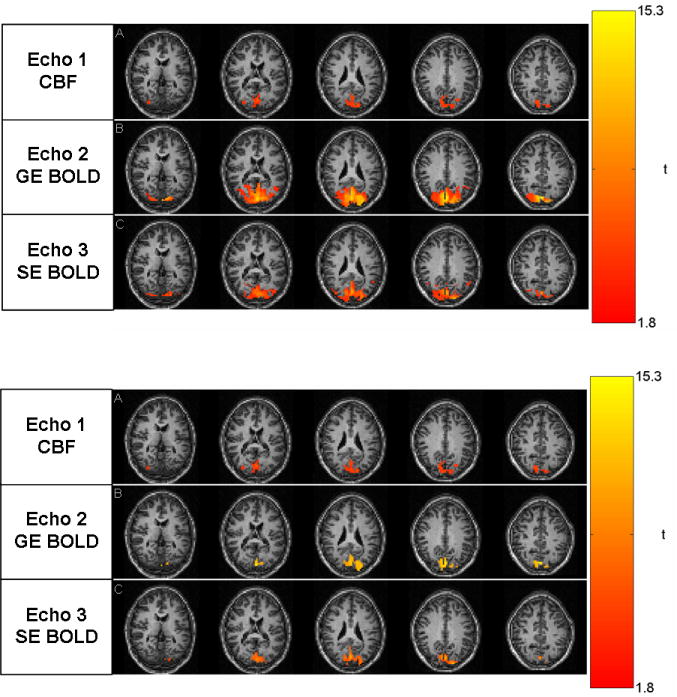
Activation for subject 4: (A) p<0.05 corrected for FDR for all contrasts and (B) CBF (p<0.05 corrected for FDR) and matching voxel counts for SE and GE BOLD.
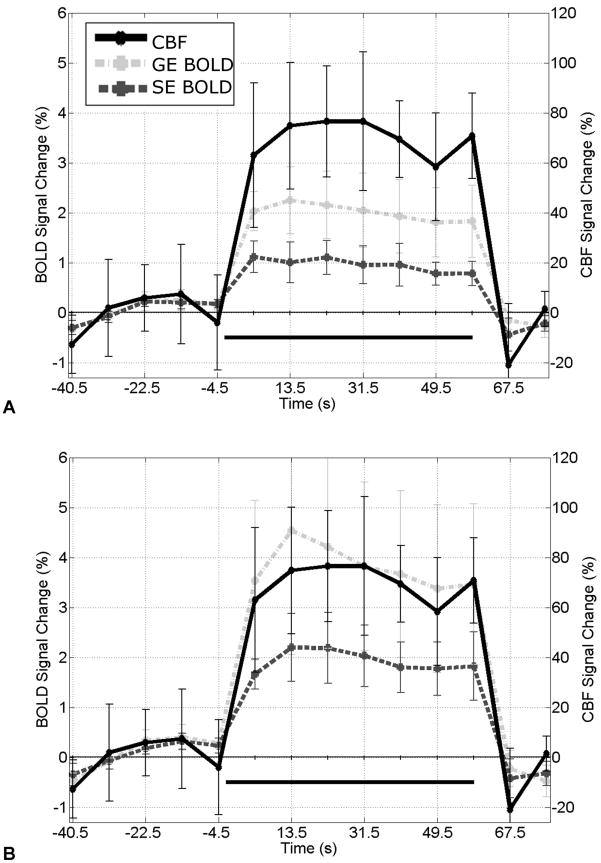
In the CBF and matched voxel count ROIs, time courses (Fig. 4) exhibit similar behavior for all three contrasts. Mean percent signal changes are 71.5±15.5%, 2.0±0.7% and 0.9±0.3% (71.5±15.5%, 3.8±1.8% and 2.0±0.6%) for CBF, GE BOLD and SE BOLD, respectively, when using the CBF localizer (matched voxel count localizer). CBF data quality is maintained in the simultaneous sequence as its resting CBF SNR (0.91 ± 0.27) is comparable to that of the stand-alone SE sequence (0.92 ± 0.24). Although mean gray matter CBF is slightly higher for the simultaneous sequence compared to the stand-alone sequence (54.5 ± 13.0 and 47.3 ± 10.1 mL blood / 100 g tissue / min, respectively), the differences are not significant. ΔS/SCONTROL images (Fig. 5) show good contrast between highly perfused gray matter and other structures for both sequences.
Fig. 4.
Mean time course (± S.E. across subjects) using (A) CBF localizer and (B) matched voxel count localizer.
Fig. 5.
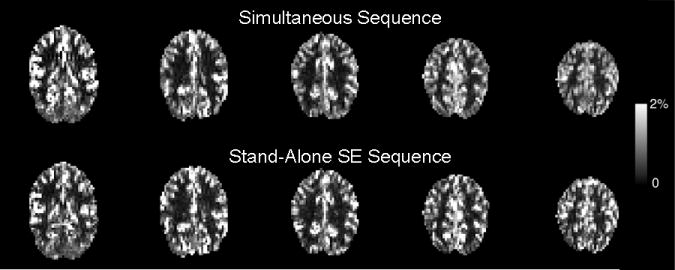
ΔS/SCONTROL for CBF data acquired with simultaneous sequence (top row) and stand-alone SE sequence (bottom row).
DISCUSSION
This paper presents a pulse sequence that simultaneously acquires CBF, GE BOLD and SE BOLD images. Implementation with a separate labeling coil improves CBF SNR by the high labeling efficiency and the absence of MT effects.
We validated CBF data quality acquired with the new sequence by comparing CBF data from the simultaneous and stand-alone SE (10) sequences during rest. CBF SNR in gray matter voxels is virtually the same for the two sequences and is comparable to other studies using a separate labeling coil (0.9% compared to 0.4-1.3% (9) and 0.8% (18)). Furthermore, gray matter CBF values of 47.3 and 54.5 ml/100 g/min for stand-alone SE and simultaneous sequences, respectively, are within the previously reported range of 48-62 ml/100 g/min (9). Slightly higher CBF for the simultaneous sequence relative to the stand-alone SE sequence could be due to the differences between spin and gradient echo CBF acquisitions.
Upon validation of CBF data quality, we assessed task-related activation and percent signal change. When using a common statistical threshold for all three contrasts, activation extent was least extensive for CBF, moderate for SE BOLD, and most extensive for GE BOLD. This is consistent with the reduced sensitivity of the CBF contrast relative to BOLD (19) as well as the suppression of macrovascular contributions in SE BOLD relative to GE BOLD (8). Furthermore, time courses exhibit signal change within the expected ranges for all subjects and contrasts (20).
Inter-subject variation of relative signal changes has been shown to be lower for CBF than GE BOLD in one study (2) but lower for GE BOLD than CBF in another study (17). Future applications of our sequence will enable the simultaneous comparison of SE BOLD to these contrasts for reproducibility assessment. A higher BOLD variability can be expected for two reasons. First, it reflects a mix of CBF, CBV and CMRO2 while CBF serves as a more direct measurement. Second, signal contribution from macrovasculature with large deoxyhemoglobin changes, such as draining veins, could lead to less stable signal changes and more dependence on the vasculature architecture. SE BOLD is less susceptible to macrovasculature (7), so the second factor likely affects GE BOLD more than SE BOLD. Utilization of a CBF localizer (reducing venular effects) is possible with our sequence, enabling the specificity of CBF with sensitivity of BOLD.
Acquisition of three echoes following arterial spin labeling also allows for further analysis. CBF-weighted images could be obtained by subtracting control and labeled images for all three echoes. This would be most useful to compare gradient echo CBF-weighted images at short TE and spin echo images. However, the current study focuses on the first echo due to T1 relaxation of the CBF contrast with the use a long TE (selected to be sensitive to T2 of gray matter). On the other hand, some influence of arterial spin labeling could adversely impact BOLD images. While this is addressed by averaging control and labeled images for the GE and SE BOLD acquisitions, further studies could compare stand-alone BOLD acquisition with the simultaneous sequence.
The simultaneous sequence presented in this study could potentially be enhanced with the inclusion of bipolar diffusion gradients to further minimize intravascular contributions in the SE BOLD contrast as previously demonstrated (8); such an approach, however, reduces SNR so further studies are needed to compare CBF localization and diffusion gradients to optimize the balance between BOLD SNR and microvascular specificity.
CONCLUSION
This work enhances the two-coil CASL approach with the development of a new sequence that simultaneously acquires CBF, GE BOLD, and SE BOLD images. Images show expected weightings, and resultant activation maps are consistent with known characteristics of each contrast. This sequence can be applied to further compare intra-and inter-session reproducibility without inter-scan variability that confounds comparison using separate acquisitions for each contrast. Furthermore, scanning time can be significantly reduced relative to traditional protocols using separate acquisition of multiple contrasts.
Acknowledgments
This work was supported in part by the NIH RO1 EB002009.
References
- 1.Ogawa S, Tank DW, Menon R, Ellermann JM, Kim S, Merkle H, Ugurbil K. Intrinsic Signal Changes Accompanying Sensory Stimulation: Functional Brain Mapping with Magnetic Resonance Imaging. PNAS. 1992;89(13):5951–5955. doi: 10.1073/pnas.89.13.5951. [DOI] [PMC free article] [PubMed] [Google Scholar]
- 2.Tjandra T, Brooks JC, Figueiredo P, Wise R, Matthews PM, Tracey I. Quantitative assessment of the reproducibility of functional activation measured with BOLD and MR perfusion imaging: implications for clinical trial design. Neuroimage. 2005;27(2):393–401. doi: 10.1016/j.neuroimage.2005.04.021. [DOI] [PubMed] [Google Scholar]
- 3.Ogawa S, Menon RS, Tank DW, Kim SG, Merkle H, Ellermann JM, Ugurbil K. Functional brain mapping by blood oxygenation level-dependent contrast magnetic resonance imaging. A comparison of signal characteristics with a biophysical model. Biophys J. 1993;64(3):803–812. doi: 10.1016/S0006-3495(93)81441-3. [DOI] [PMC free article] [PubMed] [Google Scholar]
- 4.Edelman RR, Siewert B, Darby DG, Thangaraj V, Nobre AC, Mesulam MM, Warach S. Qualitative mapping of cerebral blood flow and functional localization with echo-planar MR imaging and signal targeting with alternating radio frequency. Radiology. 1994;192(2):513–520. doi: 10.1148/radiology.192.2.8029425. [DOI] [PubMed] [Google Scholar]
- 5.Detre JA, Leigh JS, Williams DS, Koretsky AP. Perfusion imaging. Magn Reson Med. 1992;23(1):37–45. doi: 10.1002/mrm.1910230106. [DOI] [PubMed] [Google Scholar]
- 6.Norris DG, Zysset S, Mildner T, Wiggins CJ. An investigation of the value of spin-echo-based fMRI using a Stroop color-word matching task and EPI at 3 T. Neuroimage. 2002;15(3):719–726. doi: 10.1006/nimg.2001.1005. [DOI] [PubMed] [Google Scholar]
- 7.Duong TQ, Yacoub E, Adriany G, Hu X, Ugurbil K, Vaughan JT, Merkle H, Kim SG. High-resolution, spin-echo BOLD, and CBF fMRI at 4 and 7 T. Magn Reson Med. 2002;48(4):589–593. doi: 10.1002/mrm.10252. [DOI] [PubMed] [Google Scholar]
- 8.Parkes LM, Schwarzbach JV, Bouts AA, Deckers RH, Pullens P, Kerskens CM, Norris DG. Quantifying the spatial resolution of the gradient echo and spin echo BOLD response at 3 Tesla. Magn Reson Med. 2005;54(6):1465–1472. doi: 10.1002/mrm.20712. [DOI] [PubMed] [Google Scholar]
- 9.Talagala SL, Ye FQ, Ledden PJ, Chesnick S. Whole-brain 3D perfusion MRI at 3.0 T using CASL with a separate labeling coil. Magn Reson Med. 2004;52(1):131–140. doi: 10.1002/mrm.20124. [DOI] [PubMed] [Google Scholar]
- 10.Xu Q, Glielmi C, Zhou L, Choi K, Hu X. An inexpensive and programmable RF transmitter setup for two-coil CASL. Concepts in Magnetic Resonance Part B (Magnetic Resonance Engineering) 2008;33B(4):228–235. doi: 10.1002/cmr.b.20127. [DOI] [PMC free article] [PubMed] [Google Scholar]
- 11.Schwarzbauer C. Simultaneous detection of changes in perfusion and BOLD contrast. NMR Biomed. 2000;13(1):37–42. doi: 10.1002/(sici)1099-1492(200002)13:1<37::aid-nbm611>3.0.co;2-0. [DOI] [PubMed] [Google Scholar]
- 12.Yang Y, Gu H, Zhan W, Xu S, Silbersweig DA, Stern E. Simultaneous perfusion and BOLD imaging using reverse spiral scanning at 3T: characterization of functional contrast and susceptibility artifacts. Magn Reson Med. 2002;48(2):278–289. doi: 10.1002/mrm.10196. [DOI] [PubMed] [Google Scholar]
- 13.Wang J, Alsop DC, Song HK, Maldjian JA, Tang K, Salvucci AE, Detre JA. Arterial transit time imaging with flow encoding arterial spin tagging (FEAST) Magn Reson Med. 2003;50(3):599–607. doi: 10.1002/mrm.10559. [DOI] [PubMed] [Google Scholar]
- 14.Talagala SL, Ye FQ, Ledden PJ, Chesnick S. Whole-brain 3D perfusion MRI at 3.0 T using CASL with a separate labeling coil. Magn Reson Med. 2004;52(1):131–140. doi: 10.1002/mrm.20124. [DOI] [PubMed] [Google Scholar]
- 15.Herscovitch P, Raichle M. What is the correct value for the brain-blood partition coefficient for water? J Cerb Blood Flow Metab. 1985;5:65–69. doi: 10.1038/jcbfm.1985.9. [DOI] [PubMed] [Google Scholar]
- 16.Genovese CR, Lazar NA, Nichols T. Thresholding of statistical maps in functional neuroimaging using the false discovery rate. Neuroimage. 2002;15(4):870–878. doi: 10.1006/nimg.2001.1037. [DOI] [PubMed] [Google Scholar]
- 17.Leontiev O, Buxton RB. Reproducibility of BOLD, perfusion, and CMRO2 measurements with calibrated-BOLD fMRI. Neuroimage. 2007;35(1):175–184. doi: 10.1016/j.neuroimage.2006.10.044. [DOI] [PMC free article] [PubMed] [Google Scholar]
- 18.Mildner T, Trampel R, Moller HE, Schafer A, Wiggins CJ, Norris DG. Functional perfusion imaging using continuous arterial spin labeling with separate labeling and imaging coils at 3 T. Magn Reson Med. 2003;49(5):791–795. doi: 10.1002/mrm.10438. [DOI] [PubMed] [Google Scholar]
- 19.Aguirre GK, Detre JA, Zarahn E, Alsop DC. Experimental design and the relative sensitivity of BOLD and perfusion fMRI. Neuroimage. 2002;15(3):488–500. doi: 10.1006/nimg.2001.0990. [DOI] [PubMed] [Google Scholar]
- 20.Lu H, Golay X, Pekar JJ, Van Zijl PC. Sustained poststimulus elevation in cerebral oxygen utilization after vascular recovery. J Cereb Blood Flow Metab. 2004;24(7):764–770. doi: 10.1097/01.WCB.0000124322.60992.5C. [DOI] [PubMed] [Google Scholar]


