Abstract
The development of lymphoid cells from bone marrow progenitors is dictated by interplay between internal cues such as transcription factors and external signals like the cytokines Flt-3 ligand and Il-7. These proteins are both of large importance for normal lymphoid development; however, it is unclear if they act in direct synergy to expand a transient Il-7R+Flt-3+ population or if the collaboration is created through sequential activities. We report here that Flt-3L and Il-7 synergistically stimulated the expansion of primary Il-7R+Flt-3+ progenitor cells and a hematopoietic progenitor cell line ectopically expressing the receptors. The stimulation resulted in a reduced expression of pro-apoptotic genes and also mediated survival of primary progenitor cells in vitro. However, functional analysis of single cells suggested that the anti-apoptotic effect was additive indicating that the synergy observed mainly depends on stimulation of proliferation. Analysis of downstream signaling events suggested that although Il-7 induced Stat-5 phosphorylation, Flt-3L caused activation of the ERK and AKT signaling pathways. Flt-3L could also drive proliferation in synergy with ectopically expressed constitutively active Stat-5. This synergy could be inhibited with either receptor tyrosine kinase or MAPK inhibitors suggesting that Flt-3L and Il-7 act in synergy by activation of independent signaling pathways to expand early hematopoietic progenitors.
Keywords: Bone Marrow, Cell Differentiation, Interleukin, Leukocyte, Lymphocyte, Flt-3, Interleukin 7
Introduction
The development of lymphoid cells from hematopoietic stem cells in the bone marrow (BM)2 is regulated by interplay between transcription factors and extracellular stimuli provided by the microenvironment (1, 2). Among the external cues are cytokines such as Flt-3 ligand (Flt-3L) acting through FMS-like tyrosine kinase-3 (Flt-3) (3, 4) and interleukin-7 (Il-7) that interacts with the Il-7 receptor (Il-7R). Even though Flt-3 is expressed already on a subpopulation of the multipotent lineage (Lin)−Sca-1+Kit+ (LSK) cells (5, 6), Flt-3 surface expression coincides with a reduced megakaryocyte and erythroid potential (7, 8). Mice lacking either Flt-3 or Flt-3L display normal levels of lymphocytes in the periphery, but upon investigation of the early progenitor populations, it is apparent that these mice have reduced numbers of Flt-3+ LSK cells as well as common lymphoid progenitors (CLPs) in the BM (9–11). The expression of the Il-7R is more restricted within the early progenitor compartments, and although a small subpopulation of the Flt-3-positive LSK cells co-express Il-7R (7), the expression is mainly limited to lymphoid-restricted progenitors such as the common lymphoid progenitor (CLP) (12). Mice lacking either Il-7 (13) or a functional Il-7R (14) display developmental disruptions in early lymphoid compartments with reductions of both B- and T-cell progenitors. Thus, Flt-3L and Il-7 are independently important for the normal development of early lymphoid progenitors. Targeted disruption of both signaling pathways resulted in an enhancement of the phenotype in such way that no peripheral B-lymphocytes or serum immunoglobulin could be detected (15). Substantial amounts of T-lymphocytes were found in the periphery of these mice (15), but these cells displayed signs of memory T-cells (16), indicating that they arose from expansion of a limited number of progenitor cells. T-cell development could be largely rescued through ectopic expression of Bcl-2 (17) suggesting that Flt-3L and Il-7 display a permissive role during T-cell differentiation. However, even though Il-7 stimulates survival and expansion of early B-cell progenitors, ectopic expression of Bcl-2 is insufficient to rescue B-lymphopoiesis in Il-7 receptor-deficient mice (18), suggesting that Il-7 signaling may have additional roles in the generation of B-lymphoid cells.
Thus, it is established that Flt-3L and Il-7 stimulate lymphopoiesis in a coordinate manner (15, 19–21). It is, however, unclear if this is through a sequential activity of the two cytokines or through a direct functional synergy. By investigating primary mouse bone marrow cells as well as the hematopoietic progenitor cell line BaF3 ectopically expressing both Il-7 and Flt-3L receptors, we suggest that the two cytokines have an additive anti-apoptotic effect while stimulating proliferation in a synergistic manner. The synergy appeared dependent on Stat-5 activation by Il-7 and Flt-3L-mediated receptor tyrosine kinase activation, suggesting that the synergy is mediated by parallel activation of separate signaling pathways.
MATERIALS AND METHODS
Mice
C57BL/6 mice were housed at the Linköping University animal facility in line with Swedish legal regulations. All experiments were conducted with permission from the Linköping ethical committee.
Cell Culture Conditions
BaF3 cells (22) were grown in RPMI 1640 medium supplemented with l-glutamine, with 10% fetal calf serum (FCS, HyClone), 25 mm HEPES, 50 μg/ml gentamicin, 50 μm 2-β-mercaptoethanol (Sigma), and 10% conditioned medium from confluent WEHI-3 cells as a source of interleukin-3. Phoenix-Ampho cells were grown in Dulbecco's modified Eagle's medium supplemented with GlutaMAX (+4.5 g/ld-glucose + pyruvate), 10% FCS, and 50 μg/ml gentamicin. Primary cells were grown in Opti-MEM, with 10% FCS, 50 μm 2-β-mercaptoethanol, and 50 μg/ml gentamicin. All cells were kept at 37 °C with 5% CO2. All reagents unless otherwise indicated were purchased from Invitrogen. LY294002 was from Calbiochem, and AG1295 was purchased from Sigma. SL327 was from Tocris Bioscience, and U0126 was from In Vitro.
Flow Cytometry and Sorting
8–12-Week-old C57BL/6 mice were sacrificed, and BM was harvested from femur, tibia, and crista iliaca. CLP gates were determined with the strategy described previously (23), and the following PECy5-conjugated antibodies were used for lineage: Gr-1 (RB6–8C5), Mac-1 (M1/70), Ter-119, CD3 (17A2, BD), CD19 (6D5), and B220 (RA3–6B2). The remaining antibodies were Sca-1 FITC (E13–161.7), Kit APC (2B8), and Flt-3 PE (A2F10, eBioscience). Il-7R was detected by biotin conjugate (A7R34, eBioscience) and visualized by streptavidin PECy7. All antibodies unless otherwise indicated were purchased from BioLegend, and clone names are shown in parentheses. Before sorting with FACSAria Special Order SystemTM (BD Biosciences), whole BM was enriched for Kit+ cells by labeling with Kit/CD117 MicroBeads and separation by MACS columns (Miltenyi Biotec). Dead cells were stained with propidium iodide (Invitrogen) and excluded by electronic gating. Negative staining controls were used to distinguish positive and negative populations.
Generation of BaF3Flt-3,Il-7Rα Cells
BaF3 were transduced in RetroNectin-coated 6-well plates with Il-7R-GFP (24) retrovirus generated by transient transfection of Phoenix-Ampho packaging cells and sorted for expression of GFP with FACSAria. Stably transduced GFP+ cells were electroporated with a Flt-3 encoding LXSN6 vector backbone and selected with 600 μg/ml geneticin (Invitrogen). After selection, the cells were resorted for expression of GFP and Flt-3 with BD FACSAria (BD Biosciences) to obtain BaF3 Flt-3,Il-7Rα cells. Next, BaF3Flt-3,Il-7Rα cells were stained with Flt-3 PE (A2F10, eBioscience), and Il-7R biotin conjugate (A7R34, eBioscience, visualized by streptavidin PECy7), and double-positive cells were sorted with FACSAria Special Order SystemTM (BD Biosciences).
Retrovirus Production and Spin Infection of BaF3Flt-3,Il-7Rα
Phoenix-Ampho were transfected at 60–80% confluency with either constitutively active Stat-5A (caStat-5A) pMXs-puro or pMXs-puro viral expression vectors and pGag-Pol and pVSV-G encoding plasmids. 48 h after transfection, 2 μg/ml puromycin (Sigma) was added to the growth medium, and after 1 week of selection, virus supernatants were filtered through a 0.45-μm syringe filter. BaF3Flt-3,Il-7R cells were suspended in 1 volume of growth medium plus 1 volume of filtered virus supernatant, after which Polybrene (Sigma) was added at a final concentration of 3 μg/ml. Cells were centrifuged for 1.5 h at 25 °C, 1200 × g and incubated at 37 °C with 5% CO2. The medium was replenished 18–20 h following infection, and 36 h after infection, cells were selected with 2 μg/ml puromycin for 10 days. BaF3caStat-5,Flt-3 were produced in the same fashion. An initial infection with caStat-5A pMXs-puro vector and selection with puromycin was followed by a second infection with Flt-3 LXSN6 vector backbone and selection with 600 μg/ml geneticin (Invitrogen) for 10 days.
Cell Stimulation Conditions
BaF3, BaF3Flt-3,Il-7Rα, and BaF3caStat-5,Flt-3 cells were cytokine deprived for 16 h and then seeded at a density of 10,000 or 50,000 cells/ml and supplemented with 1, 2, 5, or 10 ng/ml of murine recombinant cytokines Flt-3L and Il-7 (both from PeproTech). Cells receiving WEHI-3, or no stimulants, were seeded as controls. Viable cells were counted at 48- or 72-h intervals using trypan blue exclusion. For primary cell in vitro proliferation experiments, CLPs sorted into complete growth media were seeded in 4400 cells in 200 μl of media in 96-well plates with 10 ng/ml of Flt-3L and/or Il-7. Viable cells were counted by trypan blue exclusion. For quantitative real time PCRs (qPCR), CLPs were seeded 16,000/ml with 10 ng/ml Flt3-L and/or IL-7 and harvested after 24 h. For single cell studies, CLPs were sorted into complete growth media supplemented with cytokines, and cells were then manually plated to achieve a density of one cell/well in Terasaki plates.
Reverse Transcriptase-PCR and Quantitative Real-time PCR
BaF3Flt-3,Il-7Rα mRNA and primary cell mRNA were extracted using RNeasy® mini kit and RNeasy® micro kit, respectively (Qiagen), according to the manufacturer's instructions, and DNase treatment was included. cDNA was generated by annealing total RNA to random primers (45 min at 40 °C and 5 min at 95 °C) in reaction mixture containing 1× first strand buffer, 7.5 mm DTT, 250 ng of random primer (Roche Applied Science), 0.5 mm dNTP (Roche Applied Science), 1 unit/μl RNaseOUT, and 5 units/μl SuperscriptIII reverse transcriptase (all reagents were from Invitrogen unless otherwise indicated). Quantitative real time PCR (Applied Biosystems, 7700 sequence detection system) was performed by mixing 2× TaqMan Universal PCR master mix, 20× hydrolysis probe and primer, RNase-free H2O, and 3 μl of cDNA (all reagents were from Applied Biosystems). The reaction was initiated by holding for 10 min at 95 °C, followed by 40 cycles of 15 s at 95 °C and 60 s at 60 °C. For primary cells, cDNA corresponding to 250 cells was used for each reaction (Applied Biosystems, 7900 sequence detection system), and the number of cycles increased to 45. Each reaction was performed in triplicate and was normalized to reference gene hypoxanthine-guanine phosphoribosyltransferase. Nontemplate controls were used for all samples. Relative RNA quantification was calculated using the comparative 2−ΔΔCT method (25). The following TaqMan hydrolysis probe and primers (Applied Biosystems) were used: hypoxanthine-guanine phosphoribosyltransferase, Mm00446968_ml; Bcl-XL, Mm00437783_ml; Bcl-2, Mm00477631_ml; Bad, Mm00432042_ml; and Bim, Mm01333921_m1.
Flow Cytometry Apoptosis Analysis
Cytokine- deprived BaF3Flt-3,Il-7Rα cells stimulated with 2 ng of Flt-3L + 2 ng of Il-7/ml were harvested after 24 and 36 h and stained for viability and apoptosis using annexinV-APC (BD Biosciences) and propidium iodide (Invitrogen). Ten thousand events were acquired using FACSCalibur and analyzed by FlowJo software (Tree Star, Inc.).
CFSE Cell Proliferation Analysis
CLPs were sorted as described above and immediately labeled with CFSE (Invitrogen). A small aliquot of labeled cells was taken immediately after staining to determine the starting intensity of the labeled cells. Remaining cells were then divided into nine individual wells, 8000 cells/well, and stimulated in triplicate with 10 ng/ml Flt-3L, 10 ng/ml Il-7, or 10 ng/ml Flt-3L and Il-7. Equal volume aliquots were then taken from all individual wells after proper resuspension and analyzed with FACSCanto (BD Biosciences) for CFSE intensity after 24, 48, and 70 h of incubation. At 48 and 70 h, samples were also stained with annexinV-APC (BD Biosciences) to investigate the fraction of pro-apoptotic cells under the different stimulation conditions.
Protein Extracts and Western Blot
For protein extraction, cells were washed in ice-cold PBS and immediately resuspended in lysis buffer containing 25 mm Tris (pH 7.5), 1% Triton X-100, 150 mm NaCl, 1 mm DTT, 1 mm EDTA (pH 8.0), 1× protease inhibitor mixture (Roche Applied Science), and 1 mm Na3VO4. Samples were centrifuged 1000 × g for 2 min and supernatant was mixed with 1× LDS sample buffer (Invitrogen) and 0.01 m DTT. Samples were heated at 70 °C for 10 min before separated by SDS-PAGE and blotted onto a HybondP PVDF transfer membrane (Amersham Biosciences). Membranes were blocked in 5% milk PBS/Tween or 5% BSA TBS/Tween for 1 h at room temperature and next incubated with primary antibodies for 1 h at room temperature or at 8 °C overnight. Following block, membranes were incubated with HRP-conjugated secondary antibody for 1 h at room temperature. Blots were developed by enhanced chemiluminescence (GE Healthcare). The following antibodies were used: phospho-ERK (Thr-202/Tyr-204), ERK (p44/p42), and phospho-STAT-5 (Tyr-694) were all from Cell Signaling Technology. Phospho-Foxo3a (Thr-32) was from Upstate Biotechnology, and Foxo3a antibody was from Abcam. Phospho-Akt (Ser-473) was from BIOSOURCE, and Akt antibody was from Santa Cruz Biotechnology. Glyceraldehyde-3-phosphate dehydrogenase (GAPDH) antibody was from Millipore. Secondary antibodies were horseradish peroxidase-conjugated and purchased from Jackson ImmunoResearch.
RESULTS
Flt-3 Ligand and Il-7 Act in a Synergistic Manner
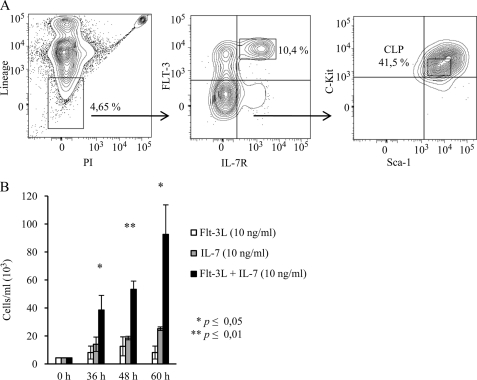
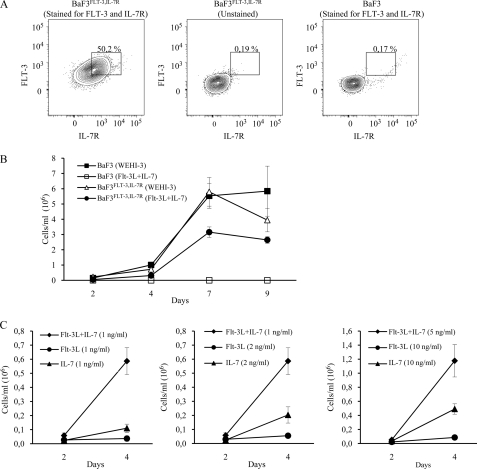
Although the overall readout of lymphoid development in mice deficient in Flt-3 and Il-7R signaling (15) and in vitro expansion experiments (19–21) suggests a collaborative function of these cytokines (15), it is unclear if they act in a sequential or direct synergistic manner. In the first scenario, the lack of Flt-3 function reduces the number of cells developing into the Il-7-dependent stage resulting in an enhanced phenotype, whereas in the second scenario, the factors act in a synergy at the molecular level on the same cell. To investigate this issue, we sorted Lin−Sca-1lowKitlowFlt-3+Il-7R+ BM cells, known to represent a lymphoid restricted progenitor cell (Fig. 1A) (23), and investigated the ability of Flt-3L, Il-7, or both to stimulate growth and expansion of cells in short term in vitro cultures (Fig. 1B). The inclusion of Flt-3L alone did not stimulate expansion, although Il-7 stimulated approximately a 6-fold increase in cell numbers. Inclusion of both cytokines resulted in an increased growth, generating more cells than either of the cytokines alone. Although it is difficult to exclude differentiation and selection of specific subpopulations, these data suggest that the two cytokines are able to act in synergy on the same cells. To investigate this further, we stably transduced the hematopoietic progenitor cell line BaF3 (22) with retroviral vectors expressing Flt-3 or the Il-7Rα subunit needed to make use of the endogenously expressed common γ chain to form a functional Il-7 receptor. Double-positive cells were selected through cell sorting based on Il-7R and Flt-3 surface expression (Fig. 2A) allowing us to create a stable system where stage-dependent sequential activities should not pose a complicating factor for the interpretation of the data. To investigate if the transduced receptors could mediate a functional response to the cytokines, we incubated the original BaF3 and the BaF3Flt-3,Il-7R cells (10,000 cells each per ml in 24-well plates) either with Il-3-containing media or Flt-3L and Il-7 (Fig. 2B). Viable cells, as judged by the ability to exclude trypan blue, were counted after 2, 4, 7, and 9 days of incubation. After 2 days, the number of BaF3 cells incubated with Il-3 had reached a 14.5-fold increase in cell number, a 100-fold increase at 4 days, and 550-fold increase at day 7. Incubation of BaF3 cells with Flt-3L and Il-7 resulted in a reduction to one-fifth of seeded cells at day 2, although no living cells could be detected after 4 or 7 days of incubation. Conducting the same experiment using the BaF3Flt-3,Il-7R cells resulted in similar expansions upon incubation with Il-3-containing media (22-fold day 2, 72-fold day 4, and 580-fold day 7), although the incubation with Flt-3L and Il-7 resulted in a 5-fold expansion at day 2, 31-fold at day 4, and 315-fold expansion after 7 days of incubation. In the absence of cytokines, the cells stopped growing, and the majority died after 4–5 days (data not shown). Thus, ectopic expression of Flt-3 and Il-7Rα allows for a functional response to the cytokines in vitro. To investigate the individual functions of Flt-3L and Il-7 as well as their ability to act in direct synergy, we incubated BaF3Flt-3,Il-7R cells with 1 ng of Flt-3L/ml resulting in a 2.7-fold expansion after 2 days and a 3.7-fold expansion at day 4 (Fig. 2C). The addition of 1 ng/ml Il-7 resulted in 2.3- and 11-fold expansion at 2 and 4 days, respectively. Thus, both Flt-3L and Il-7 have the ability to stimulate survival and expansion of BaF3Flt-3,Il-7R cells. Incubation of the BaF3Flt-3,Il-7R cells with the combination of 1 ng/ml Flt-3L and 1 ng/ml Il-7 resulted in an almost 6-fold expansion of cell numbers at day 2 and 59-fold increase at day 4 (Fig. 2C). These data reveal that Flt-3L and Il-7 were able to synergistically stimulate the expansion of hematopoietic progenitor cells. This functional synergy became even more obvious when the concentrations of individual cytokines were doubled to 2 ng/ml, providing further evidence for the functional synergy. The inclusion of 10 ng/ml of either Flt-3L or Il-7 resulted in an 8.5- and 50-fold increase in cell numbers, respectively, after 4 days of incubation, whereas 5 ng/ml of the cytokines in combination resulted in a 118-fold expansion of cell numbers after 4 days (Fig. 2C). Thus, Flt-3L and Il-7 were able to act in direct synergy to drive expansion of a hematopoietic progenitor population.
FIGURE 1.
Flt-3L and Il-7 act in a synergistic manner to stimulate expansion of common lymphoid progenitors (Lin−Sca-1lowKitlowFlt-3+Il-7R+). A, representative FACS analysis and purification scheme for sorting CLPs. PI, propidium iodide. B, CLPs were plated in triplicate at 4400 cells/well in a 96-well plate for each of the indicated conditions. Viable cells were counted by trypan blue exclusion at 36, 48, and 60 h. Error bars represent S.D. of three wells from one representative experiment, and p values were calculated using Student's t test.
FIGURE 2.
Flt-3L and Il-7 exhibit a synergistic proliferative effect on stably transfected BaF3Flt-3+Il-7R+ cells. A, BaF3Flt-3,Il-7R cells were stained for Flt-3 and Il-7R to distinguish double-positive cells (left panel). Unstained BaF3Flt-3,Il-7R (center panel) and Flt-3 and Il-7R-stained BaF3 (right panel) are displayed as negative controls. B, BaF3 and BaF3Flt-3,Il-7R cells were cultured with Flt-3L (10 ng/ml) and Il-7 (10 ng/ml), and the proliferative response was evaluated by counting viable cells using trypan blue exclusion at the indicated time points. Cells expanded with Il-3 containing WEHI-3 are included as controls. Error bars represent S.D. of three wells. C, individual and combined effects of Flt-3L and Il-7 on BaF3Flt-3,Il-7R cells were evaluated by trypan blue exclusion after 2 and 4 days of culture. Data represent the average number of cells/ml in six wells from two independent experiments. Error bars represent S.D. of six wells.
Flt-3L and Il-7 Stimulation Prevents Apoptosis Associated with Reduced Expression of Pro-apoptotic Genes
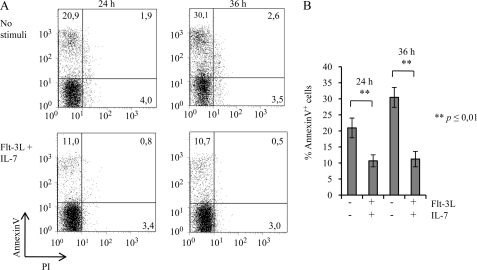
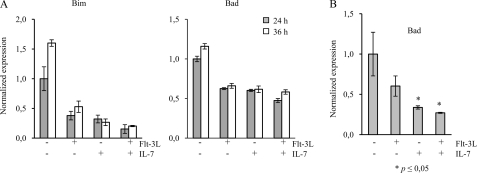
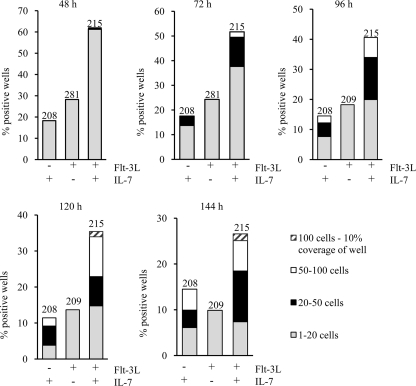
An expansion of cells could be a result of increased proliferation, but it could also involve anti-apoptotic effects working in conjunction with proliferation to expand a cell population. It has been suggested that both Flt-3L and Il-7 promote cell survival, and to investigate if the stimulation with these factors had any direct effect on apoptosis and apoptosis-related genes in the BaF3 cells, we incubated BaF3Flt-3,Il-7R cells with and without cytokines for 24 and 36 h. Although the percentage of annexinV-positive cells was around 10% in the cytokine-stimulated cells at both time points, the corresponding figures for the control cells incubated in medium without cytokines were 22 and 33%, respectively (Fig. 3, A and B). To investigate differences in the expression of apoptosis-related genes, we performed qPCR of Bcl-2 family member genes. Although the expression of anti-apoptotic genes such as Bcl-2 and Bcl-xl was largely unaffected, the expression of Mcl-1 was reduced upon incubation of BaF3Flt-3,Il-7R cells with Flt-3L and Il-7 (supplemental Fig. 1). Flt-3L, Il-7, or Flt-3L/Il-7 stimulation resulted in a reduction in expression of the pro-apoptotic genes Bad and Bim (Fig. 4A). The effect was at the most additive because the reduction obtained with either of the cytokines was comparable with that observed with both factors. This indicates that co-stimulation with Flt-3L and Il-7 reduces apoptosis of BaF3 cells and that this is associated with a reduction in expression of pro-apoptotic genes rather than induction of anti-apoptotic genes. To investigate if the two cytokines had any effect on the expression of Bad in primary cells, we stimulated CLPs with either Flt-3L, Il-7, or both for 24 h and analyzed the mRNA expression of Bad with qPCR (Fig. 4B). Stimulation with either of the two cytokines prevented up-regulation of Bad, an effect not dramatically affected by combining the two cytokines. This indicates that both Flt-3L and Il-7 promote cell survival, and because no apparent synergy could be observed, it appears that the major cause of the functional synergy with regard to cell expansion is increased proliferation. To investigate this further, we incubated CLPs plated at single cell density either with Flt-3L, Il-7, or both in Terasaki plates. After 48 h of incubation, the wells with visible cells were counted, and the clone size was estimated (Fig. 5). Although ∼18% of the wells stimulated with Il-7 contained a detectable cell or a small clone 48 h after plating, the corresponding figure for Flt-3L-stimulated cells was 29%. In the cultures incubated with the combination of the cytokines, more than 60% of the wells contained cells or small colonies. After 72 h of incubation, the percentage of wells with small clones was slightly lower; however, stimulation with either Il-7 or the combination of Il-7 and Flt-3L resulted in the generation of clones with more than 20 cells. However, although only about 3% of the Il-7-stimulated cells had generated clones of this size after 72 h, the combined stimulation generated about 12% of these clones and about 2% of clones containing more than 50 cells. The difference was persistent after 96 and 120 h where the percentage of large clones was higher in the Flt-3L +Il-7-stimulated cells than when Il-7 alone was added. We were unable to detect any clones with more than 20 cells in the Flt-3L-stimulated cells; however, ∼20% of the wells contained small clones after 4 days of incubation, a time point when no cells could be detected in control cultures incubated without the addition of cytokine (data not shown). These data indicate that Flt-3L and Il-7 both promote the survival of progenitor cells but that this effect is additive rather than synergistic, further supporting the idea that the observed synergy mainly involves increased proliferation.
FIGURE 3.
Combined administration of Flt-3L and Il-7 reduces the level of apoptosis of BaF3Flt-3+Il-7R+ cells. A, annexinV and propidium iodide (staining of BaF3Flt-3,Il-7R cells after stimulation for 24 and 36 h with 2 ng/ml Flt-3L + 2 ng/ml Il-7). Displayed is one representative group of flow cytometry plots where numbers represent percent of apoptotic cells (10,000 events analyzed). B, percent apoptosis in BaF3Flt-3,Il-7 cells at 24 and 36 h after stimulation with 2 ng/ml Flt-3L + 2 ng/ml Il-7. Data for nonstimulated sample at 24 h and nonstimulated sample at 36 h are the mean values from three different wells from two individual experiments. Data for Flt-3L+Il-7 at 24 h and Flt-3L+Il-7 at 36 h are the mean values from two individual experiments (total of five wells/time point). p values were calculated using Student's t test.
FIGURE 4.
Flt-3L and Il-7 reduce the expression of pro-apoptotic genes. A, expression of the apoptosis-related genes Bim and Bad was evaluated by qPCR after stimulation of BaF3Flt-3,Il-7R cells with 5 ng/ml Flt-3L and/or 1 ng/ml Il-7. Gene expression levels in cytokine-deprived nonstimulated cells at 24 h were set to 1 and used for relative comparison. Each column is derived from triplicate data and represents one representative out of two independent experiments. Error bars represent experimental error mean. B, CLPs were sorted and stimulated with 10 ng/ml Flt-3L, Il-7, or Flt-3L+Il-7. Expression of pro-apoptotic gene Bad was evaluated by qPCR at 24 h. Data are the means from three experiments, and error bars represent S.D. All samples were normalized to endogenous hypoxanthine-guanine phosphoribosyltransferase expression. p values were calculated using Student's t test and represent comparison between stimulated samples and no stimulation control.
FIGURE 5.
Functional collaboration between Flt-3L and Il-7 is mediated both at the level of survival and proliferation. CLPs were sorted by FACS, plated on Terasaki plates at single cell density, and stimulated with Flt-3L, Il-7, or Flt-3L+Il-7 (10 ng/ml of each). Clone size was evaluated at five time points. The y axis represents percent positive wells of the total number of wells used for each condition. Numbers above bars represent total number of wells per stimulation. Data have been collected from two independent experiments with similar results.
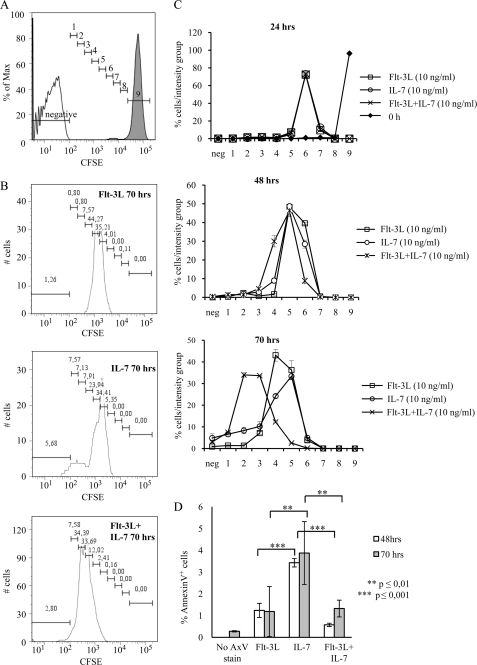
To investigate this further, we stained primary CLPs with CFSE (Fig. 6). The fluorescing dye-protein adducts that form in labeled cells are diluted upon cell division, thereby providing information about the number of cells that proliferated and the relative number of divisions they have undergone during a defined time. In theory, this should result in a series of sharp peaks each defining one cell cycle; however, using primary cells, we noted a degree of heterogeneity; and we therefore divided the analysis window into 10 gates based on the fluorescent signal from unstained and stained cells analyzed immediately after labeling. We then estimated the number of cells at the different time points (supplemental Fig. 2) as well as the distribution of cells in each of the gates (Fig. 6). No differences between Flt-3L, Il-7, or the combination could be detected at 24 h after stimulation. The signal was, however, weaker than in the newly stained cells in all the samples, suggesting that the majority of the cells had undergone division. At 48 h after stimulation, 30% of the Flt-3L/Il-7 cells had reached gate 4, although only about 10% of the Il-7 and 2% of the Flt-3L-stimulated cells had lost this amount of fluorescence. The difference became even larger after 70 h of stimulation because the absolute majority of the cells stimulated by the combination of Flt-3L and Il-7 had reached intensity level 2 or 3, although only ∼20% of the Il-7-stimulated and 10% of the Flt-3L-stimulated cells displayed the same loss of signal. The fraction of cells in gate one was, however, comparable in the Il-7- and Il-7/Flt-3L-stimulated cells. When we analyzed the labeled cells after 70 h of incubation, we included an APC-conjugated anti-annexinV antibody to estimate the amount of pro-apoptotic cells in the cultures. This revealed that there were no significant differences between the samples incubated with Flt-3L, Il-7, or both, further supporting the idea that there is no dramatic synergy between the cytokines with regard to inhibition of apoptosis. We believe these data are well in line with the single cell analysis because it indicates that although Il-7 is sufficient to stimulate expansion of a few cells, the combination of the cytokines promotes more divisions of a larger fraction of the cells.
FIGURE 6.
Combined stimulation with Flt-3L and Il-7 increases both the rate of cell proliferation and the frequency of dividing cells. CFSE-labeled CLPs were plated in triplicate at 8000 cells/well in a 96-well plate for each of the indicated conditions (10 ng/ml of each cytokine), for a total of nine individual wells. Equal volumes from all individual wells were analyzed by flow cytometry at 24, 48, and 70 h. A, CFSE axis (FITC) was divided into 10 intensity groups; negative, based on the intensity of unstained (open histogram), and 9, CFSE-labeled cells instantly after labeling (filled histogram). Groups 1–8 are arbitrarily chosen to cover the entire spectra between negative gate and gate 9. B, shown is one representative plot from each of the three conditions at the 70-h time point. C, summarized data of CFSE intensity in CLPs at different time points after stimulation with indicated cytokines. Error bars represent S.D. from three individual wells from one out of two separate sorting experiments. D, CFSE-labeled cells were stained with annexinV-APC as an indicator of apoptosis. Data at the 48-h time point is the result of one sorting experiment, and error bars represent S.D. of three individual wells per condition. Data at the 70-h time point is the result of two separate sorting experiments, and error bars represent S.D. of 5–6 individual wells per condition. p values were calculated using Student's t test.
Il-7 and Flt-3L Activate Independent Signaling Pathways upon Co-stimulation
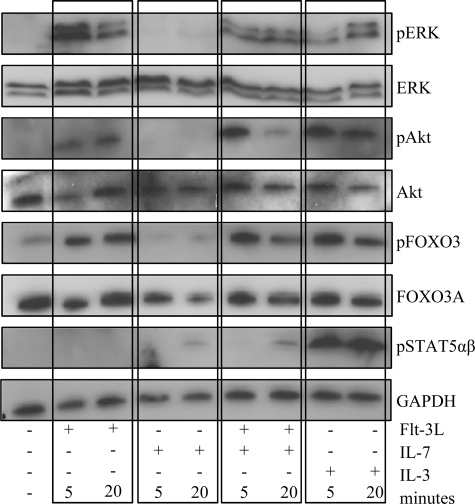
A functional synergy between two signaling pathways may be mediated at different levels. These may involve direct receptor cross-talk in the cell membrane resulting in increased activation of common signaling pathways or independent activation of signaling mechanisms acting in synergy further downstream in the cascade. To investigate this, we incubated BaF3Flt-3,Il-7R cells with either Il-7, Flt-3L, or both and investigated the short term cellular response with regard to activation of Stat-5, AKT, and ERK signaling pathways (Fig. 7) Stimulation with Il-7 induced phosphorylation of Stat-5, although we were unable to detect any activation of the AKT or ERK signaling pathways. In contrast, activation with Flt-3L induced phosphorylation of ERK, AKT, and Foxo-3, although we could not detect any phosphorylation of Stat-5. Stimulation with both cytokines resulted in the activation of all three pathways to a level comparable with that of either of the cytokines alone, suggesting that the stimulation results in independent activation of the investigated signaling pathways.
FIGURE 7.
Il-7R and Flt-3 signaling activate separate signaling pathways after stimulation. BaF3Flt-3,Il-7 cells were starved overnight and thereafter stimulated by the addition of 30 ng/ml of cytokine for 5 or 20 min. Flt-3L and Il-7 were used in single and double stimulations, and 30 ng/ml Il-3 was used as positive control. Using Western blot, the phosphorylation status of downstream signaling molecules was investigated. Shown are blots from one representative out of two independent experiments. The Akt immunoblot is displayed with increased brightness (30%) and contrast (70%) as compared with the original scan.
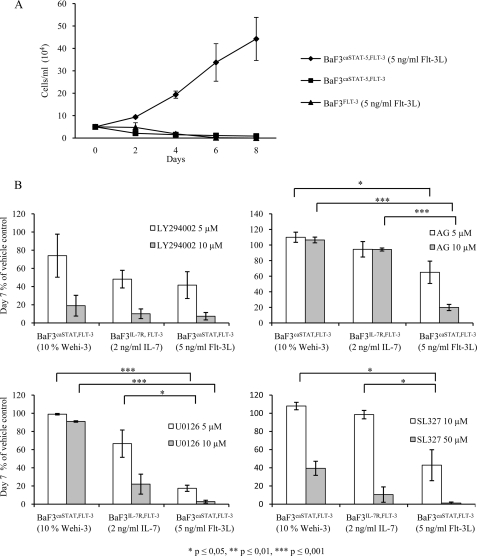
These data would suggest that one major function of Il-7 would be to induce Stat-5 activation. To investigate if this transcription factor was able to directly enhance a signal from the Flt-3 receptor in the absence of a functional Il-7R, we generated BaF3Flt-3 cells and transduced them with a retrovirus constitutively expressing an active form of Stat-5 (Fig. 8A). BaF3Flt-3 cells receiving 5 ng/ml Flt-3L were unable to expand, and we were not able to observe expansion of the BaF3Flt-3 cells transduced with the active Stat-5A. However, when these cells were incubated in the presence of Flt-3L, we noted a dramatic expansion of cells in the cultures. Thus, we conclude that Flt-3L-induced signals have the potential to functionally synergize with activated Stat-5 to mediate expansion of hematopoietic progenitor cells. To further investigate the signaling mechanisms involved in the functional synergy, we compared the effect of signaling inhibitors on the cell growth of BaF3Flt-3,Il-7R stimulated with WEHI-3-conditioned media, Il-7, or their caStat-5A transduced counterpart stimulated with Flt-3L (Fig. 8B). Inhibition of the PI3K-AKT pathway by the addition of the PI3K inhibitor LY294002 had a strong negative effect on cell growth regardless of the means of stimulation suggesting that this inhibitor block cell growth in an unspecific manner. Inclusion of the receptor tyrosine kinase inhibitor AG1295, directly inhibiting the activity of the Flt-3 receptor, reduced the growth of Flt-3L-stimulated cells to a larger extent than that of WEHI-3- or Il-7-stimulated cells supporting the notion that the observed synergy involved canonical Flt-3 signaling. The MAPK inhibitors SL327 or U0126 both resulted in dramatic inhibition of cell proliferation of the Flt-3L-stimulated cells, although the effect on WEHI-3- or Il-7-stimulated cells was significantly less obvious at the low inhibitor concentrations. To investigate if we could link the expression of pro-apoptotic genes to MAPK signaling, we incubated caStat-5A-transduced BaF3Flt-3 cells with U0126, which is the MAPK inhibitor giving the most selective effect on Flt-3L-induced cell expansion, and we investigated the expression of pro-apoptotic genes by qPCR. In the absence of Flt-3L, we noted a modest increase in the amount of Bad and Bim message (supplemental Fig. 3). Inclusion of U0126 prevented the Flt-3L-induced reduction of the pro-apoptotic genes. This suggests that in order for Flt-3L to stimulate cell expansion together with Stat-5A, there is a need for activation of both the PI3K-AKT and MAPK pathways.
FIGURE 8.
Proliferative synergy between Stat-5 and Flt-3L is dependent on a combination of simultaneously activated PI3K and MAPK signaling pathways. A, BaF3caStat-5,Flt-3 and BaF3Flt-3 cells were plated 50,000 cells/ml and stimulated with 5 ng/ml Flt-3L and counted using trypan blue exclusion at 2, 4, 6, and 8 days of culture. Nonstimulated BaF3caStat-5,Flt-3 cells are included as control. Shown is one representative out of six experiments. Data are the mean of four wells per condition, and error bars represent S.D. B, BaF3caStat-5,Flt-3 cells were plated and treated with indicated signaling pathway inhibitors after which viable cells were counted at day 7 using trypan blue exclusion. Inhibitors used were MEK1/2 (MAPK-ERK pathway) inhibitors SL327 and U0126, PI3K inhibitor LY294002, and receptor tyrosine kinase inhibitor AG1295. Each data point is the mean of means from 2 to 4 experiments, where each mean consists of 3–4 individual wells per condition. Error bars represent S.E., and p values were calculated using Student's t test. LY, LY294002; AG, AG1295; U, U0126.
DISCUSSION
One of the most central events in hematopoiesis is the dramatic expansion of progenitor cells needed to allow for a limited number of stem cells to daily produce the billions of blood cells crucial to maintain homeostasis. This is largely achieved through the actions of permissive cytokines acting either on multipotent or on more or less lineage-restricted progenitors. In the case of lymphoid cells, two of the most important cytokines for the expansion of the earliest progenitors are Flt-3L (9–11) and Il-7 (13, 14). Even though these cytokines are independently important for normal development of lymphoid cells, the enhanced effect of combined inactivation of both factors (15) and the functional synergy of the two factors on B-cell development in vitro (19–21) strongly suggest that they collaborate to drive the expansion of early lymphocyte precursors. The finding that Flt-3L-deficient mice have a reduced fraction of Il-7R+ cells could be the result that Flt-3L acts upstream of Il-7 causing a partial block in development. This block would then be further enhanced in the Flt-3L/Il-7 double-deficient mice because the few generated cells cannot be expanded by Il-7. In this model, the cytokines would act sequentially without any intracellular cross-talk. However, our data suggest that Flt-3L and Il-7, in concert with the sequential activities, act in direct synergy to expand early lymphoid progenitor compartments. It has been reported that Il-7 is able to induce the expression of anti-apoptotic genes such as Mcl-1 (26); however, our investigations suggest that Il-7 is able to stimulate both survival and proliferation of BaF3 cells even though they appear unable to activate Mcl-1 transcription in response to Il-7 stimulation. It rather appears as if the cytokine signals in these cells are counteracting cell death through a reduced expression of pro-apoptotic proteins. Even though Flt-3L and Il-7 both appear able to reduce apoptosis, our data would suggest that the major contribution to the synergy observed on overall expansion of the cells is due to increased proliferation. The single cell and the CSFE staining experiments do to a certain degree allow for a separation of survival and proliferation effects and thereby provide support for a model where Flt-3L alone appears rather inefficient to stimulate cell growth in the absence of Il-7. However, although Il-7 alone appears able to stimulate expansion of a fraction of the Flt-3+Il-7R+ cells, this effect is not comparable with the combined effects of Flt-3L and Il-7 (Figs. 5 and 6). This indicates that the two cytokines act in direct synergy to stimulate proliferation, although the effect on reduction of apoptosis is at the most additive. The combined expression of Flt-3 and Il-7R is limited to the CLP (12) compartment and to a small fraction of the lymphoid-primed multipotent progenitor (7), creating a narrow stage of lymphoid development in which this synergistic mechanism may act. Nevertheless, the mechanism suggested from our experiments may be of relevance also at other developmental stages. The expression of Flt-3 is mutually exclusive to that of CD19 expressed on early committed B-cell progenitors due to active suppression of the Flt3 gene by the transcription factor Pax-5 (27). Pax-5 is a central regulator in early B-cell development where it acts to repress alternative cell fates as well as to stimulate expression of B-lineage genes. Among these are crucial components of the pre-B-cell receptor (28) as well as immunoglobulin V to DJ recombination per se (29). Although Pax-5-mediated repressions of genes like Notch-1 (30) and Csfr1 (31) have clear implications in the restriction of alternative cell fates, the repression of Flt-3 transcription is less obvious. However, considering the findings showing that Il-7 signaling works in synergy with the pre-B-cell receptor to specifically drive the expansion of progenitor cells that have rearranged a functional Ig heavy chain (32), nonrestricted expression of the Flt-3 receptor could short circuit this mechanism. Thus, a functional pre-B-cell receptor would no longer be a critical factor for expansion of the progenitor pool with a continued expression of Flt-3. However, because pre-B-cell receptor signaling likely results in activation of additional signaling pathways that are not regulated by Flt-3, this receptor will not be able to fully substitute for a pre-B-cell receptor and thereby support further development into the B-lineage. This could also explain the block in differentiation observed upon ectopic expression of Flt-3 in normal progenitor cells (27) because this would allow for an expansion of dysfunctional B-lymphocyte progenitors unable to proceed in the developmental pathway due to a defective B-cell receptor.
In addition to a role in the expansion of the progenitor pool, it has been suggested that Il-7 signals are instructive in such way that they drive the development of multipotent progenitors into B-lymphoid cell fate. CLPs purified from Il-7-deficient mice have been reported to display a dramatically reduced B-lymphoid potential that can be partly rescued by ectopic expression of the transcription factor Ebf-1 (33). Expression of Ebf-1 has been directly linked to Il-7 signaling due to the ability of Stat-5 to induce Ebf-1 expression as well as to partially rescue B-cell development in the absence of Il-7 signaling (34). A model where Il-7 signaling directly regulates the expression of Ebf-1 provides a tempting possibility to explain how Il-7 drives differentiation of progenitors into the B-lineage because this transcription factor is critical for the transcription of B-lineage associated genes even in the CLP compartment (35). This is likely to be of relevance for commitment into B-lineage because even though there have been data suggesting that B-lineage progenitors display a dramatic plasticity to the CD19+ stages (36), recent findings using reporter genes or the surface marker LY6D (37–39) suggest that the CLP compartment is heterogenic and contains a substantial fraction of B-lineage restricted progenitor cells. Among the target genes for Ebf-1 are several of the genes encoding components of the pre-B-cell receptor as well as transcription factors such as Foxo1, Pou2af1, and Pax-5 (35). Thus, a model where Il-7 directly regulates the Ebf-1 gene presents an elegant explanation for how Il-7 could be instructive for B-lineage development. To investigate if Flt-3L could collaborate with Il-7 or Stat-5 to induce Ebf-1 transcription in the BaF3 cells, we stimulated receptor or transcription factor-transfected BaF3 cells with Il-7 and/or Flt-3L and measured the amount of Ebf-1 transcript by qPCR. None of the combinations was able to induce any significant expression of the endogenous Ebf-1 gene suggesting that active Stat-5 or Il-7 signaling per se is not sufficient to induce transcription from a silent Ebf-1 gene (data not shown). Thus, the action of Stat-5 on the Ebf-1 gene may be context-dependent and limited to cells where the gene has already been activated by other transcription factors such as PU.1 (24), E2A (40–42), or Ikaros (43). Hence, although we have been able to show a strong synergy between Flt-3L and Il-7 to stimulate cell growth, we have not found any evidence whether they are able to drive differentiation in a synergistic manner.
The understanding of how the Il-7 and Flt-3L signals collaborate also has implications for malignant hematopoiesis because mutated Flt-3 proteins found in myeloid leukemia have been shown to be able to activate Stat-5 (44). Such a mutation would not only modulate the normal signaling function of the receptor but also create a situation that the Stat-5 activation can augment the growth-stimulatory effects of receptor tyrosine kinase-mediated signaling events stimulated from either the mutated or a normal receptor encoded by a normal allele. We believe that the continued investigations of how extracellular signaling pathways interact with transcription factor networks will be of crucial importance for the understanding of normal and malignant hematopoiesis.
Supplementary Material
Acknowledgments
We are grateful to Dr. Xialong Fan for help with reagents and to Liselotte Lenner and Anders Delleskog for excellent technical assistance.
This work was supported by the Swedish Cancer Foundation (Cancerfonden), The Swedish Research Council (Vetenskapsrådet), The Childhood Cancer Foundation (Barncancerfonden), and Linköping University.

The on-line version of this article (available at http://www.jbc.org) contains supplemental Figs. 1–3.
- BM
- bone marrow
- CLP
- common lymphoid progenitor
- Il-7R
- Il-7 receptor
- CFSE
- carboxyfluorescein diacetate succinimidyl ester
- qPCR
- quantitative PCR
- APC
- allophycocyanin.
REFERENCES
- 1.Laiosa C. V., Stadtfeld M., Graf T. (2006) Annu. Rev. Immunol. 24, 705–738 [DOI] [PubMed] [Google Scholar]
- 2.Nagasawa T. (2006) Nat. Rev. Immunol. 6, 107–116 [DOI] [PubMed] [Google Scholar]
- 3.Hannum C., Culpepper J., Campbell D., McClanahan T., Zurawski S., Bazan J. F., Kastelein R., Hudak S., Wagner J., Mattson J., et al. (1994) Nature 368, 643–648 [DOI] [PubMed] [Google Scholar]
- 4.Lyman S. D., James L., Vanden Bos T., de Vries P., Brasel K., Gliniak B., Hollingsworth L. T., Picha K. S., McKenna H. J., Splett R. R., et al. (1993) Cell 75, 1157–1167 [DOI] [PubMed] [Google Scholar]
- 5.Ikuta K., Weissman I. L. (1992) Proc. Natl. Acad. Sci. U.S.A. 89, 1502–1506 [DOI] [PMC free article] [PubMed] [Google Scholar]
- 6.Li C. L., Johnson G. R. (1995) Blood 85, 1472–1479 [PubMed] [Google Scholar]
- 7.Adolfsson J., Månsson R., Buza-Vidas N., Hultquist A., Liuba K., Jensen C. T., Bryder D., Yang L., Borge O. J., Thoren L. A., Anderson K., Sitnicka E., Sasaki Y., Sigvardsson M., Jacobsen S. E. (2005) Cell 121, 295–306 [DOI] [PubMed] [Google Scholar]
- 8.Yang L., Bryder D., Adolfsson J., Nygren J., Månsson R., Sigvardsson M., Jacobsen S. E. (2005) Blood 105, 2717–2723 [DOI] [PubMed] [Google Scholar]
- 9.Mackarehtschian K., Hardin J. D., Moore K. A., Boast S., Goff S. P., Lemischka I. R. (1995) Immunity 3, 147–161 [DOI] [PubMed] [Google Scholar]
- 10.Sitnicka E., Bryder D., Theilgaard-Mönch K., Buza-Vidas N., Adolfsson J., Jacobsen S. E. (2002) Immunity 17, 463–472 [DOI] [PubMed] [Google Scholar]
- 11.McKenna H. J., Stocking K. L., Miller R. E., Brasel K., De Smedt T., Maraskovsky E., Maliszewski C. R., Lynch D. H., Smith J., Pulendran B., Roux E. R., Teepe M., Lyman S. D., Peschon J. J. (2000) Blood 95, 3489–3497 [PubMed] [Google Scholar]
- 12.Kondo M., Weissman I. L., Akashi K. (1997) Cell 91, 661–672 [DOI] [PubMed] [Google Scholar]
- 13.von Freeden-Jeffry U., Vieira P., Lucian L. A., McNeil T., Burdach S. E., Murray R. (1995) J. Exp. Med. 181, 1519–1526 [DOI] [PMC free article] [PubMed] [Google Scholar]
- 14.Peschon J. J., Morrissey P. J., Grabstein K. H., Ramsdell F. J., Maraskovsky E., Gliniak B. C., Park L. S., Ziegler S. F., Williams D. E., Ware C. B., Meyer J. D., Davison B. L. (1994) J. Exp. Med. 180, 1955–1960 [DOI] [PMC free article] [PubMed] [Google Scholar]
- 15.Sitnicka E., Brakebusch C., Martensson I. L., Svensson M., Agace W. W., Sigvardsson M., Buza-Vidas N., Bryder D., Cilio C. M., Ahlenius H., Maraskovsky E., Peschon J. J., Jacobsen S. E. (2003) J. Exp. Med. 198, 1495–1506 [DOI] [PMC free article] [PubMed] [Google Scholar]
- 16.Sitnicka E., Buza-Vidas N., Ahlenius H., Cilio C. M., Gekas C., Nygren J. M., Månsson R., Cheng M., Jensen C. T., Svensson M., Leandersson K., Agace W. W., Sigvardsson M., Jacobsen S. E. (2007) Blood 110, 2955–2964 [DOI] [PubMed] [Google Scholar]
- 17.Jensen C. T., Böiers C., Kharazi S., Lübking A., Rydén T., Sigvardsson M., Sitnicka E., Jacobsen S. E. (2008) Blood 111, 2083–2090 [DOI] [PubMed] [Google Scholar]
- 18.Maraskovsky E., Peschon J. J., McKenna H., Teepe M., Strasser A. (1998) Int. Immunol. 10, 1367–1375 [DOI] [PubMed] [Google Scholar]
- 19.Veiby O. P., Lyman S. D., Jacobsen S. E. (1996) Blood 88, 1256–1265 [PubMed] [Google Scholar]
- 20.Hirayama F., Lyman S. D., Clark S. C., Ogawa M. (1995) Blood 85, 1762–1768 [PubMed] [Google Scholar]
- 21.Ray R. J., Paige C. J., Furlonger C., Lyman S. D., Rottapel R. (1996) Eur. J. Immunol. 26, 1504–1510 [DOI] [PubMed] [Google Scholar]
- 22.Palacios R., Steinmetz M. (1985) Cell 41, 727–734 [DOI] [PubMed] [Google Scholar]
- 23.Karsunky H., Inlay M. A., Serwold T., Bhattacharya D., Weissman I. L. (2008) Blood 111, 5562–5570 [DOI] [PMC free article] [PubMed] [Google Scholar]
- 24.Medina K. L., Pongubala J. M., Reddy K. L., Lancki D. W., Dekoter R., Kieslinger M., Grosschedl R., Singh H. (2004) Dev. Cell 7, 607–617 [DOI] [PubMed] [Google Scholar]
- 25.Livak K. J., Schmittgen T. D. (2001) Methods 25, 402–408 [DOI] [PubMed] [Google Scholar]
- 26.Opferman J. T., Letai A., Beard C., Sorcinelli M. D., Ong C. C., Korsmeyer S. J. (2003) Nature 426, 671–676 [DOI] [PubMed] [Google Scholar]
- 27.Holmes M. L., Carotta S., Corcoran L. M., Nutt S. L. (2006) Genes Dev. 20, 933–938 [DOI] [PMC free article] [PubMed] [Google Scholar]
- 28.Schebesta M., Pfeffer P. L., Busslinger M. (2002) Immunity 17, 473–485 [DOI] [PubMed] [Google Scholar]
- 29.Fuxa M., Skok J., Souabni A., Salvagiotto G., Roldan E., Busslinger M. (2004) Genes Dev. 18, 411–422 [DOI] [PMC free article] [PubMed] [Google Scholar]
- 30.Souabni A., Cobaleda C., Schebesta M., Busslinger M. (2002) Immunity 17, 781–793 [DOI] [PubMed] [Google Scholar]
- 31.Tagoh H., Schebesta A., Lefevre P., Wilson N., Hume D., Busslinger M., Bonifer C. (2004) EMBO J. 23, 4275–4285 [DOI] [PMC free article] [PubMed] [Google Scholar]
- 32.Fleming H. E., Paige C. J. (2001) Immunity 15, 521–531 [DOI] [PubMed] [Google Scholar]
- 33.Dias S., Silva H., Jr., Cumano A., Vieira P. (2005) J. Exp. Med. 201, 971–979 [DOI] [PMC free article] [PubMed] [Google Scholar]
- 34.Kikuchi K., Lai A. Y., Hsu C. L., Kondo M. (2005) J. Exp. Med. 201, 1197–1203 [DOI] [PMC free article] [PubMed] [Google Scholar]
- 35.Zandi S., Mansson R., Tsapogas P., Zetterblad J., Bryder D., Sigvardsson M. (2008) J. Immunol. 181, 3364–3372 [DOI] [PubMed] [Google Scholar]
- 36.Rumfelt L. L., Zhou Y., Rowley B. M., Shinton S. A., Hardy R. R. (2006) J. Exp. Med. 203, 675–687 [DOI] [PMC free article] [PubMed] [Google Scholar]
- 37.Mansson R., Zandi S., Anderson K., Martensson I. L., Jacobsen S. E., Bryder D., Sigvardsson M. (2008) Blood 112, 1048–1055 [DOI] [PubMed] [Google Scholar]
- 38.Mansson R., Zandi S., Welinder E., Tsapogas P., Sakaguchi N., Bryder D., Sigvardsson M. (2010) Blood 115, 2601–2609 [DOI] [PubMed] [Google Scholar]
- 39.Inlay M. A., Bhattacharya D., Sahoo D., Serwold T., Seita J., Karsunky H., Plevritis S. K., Dill D. L., Weissman I. L. (2009) Genes Dev. 23, 2376–2381 [DOI] [PMC free article] [PubMed] [Google Scholar]
- 40.Kee B. L., Murre C. (1998) J. Exp. Med. 188, 699–713 [DOI] [PMC free article] [PubMed] [Google Scholar]
- 41.Smith E. M., Gisler R., Sigvardsson M. (2002) J. Immunol. 169, 261–270 [DOI] [PubMed] [Google Scholar]
- 42.Seet C. S., Brumbaugh R. L., Kee B. L. (2004) J. Exp. Med. 199, 1689–1700 [DOI] [PMC free article] [PubMed] [Google Scholar]
- 43.Reynaud D., Demarco I. A., Reddy K. L., Schjerven H., Bertolino E., Chen Z., Smale S. T., Winandy S., Singh H. (2008) Nat. Immunol. 9, 927–936 [DOI] [PMC free article] [PubMed] [Google Scholar]
- 44.Rocnik J. L., Okabe R., Yu J. C., Lee B. H., Giese N., Schenkein D. P., Gilliland D. G. (2006) Blood 108, 1339–1345 [DOI] [PMC free article] [PubMed] [Google Scholar]
Associated Data
This section collects any data citations, data availability statements, or supplementary materials included in this article.


