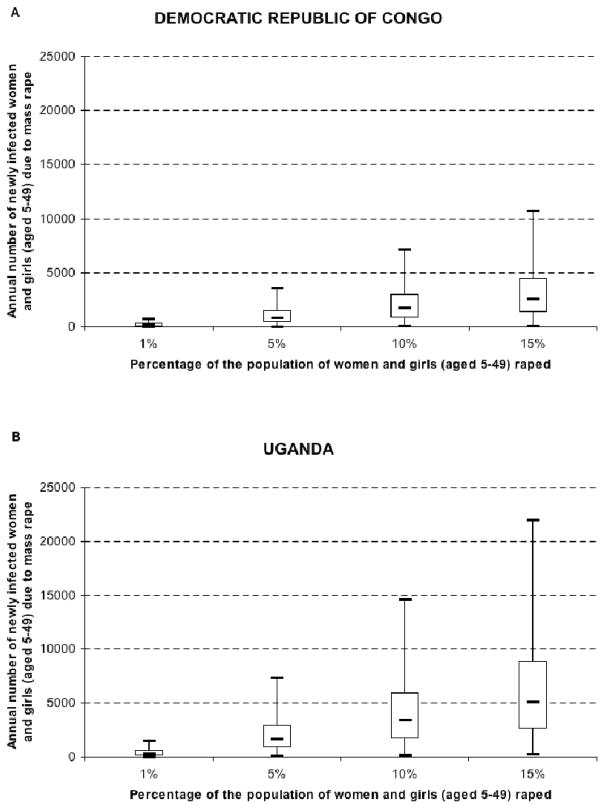
Figure 2.
Box plots (median, inter-quartile range, minimum and maximum) showing estimates of the number of women and girls (aged 5–49) who could become infected with HIV in a year as a consequence of mass rape versus the prevalence of rape: (A) the Democratic Republic of Congo (B) Uganda. Estimates made using an uncertainty analysis of the risk model (Equation 1); results from 10,000 Monte Carlo simulations are plotted.

