Abstract
In this review we cover the technical background to negative staining of biomolecules and viruses, and then expand upon the different possibilities and limitations. Topics range from conventional air-dry negative staining of samples adsorbed to carbon support films, the variant termed the “negative staining-carbon film” technique and negative staining of samples spread across the holes of holey carbon support films, to a consideration of dynamic/time-dependent negative staining. For each of these approaches examples of attainable data are given. The cryo-negative staining technique for the specimen preparation of frozen-hydrated/vitrified samples is also presented. A detailed protocol to successfully achieve cryo-negative staining with ammonium molybdate is given, as well as examples of data, which support the claim that cryo-negative staining provides a useful approach for the high-resolution study of macromolecular and viral structure.
1. Introduction
1.1. Technical background
It is widely accepted that the first publication to present a working technique for the negative staining of biological particles for TEM came from Brenner and Horne (1959). For those not aware of the prevailing situation this could be a little misleading, due to the fact that the electron microscopical work was performed entirely by Bob Horne, the bacteriophage samples under study having been produced by Sydney Brenner. Bob Horne, with his colleagues, subsequently continued to make a major contribution to methodological aspects of negative staining and the application of the technique to many different biological samples. Although numerous variants of negative staining have been introduced through the intervening years, the underlying principle that a thin layer of biological material is surrounded, permeated, supported and embedded by a dried amorphous or frozen-hydrated/vitreous layer of heavy metal-containing cationic or anionic salt remains unchanged. An electron image is generated primarily by the differential electron scattering due to the mass-thickness (density × thickness) difference between the biological material and the surrounding stain layer. Clearly there might be a difference between negative staining with heavy metal cations or anions, in that one or other may bind directly to oppositely charged groups on the surface of the biological material (i.e. positive staining), a feature that has not yet been critically addressed. In practice there does not appear to be a major difference, but the acidic staining conditions with cationic negative stains can significantly influence biological samples, sometimes stabilizing but on other occasions producing undesirable aggregation. With the anionic negative stains, molecular dissociation can occur during specimen preparation, but this is a rare event.
1.2. Air-dried negatively stained specimens
Perhaps the best that can be expected from negative staining is that it should reveal the true solvent-excluded surface and shape of a biological molecule or other particle. In theory, intra-molecular information such as alpha-helices or beta-sheets are unlikely to be revealed by negative staining, which relies upon the relatively large mass-thickness difference between the biological material and the surrounding stain, rather than upon the more subtle difference of varying mass-thickness of protein, carbohydrate and nucleic acid molecules versus the surrounding vitreous water/ice, which is the case for cryo-electron microscopy of unstained vitrified specimens. Defocus-induced phase contrast, which is important for unstained biological specimens, is also thought to contribute to electron imaging by negative stain (Massover, 2008a). The use of trehalose alone as an embedding medium generates a thin supportive film of mass-thickness marginally greater than that of a layer of vitreous water, within which viruses and large protein molecules and polymers can be revealed (Harris and Scheffler, 2002), whereas contrast matching tends to occur for smaller molecules. These intermediate mass-thickness conditions have yet to be fully exploited, although glucose and trehalose have been widely used as preservation and contrast-inducing materials for electron imaging of 2D protein crystals (Hirai et al., 1999). Strictly speaking, carbohydrates when used alone cannot be considered as negative stains, but as these useful compounds can be mixed with the established negative stains, it is appropriate to be aware of their often helpful properties.
One point that is often neglected is that following air-drying of a negatively stained specimen, a considerable quantity of water remains bound to the biological material and within the seemingly amorphous surrounding stain. Once inserted into the entry chamber of the electron microscope and subjected to the high vacuum, this bound water will be rapidly removed. However, if an air-dried negatively stained specimen is cooled with liquid nitrogen in a cryo-transfer holder, transferred to and maintained within the electron microscope under low temperature conditions, the bound water will not be removed, as indeed is the case throughout the cryo-negative staining procedure (see below). It should also be borne in mind that cryo-negatively stained vitrified specimens can be freeze-dried within the electron microscope, for comparative electron imaging following the removal of vitreous water (Adrian et al., 1998).
Several reviews on negative staining (Harris et al., 2006; Ohi et al., 2004; Padrón and Alamo, 2004) and book chapters (Harris, 1999, 2007; Harris and Adrian; 1999; Harris and Horne, 1991) have appeared in recent years that cover thoroughly a number of technical aspects and applications; some of these are available online: [http://www.springerprotocols.com/Abstract/doi/10.1007/978-1-59745-294-6_7; http://springerprotocols.com/Abstract/doi/10.1385/1-59259-201-5:13; http://related.springerprotocols.com/searchrelated?to=VSyekn5sdL&dataSource&[]=springer_protocols]. In addition, a monograph within the Royal Microscopical Society (RMS) Microscopy Handbook series (No. 35) was devoted to negative staining and cryoelectron microscopy (Harris, 1997). Thus, the present review is not intended as a repetition of what has already been published, rather we wish to address a number of technical points that we consider of significance and of likely interest and value to researchers through the coming years. Inevitably our approach will be personal, dwelling on our own experience and publications within the fields of macromolecular structure, but where relevant we will also refer to the published examples of others who have made a recent or significant contribution to the subject. In the main, detailed protocols for performing negative staining of air-dried specimens will not be given here. Instead, referencing to the relevant publications will be provided. Images describing several examples of the different negative staining approaches will be given, primarily from our own available data.
Much of the early negative stain TEM data on macromolecules and viruses remains perfectly valid and useful, although to some this may seem to represent “stone age” low-resolution information. Nevertheless, despite its 50-year existence and undoubted limitations, the negative staining technique continues to be used widely within the fields of virology and microbiology (Ackermann, 2009; Guo et al., 2009; Mast and Demeestere, 2009), cell biology (Nakane and Miyata, 2009), protein and lipid biochemistry (Gantz et al., 2000; Hudson et al., 2009; Kachibhatla et al., 2009; Radermacher et al., 2006; Luik et al., 2009; Zhang, 2009), polymer and colloid science (Harris et al., 1999; Ojugun et al., 2009) and for the examination of pharmaceutical preparations (Hamilton and Walker, 2005). The reason for this is the overall simplicity of the basic technique and its successful application within so many systems. Indeed, as a screening procedure it is also extremely useful as a means by which the quality of protein and other sample material can be rapidly assessed before devoting time and expense to cryoelectron microscopical or other studies such as X-ray crystalography. A critical comparison of negative staining and vitreous ice for the production of 3D macromolecular reconstructions was presented by Hoenger and Aebi (1996) the conclusions of which, namely that both techniques have their strengths and limitations, remain essentially the same today. Indeed, several groups now routinely employ negative staining together with cryo-electron microscopy of unstained proteins in parallel (e.g. Pires et al., 2009).
1.3. Cryo-negative staining
The currently used cryo-negative staining methodology developed from a productive collaboration between one of us (JRH) and the Lausanne-based cryo-electron microscopists Marc Adrian and Jacques Dubochet (see Adrian et al., 1998), in an attempt to produce superior sample preservation and image resolution, compared to the conventional negative staining technique with air-dried specimens. This topic was reviewed briefly by Harris and Adrian (1999) and Harris et al. (2006). Thus it is now appropriate that a more complete and up-to-date survey of cryo-negative staining should be presented here, together with a detailed protocol.
In reality the concept of cryo-negative staining is not new. Already at the beginning of the 1980's, Jean Lepault and colleagues tried to add solutes to the solution prior to vitrification. The fact that solutes are not segregated in vitreous ice makes it possible to increase the density of the medium, thus changing the contrast of embedded particles (Lepault et al., 1983). The problem is that when a compound like metrizamide (a tri-iodinated benzamido derivative of glucose) is added to the buffer prior to vitrification, a situation is reached where the contrast is dramatically reduced (contrast matching). When the surrounding solute concentration is increased, contrast inversion is obtained (with ∼30% metrizamide), and the particles appear in the EM image to be negatively stained, surrounded by the higher-density metrizamide. However, in this situation the fine structural internal details of metrizamide-embedded biological particles are not revealed, making this embedding technique essentially useless for high-resolution 3D structure determination.
Other attempts were carried out by Christoph Böttcher at the Fritz-Haber-Institute of the Max-Planck-Society in Berlin but published after his move to Imperial College. Böttcher and colleagues tried to mix conventional negative stains with the sample in the solution, immediately before vitrification, with the stain concentration kept below 2% (Böttcher et al., 1999). Due to this low stain concentration within the very thin vitrified specimen, the contrast obtained by Böttcher and coworkers did not appear to be significantly different from conventional cryo-EM preparations. Marc Adrian developed the current version of the cryo-negative staining technique more than 10 years ago in the lab of Jacques Dubochet (Adrian et al., 1998). From a methodological point of view, this sample preparation technique is very similar to the thin film vitrification technique (Adrian et al., 1984), with the exception of an additional step: a short time of contact between the biological sample and the negative stain (see Section 3, below). As a result, the biological sample is entrapped in a thin film of vitrified high concentration ammonium molybdate solution, used essentially at a saturation concentration (∼0.8M). However, if this cryo-methodology is analogous to conventional negative staining, the results obtained with this cryo-negative staining technique are completely different, and in our opinion exceptional. The signal-to-noise ratio (SNR) is amazingly higher, making it possible to visualize the biological samples with an extraordinary level of detail and clarity. In the first published work (Adrian et al., 1998), a large number of different samples were presented as successful examples of the technique: icosahedral viruses, isolated proteins and even thin catalase crystals. An electron imaging resolution of ∼10 Å was shown, with 3.3 Å from electron diffraction of the catalase crystals. The gain in SNR has been demonstrated by the straightforward comparison of the same samples, imaged in both unstained vitrified and cryo-negatively stained conditions. In 2002 we attempted a more quantitative analysis on a well-known sample. We compared unstained vs. cryo-negatively stained GroEL imaged on a 100kV LaB6 EM and measured the effect of increasing exposure electron doses on the spectral signal-to-noise ratio (SSNR). Two important observations were made. First, in the presence of frozen-hydrated ammonium molybdate, GroEL was preserved to 14Å resolution, even after a total cumulative dose of 36 el./ Å2. Second, the SNR was increased by a factor of 5 as compared with the same particles imaged in the same condition, but in unstained cryo-EM (De Carlo et al., 2002). The major interest is the high contrast of cryo-negatively stained particles; they can be imaged close to focus thus better preserving the high-resolution information, even when access to a field-emission gun (FEG) microscope is not available (De Carlo et al., 2002). For instance, the DNA packaging was clearly shown in bacteriophage T2 capsids. Nevertheless, this advantage was not demonstrated quantitatively: the 3D reconstruction of the TBSV virus 2D crystal did not show an improved result, perhaps due to the small number of virus particles present and the 2D crystal disorder. An improved resolution was claimed but this first encouraging pioneering work left unanswered many important biological questions. The most important is whether the biological structure is preserved down to atomic resolution for non-crystalline objects. This question can be asked using other words: does the negative stain penetrate deeply within the protein, and if yes, to what extent (ie what kind of internal details can be revealed)? We will present data to address this difficult question (see Section 3).
2. Negative Staining of Air-dried Specimens: Techniques, Results and Discussion
2.1. Conventional negative staining on continuous carbon films
The most commonly used negative stains are listed in Table 1. A number of examples of biological samples adsorbed to carbon support films and contrasted for electron imaging by surrounding the material with a thin aqueous film of negative stain solution and allowing it to air-dry will now be given. Relevant technical comments on the stains and on specimen preparation will be given, rather than full protocols, which in all cases are available elsewhere in the literature.
Table 1. The Principal Heavy-metal Negative Staining Salts.
| Ammonium molybdate |
| Methylamine Tungstate |
| Methylamine Vanadate (Nanovan®) |
| Sodium/Potassium Phosphotungstate |
| Sodium Silicotungstate |
| Uranyl Acetate |
| Uranyl Formate |
Uranyl acetate, despite its cationic reactivity towards biological materials and the acidity of the aqueous solution, continues to be widely used as a negative stain. It is often the first choice for initial TEM screening of an unknown sample or for rapid preliminary biological structure quality assessment. The main disadvantage of uranyl acetate for high magnification studies is the granular/microcrystalline nature of the dried stain and its sensitivity to the electron beam. The latter can be offset by the use of low dose imaging. Uranyl formate has continued to be used successfully by some, primarily because of the finer grain of the dried amorphous layer of stain (Charalambous et al., 2009; Min et al., 2002). Of the anionic negative stains, ammonium molybdate is considered by many as the most suitable, although as a 2% w/v aqueous solution it does generally impart a considerably lower mass thickness and lower image contrast than uranyl acetate. One slight disadvantage of ammonium molybdate is that specimen storage before TEM study tends to be limited to a few days. Sodium phosphotungstate and sodium silicotungstate are also well-established negative stains and in both cases a finely grained thin layer of dried stain can be produced, particularly from the silicotungstate salt. Methylamine tungstate has found some favour as a negative stain with plant virologists, but is not currently widely used. On the other hand, methylamine vanadate has found a specific use as a low contrast negative stain, in particular for revealing nanogold and undecagold particles bound to macromolecules (Hainfeld et al., 1994; Jiang et al., 2007), where other stains would mask the small gold particles. In practice, it is also possible that the use of a 1% w/v (or lower) aqueous solution of some of the other negative staining salts may well achieve much the same result, particularly if trehalose is also included. Indeed, it is likely that almost any metal salt that dries as a non-crystalline amorphous layer will have negative staining properties, as demonstrated by Massover (2008b) and Massover and Marsh (1997) using sodium tetraborate and other light-atom salts. The incorporation of metal atoms such as gold onto carbohydrates as in aurothioglucose or the use of disodium glucose-phosphate (Massover and Marsh, 2000; Massover et al., 2001), generates a low contrast negative stain, possibly also possessing protective properties due to the carbohydrate, but such compounds have not gained broad usage to-date.
The negative staining procedure can generate areas on the carbon-coated specimen grid where the stain layer is too thick, or too thin where the biological material is only partly covered and supported by the stain. The user has to select an optimal stain depth, generally dependent upon some experience with the technique and biological sample, in order to obtain satisfactory images and a meaningful interpretation of the TEM data. The inclusion of trehalose along with the negative stain provides superior coverage of molecules adsorbed to a carbon film (Harris et al., 1995), although there is a tendency for the stain layer to be too thick in places. In general, this is not a problem, unless the specimen grid under study contains only one or other extreme of stain depth, which is not usually the case. One approach to overcome this variability of stain depth has been to use a double layer or pleated film of carbon with the biological material and negative stain trapped as a sandwich between the two carbon layers. This technique has the advantage of providing an even thickness of negative stain, without producing a pronounced halo of stain around individual particles, but carries with it a considerable risk of particle flattening. Although introduced many years ago by a number of researchers, this approach was presented again by Ohi et al. (2004), who recommended it's use for producing molecular images suitable for subsequent image classification, despite the likely restricted range of molecular orientations. A comparison from electron crystallography of unstained frozen-hydrated and negatively stained specimens of photosystem II (Stoylova et al., 1998) serves to emphasize the overall limitations of negative staining.
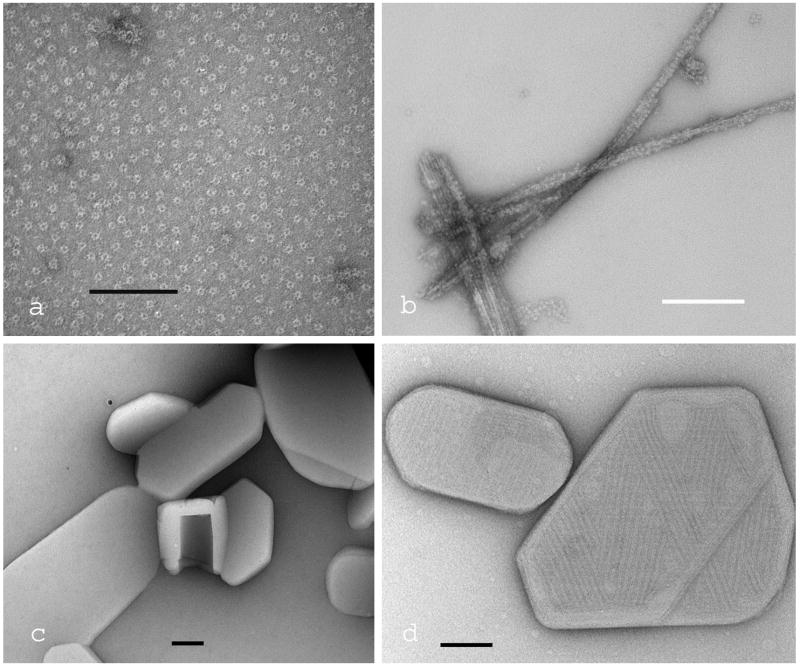
Four examples of negative staining of biomolecular samples adsorbed to a continuous carbon film are given in Fig. 1. The anthrax PA63 protective antigen (Fig. 1a), fibres produced from the amyloid-beta peptide with bound human erythrocyte catalase molecules (Fig. 1b), cholesterol microcrystals and a cochleate cylinder (located centrally) (Fig. 1c) and cholesterol microcrystals with bound pyolysin domain 4 (Fig. 1d), are all negatively stained with 2% uranyl acetate.
Fig. 1.
Four examples of TEM images produced by conventional negative staining of biomolecular samples adsorbed to a continuous carbon film. (a) The pre-pore complex of the anthrax PA63 protective antigen; (b) fibres produced from the Alzheimer amyloid-beta peptide with bound catalase molecules;(c) cholesterol planar microcrystals and a cochleate cylinder; (d) cholesterol microcrystals with bound domain 4 of the cholesterol-dependent cytolysin Pyolysin. All samples were negatively stained with 2% uranyl acetate. The scale bars indicate 100nm.
2.2. Negative Staining-Carbon Film Technique
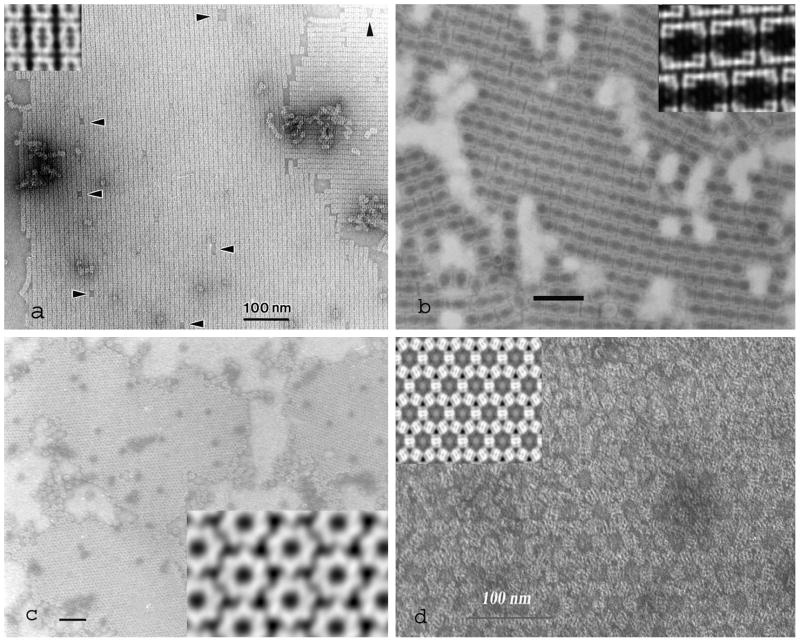
This negative staining technique was introduced primarily for the production of 2D arrays and 2D crystals of plant viral particles (Horne and Pasquali-Ronchetti, 1974; Wells et al., 1981), but has also found considerable use for the production of 2D crystals of protein molecules (Harris and Holzenburg, 1995; Zahn et al., 1993). The principal features of this technique are as follows. The sample material is allowed to dry on the surface of freshly cleaved mica, in the presence of ammonium molybdate and 0.1 or 0.2% w/v polyethylene glycol (PEG) (Mr 1,000 to 10,000). Under these conditions viral particles or protein molecules are able to form ordered 2D arrays, which form primarily at the air/fluid interface rather than in-solution or attached to the mica (Harris, 1997). As there is no interaction with or binding to the hydrophilic mica surface, following carbon-coating the carbon-adsorbed 2D protein or viral arrays can released/floated-off onto the surface of a negative stain solution (which can be ammonium molybdate, uranyl acetate or other negative stain, or indeed a buffer solution or water for subsequent labelling, followed by negative staining) and transferred to EM grids. This final step can be performed in small Petri dishes or in micro-wells in a Teflon block, with the EM grids (blank or coated with a holey carbon film) being inserted into the negative stain solution beneath the floating carbon film. In the hands of one of the authors (JRH), many successful molecular applications have been achieved, but it needs to be acknowledged that there is a hydrophobic tendency for the protein 2D arrays/crystals adsorbed to the carbon film to be only partly covered by negative stain. This presents a limitation for the production of crystallographic 3D reconstructions unless care is taken to use only images of 2D crystals that are completely embedded in negative stain (Harris et al., 1993). Four examples of 2D protein crystals produced by the negative staining carbon film technique are given in Fig. 2, together with 2D crystallographic projection averages. The molecules depicted are: the proteasome from Thermoplasma acidophilum, oriented on-side (Fig. 2a); the keyhole limpet hemocyanin type 1 didecamer, orieneted on-side (Fig. 2b); the E. coli chaperone GroEL, oriented on-end, showing the 7-fold symmetry in the 2D image average (Fig. 2c); the E. coli chaperone GroEL crystallized in the presence of Mg-ATP (Fig. 2d), with the molecules oriented on-sides, exhibiting a markedly different hexagonal 2D crystal. The ability of this technique to generate varying 2D crystal forms from human erythrocyte catalase in exemplified by the studies of Harris and Holzenburg (1989; 1995) and Harris et al. (1993).
Fig. 2.
Four examples of 2D protein crystals produced by the negative staining-carbon film technique. a) the 20S proteasome from Archeobacterioum acidophilum; b) Keyhole limpet hemocyanin type 1 (KLH1) didecamers; c) the E. coli chaperone GroEL; d) the E. coli chaperone GroEL crystallized in mica in the presence of Mg-ATP. Insets show the 2D image average generated from the respective 2D crystals. All samples were negatively stained with 2% uranyl acetate. The scale bars indicate 100 nm.
However, when equivalent 2D crystals are formed across holes by essentially the same fluid/air interface forces (see below section 2.3), there is complete embedding within a thin unsupported film of negative stain, generally without any molecular distortion due to flattening or adsorption to the carbon film (which can occur in some instances).
Despite it's undoubted possibilities, and even though considerable success has been demonstrated using this technique by a number of groups, the negative staining-carbon film technique has not gained widespread use in recent years, primarily because of the rehydration step with repeated air-drying of the biological material, which could induce molecular damage, and the partial-depth coverage with negative stain. The latter problem can be largely overcome by including a low concentration of neutral surfactant, such as 1 mM octyl-glucoside, in the negative stain solution to improve the spreading properties (Harris et al., 1998).
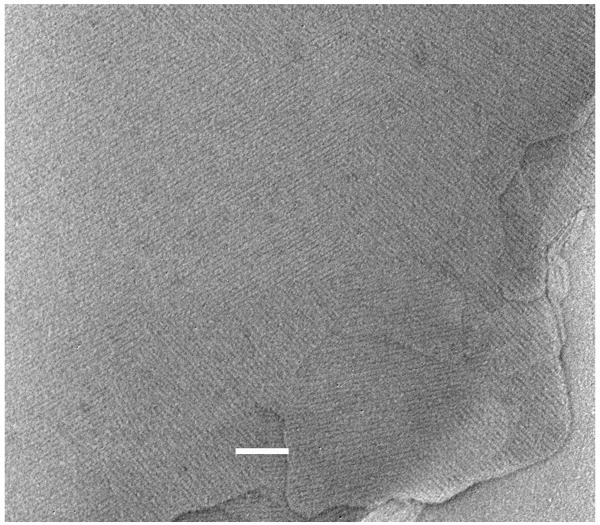
Variants of the initial negative staining-carbon film procedure include the production of 3D microcrystals of protein molecules on mica, when PEG alone is used as the crystallizing agent on mica (Harris et al., 1992) and the fact that carbon-adsorbed samples floated from the mica surface can subsequently be labelled with suitable probes (see below), together with appropriate washing steps prior to negative staining. Molecules or viral particles in glycerol and a volatile buffer solution can be spread on mica, with removal of the glycerol and buffer in vacuo prior to carbon coating. Furthermore, if the mica surface is cationized with Alcian blue, intact cells in a protective glycerol solution can be bound, washed, carbon-coated and wet-cleaved prior to negative staining. The upper surface of the cleaved cells remains attached to the carbon film and can be subsequently negatively stained (Harris, 1991). In general, intact cells are too thick for negative staining; thus this approach provides the means for the study of plasma membranes, cytomembrane and cytoskeletal components. Figure 3 presents an example showing carbon-adsorbed cholesterol produced on mica, and subsequently labelled with the cholesterol-binding domain 4 fragment of pyolysin (cf. Fig. 1d). Antibody or other affinity labelling such as biotin-streptavidin can readily be incorporated within the negative staining-carbon film procedure, as with any conventional negative staining protocol.
Fig. 3.
Immobilized carbon-adsorbed cholesterol produced by the negative staining-carbon film procedure, labelled with pyolysin domain 4. The protein is bound as a quasi 2D array to the cholesterol, following release of the carbon-adsorbed cholesterol from mica onto the protein solution (cf Fig. 1d). Note the varying lattice angles of the bound pyolysin domain 4, determined by the underlying cholesterol crystal. Negatively stained with 2% uranyl acetate. The scale bar indicates 100 nm.
2.3. The Holey-carbon Negative Staining Technique
A variant negative staining technique has been developed, which enables viruses, macromolecules, fibrils, liposomes and subcellular components to be spread across the holes of holey/perforated carbon support films, supported only by a thin film of negative stain + trehalose (Harris and Scheffler, 2002; Harris, 2008). The presence of trehalose (0.1 to 1.0 % w/v) is beneficial as it assists the spreading of the negative stain across the holes and maintenance of a thin film, while at the same time providing some molecular protection during drying, due to the properties of this disaccharide (Furuki et al., 2009; Sakurai, 2009). Under these specimen preparation conditions, macromolecules are randomly oriented within the stain-trehalose film, thereby generating a complete range of projections images, suitable for digital 3D molecular reconstructions. As no orientation restriction is present and owing to the lack of adsorption to a carbon surface, no adsorption-induced molecular deformation is present. Although for macromolecules there is generally no detectable flattening, for some viruses, liposomes and fragile vesicular components from cells some flattening may be induced by the interface forces from the two opposing fluid/air biconcave menisci during the drying of the aqueous stain-trehalose film, at positions where this becomes exceptionally thin.
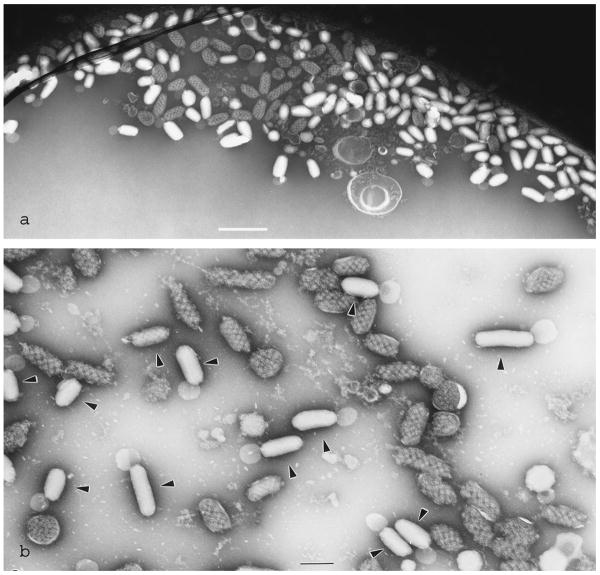
In practice, prior to drying, vesicular components, large macromolecules and viruses have a tendency, due to surface tension forces from the two opposing menisci, to diffuse towards to the edge of the holes where the fluid stain-trehalose film is thickest. Figure 4 shows biochemically isolated micronemes from sporozoites of the parasite Cryptosporidium parvum (Harris et al., 2003), where there is a pronounced clustering of micronemes within the thicker film of negative stain at the edge of a hole (Fig. 4a). At higher magnification (Fig. 4b) it is possible to distinguish damaged from undamaged micronemes; the latter (arrowheads) are not permeated by the negative stain.
Fig. 4.
The holey carbon negative staining technque applied to biochemically isolated micronemes from Cryptosporidium parvum sporozoites. (a) At the edge of the hole, shown by the dense arc towards the top of the image, there is a pronounced clustering of micronemes within the thicker negative stain (see Harris et al., 2003); (b) At higher magnification, the damaged micronemes show internal structural features and can be readily distinguished from the intact smooth-surfaced stain-excluding micronemes (arrowheads). Negatively stained with 5% ammonium molybdate, 0.1% trehalose (pH 7.0). The scale bars indicate 100 nm.
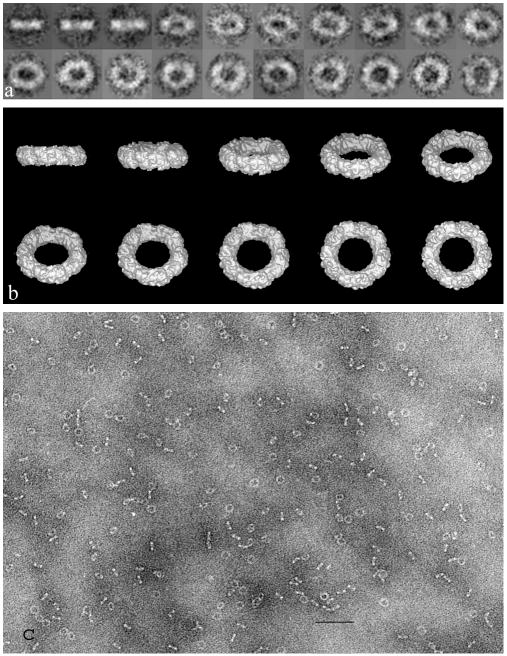
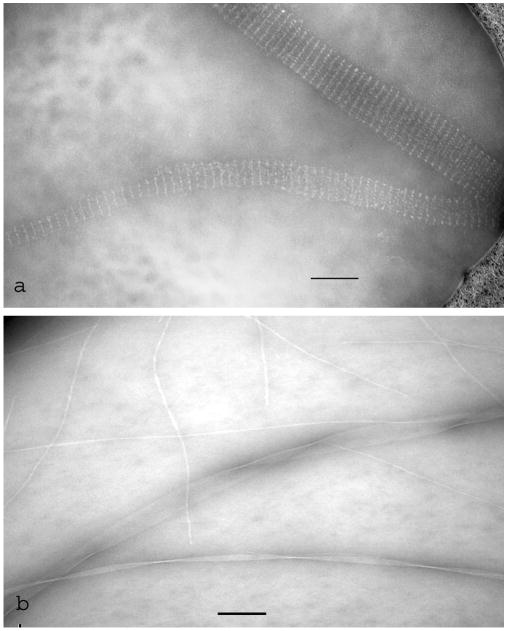
Another example, showing the ∼240kDa antioxidant enzyme, peroxiredoxin-2, from human erythrocytes is given in Fig. 5, negatively stained with ammonium molybdate-trehalose spread across a holey carbon support film. Molecular images such as this can be utilized for medium resolution (ca 20 Å) negative stain 3D reconstructions, within which is possible to fit for correlation purposes a higher resolution X-ray structure, when available (Harris et al., 2001). Of the several available examples of fibrillar material negatively stained when spread across holes (Harris, 2008), we have selected an image showing DNA tubules formed from biotinylated oligonucleotides, subsequently labelled with a streptavidin-antibody (scFv) fusion protein (Fig. 6a). Also shown are fibrils formed by the bacterial peptide Pepstatin A (Fig. 6b), the detail of which can be compared with the amyloid-beta fibrils imaged by conventional negative staining with uranyl acetate in Fig. 2b. In general, superior image detail is produced from samples spread in stain and trehalose across holes, compared to carbon-adsorbed specimens. Although most work has been performed using the 6% w/v ammonium molybdate 0.1% w/v trehalose combination, success has also be achieved using sodium phosphotungstate and sodium silicotungstate solutions containing trehalose, but when the combination of uranyl acetate and trehalose is used, the thin dry film of stain and carbohydrate has been found to be very sensitive to irradiation damage in the electron beam.
Fig. 5.
The peroxiredoxin-2 decamer from human erythrocytes, negatively stained with 5% ammonium molybdate, 1% trehalose after spreading across a holey carbon support film. Molecules selected from the original TEM data (c) were divided as class averages (a), from which a 1.9 nm 3D reconstruction was produced within the IMAGIC software package (b). The external diameter of the peroxiredoxin-2 decamer is ∼ 13 nm. The scale bar (c) indicates 100 nm. (modified from Harris et al., 2001)
Fig. 6.
DNA tubules and protein fibrils negatively stained with 5% ammonium molybdate, 0.1% trehalose, after spreading across a holey carbon support film. a) Biotinylated DNA tubular arrays labelled with the streptavidin-single chain variable fragment (scFv) fusion protein (cf Mitchell et al., 2004); (b) three different polymorphic helical and ribbon-like fibrils formed from the bacterial peptide Pepstatin A. The scale bars indicate 100 nm.
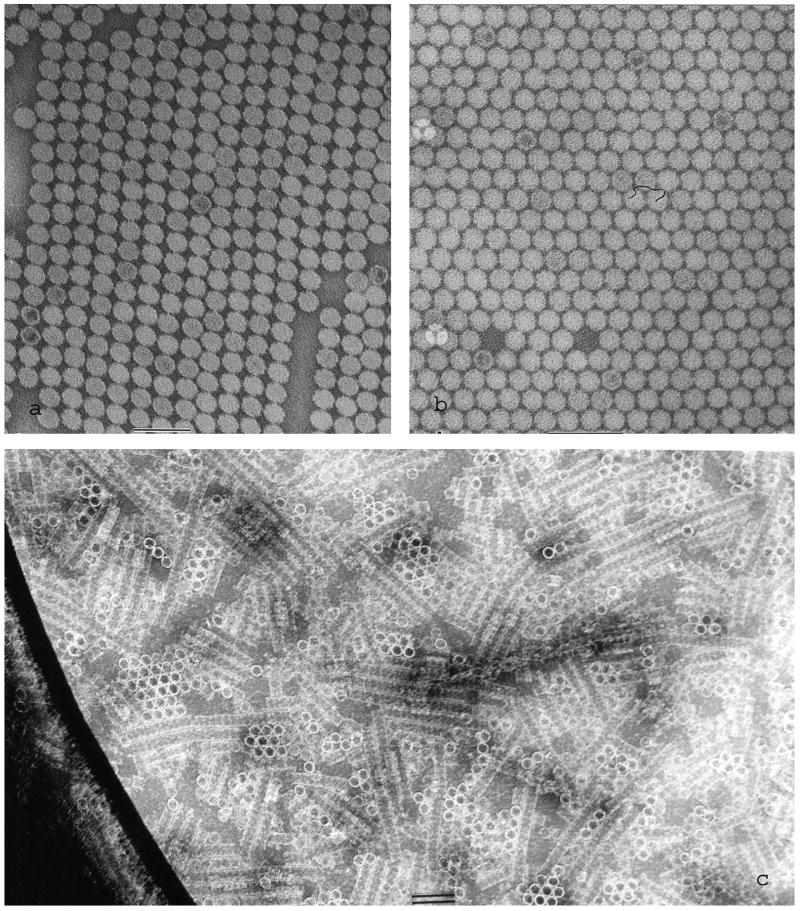
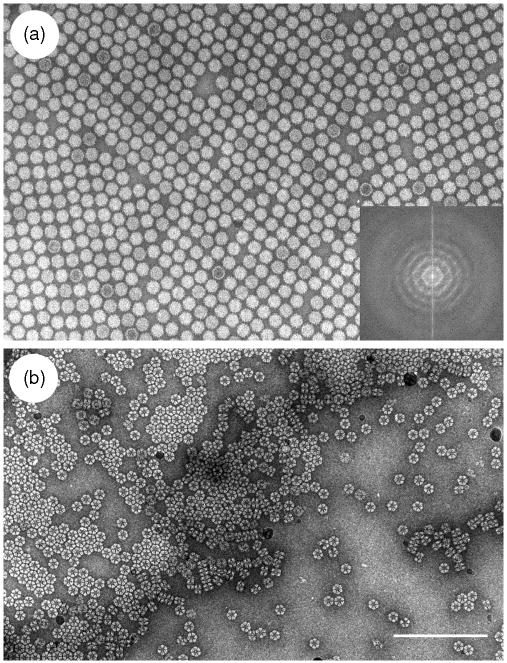
This holey-carbon negative staining technique has also been extended to include PEG along with the ammonium molybdate and trehalose, in an attempt to induce 2D crystallization of a number of different protein molecules and viruses. Some success has been achieved using this approach with both air-dried samples and also with samples subjected to cryo-negative staining (see below, Section 3). In both cases there is a strong parallel between the crystal-inducing phenomenon that occurs at the fluid/air interface of the holey carbon specimen grid with sample and stain spread across the holes, and what occurs at the air/fluid interface when essentially similar conditions are applied to samples spread thinly on the surface of freshly cleaved mica at the first stage of the negative staining-carbon film protocol. It appears that under these conditions protein molecules and viruses have a tendency to migrate to the fluid/air interface, where evaporation can induce an increase in concentration of the particles at the interface (Cyrklaff et al., 1994), thereby producing inter-molecular or inter-viral interactions, leading to 2D array and 2D crystal formation. Figure 7 shows examples of 2D crystal formation by tomato bushy stunt virus and the octopus hemocyanin decamer.
Fig. 7.
2D crystal/array formation across holes when ammonium molybdate-trehalose negative staining is performed in the presence of polyethylene glycol (PEG). (a and b) Tomato bushy stunt virus showing two different 2D arrays, with considerably greater disorder present in (a) than (b) (modified from Harris and Scheffler, 2002); (c) octopus hemocyanin decamers, showing the stacked “edge-on” molecules as multidecamer rods and “face-on” ring-like molecules (hole edge shows dark at left-hand-side). The scale bars indicate 100 nm.
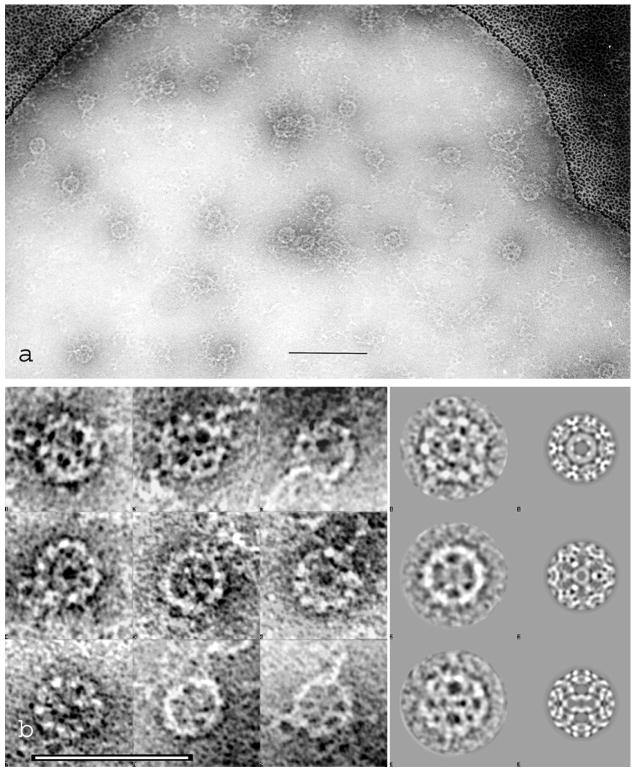
Quite unexpectedly, it has also been found that instead of producing 2D crystals during negative staining across holes in the presence of ammonium molybdate and PEG, the decameric erythrocyte peroxiredoxin-2 has been found to form a higher-order dodecahedral macromolecular assembly (Fig. 8) that possesses a marked similarity to enzyme complexes and supramolecular assemblies such as clathrin and viral capsids (Meissner et al., 2008). It is likely that other protein molecules, in particular viral proteins, could also be experimentally “encouraged” to form larger assemblies under these “in-solution” as well as “air/fluid interface” conditions during specimen preparation, which in turn could lead to bulk preparations in larger volumes of solution, if optimal higher-order assembly conditions can be defined.
Fig. 8.
The peroxiredoxin-2 dodecahedral assembly, produced by incubation for 3 h in the presence of 0.2% (w/v) PEG followed by negative staining across holes with 5% (w/v) ammonium molybdate, 0.1% (w/v) trehalose, 0.1% (w/v) PEG (pH 6.5). Instead of a 2D molecular array/crystal, under these conditions this virus-like this supramolecular assembly has been formed. (a) Many Prx-2 dodecahedra are present together with single Prx-2 decamers, short chains and clusters; (b) a composite of randomly orientated Prx-2 dodecahedral complexes are shown in the first three columns. Class averages and reprojection images, exhibiting five-, three- and two-fold symmetry are in the fourth and fifth column. To emphasize the overall structural features the class averages were low-pass filtered. Differences between class averages and reprojections are the result of different masking and filtering. Thus the reprojections, which are produced from the 3D-reconstruction, contain more detailed information. The scale bars indicate 100 nm. From Meissner et al. (2007).
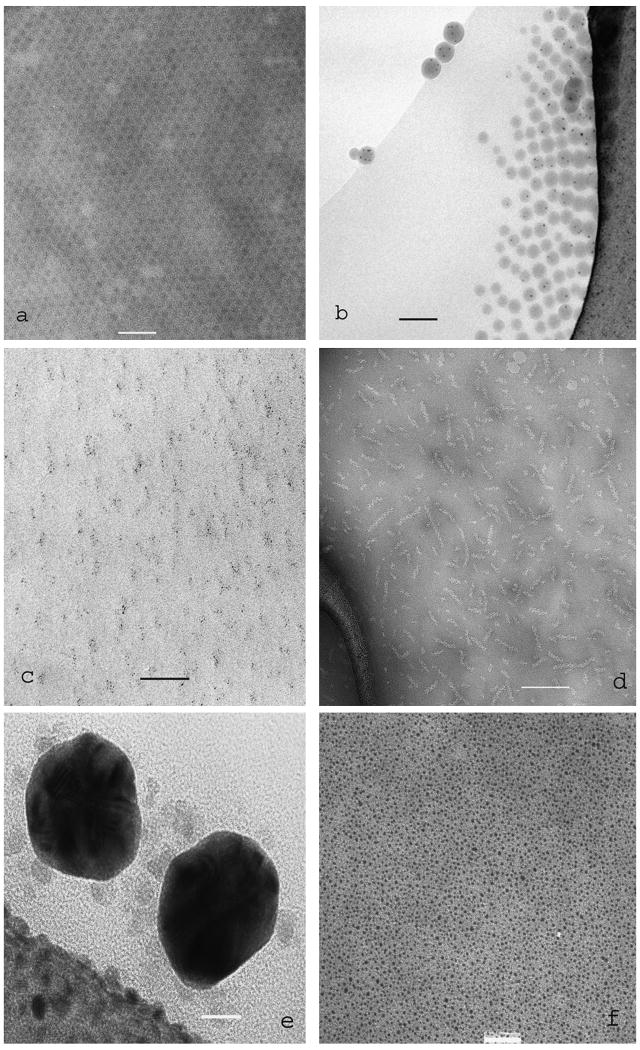
When trehalose is used alone, thin air-dried films produced by spreading a 1% w/v aqueous solution across holes (which are remarkably stable in the electron beam) generate a mass-thickness very close to that of a monolayer of most small protein molecules. Thus, such molecules will not be revealed in the electron beam due to contrast matching. For larger biological particles, such as the relatively thick collagen fibrils, and viruses where the mass-thickness of the nucleic acid-containing core is greater than that of protein, the virions can be revealed. Figure 9a shows an example of turnip yellow mosaic virus spread across a holey carbon support film in the presence of 1% trehalose alone; the slightly higher mass thickness of the nucloprotein cores is visible whereas the protein shell is essentially contrast matched by the surrounding trehalose. Block copolymer particles often have a mass thicknesssomewhat higher than that of protein molecules, and if gold crystallites have been incorporated within the polymer they will be readily revealed (Fig. 9b). If there is some integral heavy metal component, such as is found with the iron-transport protein frataxin, then the particulate, often microcrystalline, iron densities will be revealed (Fig. 9c,d) (see Harris and Scheffler, 2002). Indeed, the iron core of the ferritin can be revealed, with iron oxide atomic lattice if studied in a high resolution 200 or 300kV FEG TEM (Fig. 9e). The ∼1.4 nm monomaleimide Nanogold® can be defined when embedded within a thin film of trehalose (Fig. 9f), and it is likely that spreading in trehalose alone would be useful for metal-tagged protein molecules (cf. Nishino et al., 2007).
Fig. 9.
Images of several biological and physical samples thinly spread across holes in the presence of trehalose alone. (a) Plant virus core; (b) Polymer + gold; (c and d) The iron transport protein Frataxin, from yeast, in the presence of trehalose alone (c) and for direct comparison in the presence of ammonium molybdate-trehalose (d); (e) two colloidal gold particles with bound and free ferritin molecules, imaged at 300 kV in a FEG TEM; (f) 1.4nm Nanogold® particles. Scale bars indicate: (a to d) 100 nm, (e) 10 nm, (f) 20 nm.
2.4. Dynamic negative staining
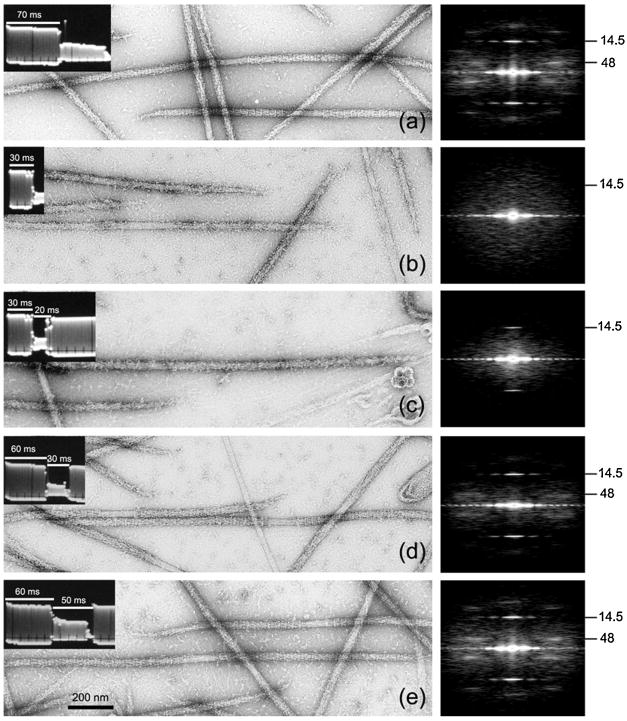
Dynamic structural changes to macromolecules can be induced by a variety of treatments, such a temperature, chemical treatments (e.g. pH, salt and buffer ionic strength, temperature, drugs, enzyme substrates or inhibitors, reduction or oxygenation and toxin interaction) and illumination by a particular wavelength of light. Since the early days of electron microscopy it was apparent that experimentally induced dynamic structural changes of macromolecules could be assessed from negatively stained specimens (Simon et al., 1991). In general the minimum time period for such treatments is thought to be limited by the grid preparation time and drying time of the negative stain on a specimen grid (e.g. 1 or 2 min). However, recent investigations by Zhao and Craig (2003; 2008) have shown that time-resolved structural changes to myosin filaments can be trapped on a millisecond time scale by the rapid stabilizing interaction of uranyl acetate (Fig. 10); it is likely that other experimental systems could readily utilize this approach.
Fig. 10.
Time-resolved negative staining showing the msec time-course of head reordering on scallop thick filaments following Ca2+ removal. Each panel shows a field of negatively stained scallop thick filaments, an oscilloscope trace (left inset) showing time in activating (high Ca2+) and/or relaxing rinse (low Ca2+), and an averaged Fourier transform of 20 representative filaments at right (numbers indicate spacing of main helical repeat (∼ 48 nm) and axial spacing of head crowns (∼14.5 nm); the presence of layer lines indicates helical ordering of the myosin heads). (a) relaxed control: grid rinsed for 70 msec with relaxing rinse, then stained – myosin heads are ordered; (b) activated control: 30 msec activating rinse then stained – heads disordered; (c) 20 msec reversal: 30 msec activating rinse, 20 msec reversing rinse, then stained – heads partially reordered; (d) 30 msec reversal: 60 msec activating rinse, 30 msec reversing rinse, then stained – heads more reordered; (e) 50 msec reversal: 60 msec activating rinse, 50 msec reversing rinse, then stained – heads fully reordered. (From Zhao and Craig, 2003).
The interaction of the cytolysin from Vibrio cholerae (VCC) has been show to interact with the bilayer edges of cholesterol microcrystals at short time periods, and that with increasing time the planar surfaces of the microcrystals become coated with the cytolysin (Harris et al., 2002). Similarly, the relatively rapid oligomerization time of the cholesterol-dependent cytolysin pyolysin from Arcanobacterium pyogenes and also attachment of its cholesterol-binding domain 4 fragment (on a time-scale of minutes), has been demonstrated by negative staining (JRH, unpublished data). Others have also utilized negative staining for the dynamic study of macromolecular structures (Burgess et al, 2004; Kondo et al., 1999; Willows et al., 2004). The investigations on 2D crystallization and macromolecular assembly formation, mentioned above, where PEG is included in the ammonium molybdate-trehalose negative staining solution, also require time-dependent TEM studies to assess the progression of intermolecular interaction. This approach can readily by linked to the biochemical and biophysical assessment of such interactions.
3. Cryo-negative Staining: Techniques, Results and Discussion
3.1. Frozen-hydrated specimens in the presence of a saturated ammonium molybdate solution at neutral pH
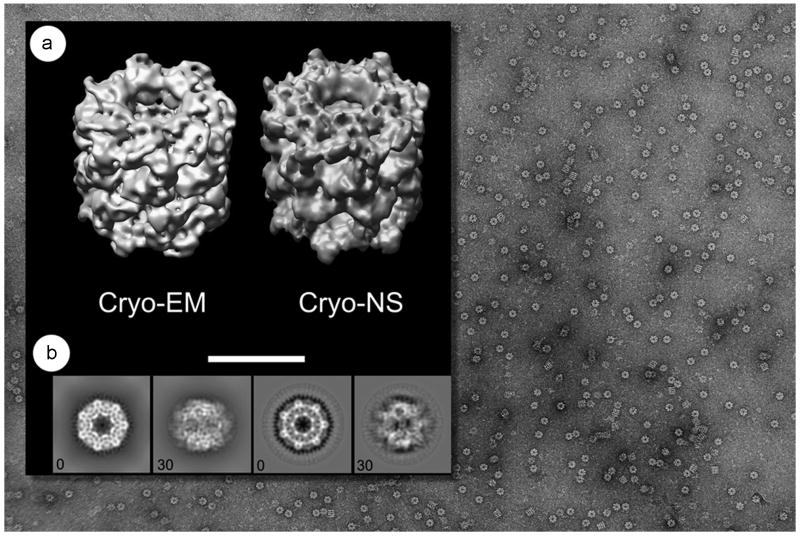
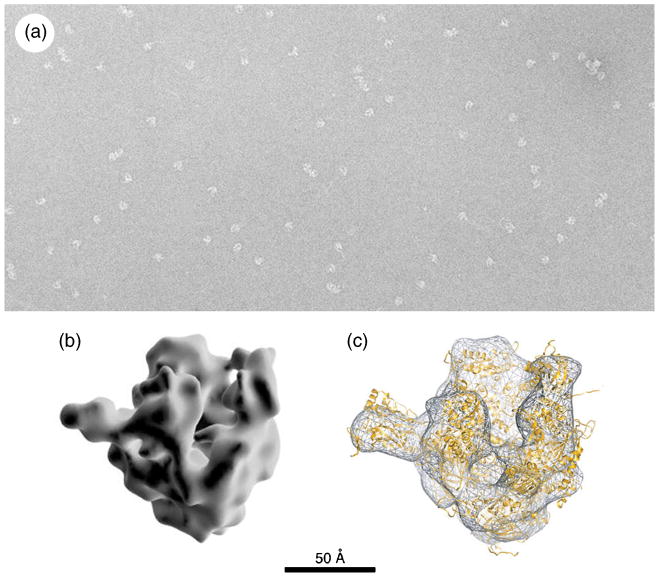
We usually follow the cryo-negative staining protocol of Adrian et al. (1998), using lab-made holey carbon films on 200-mesh copper grids (Fig. 11). The best results can be obtained after evaporating a thin layer of Au/Pd on one side of the holey carbon grid to assist sample spreading, a useful innovation introduced by Marc Adrian. The negative staining solution consists of ammonium molybdate at saturated concentration. A detailed protocol including all required materials and a step-by-step guide to successfully achieve cryo-negative staining with ammonium molybdate is available (De Carlo, 2008a). Briefly, we add 1.2 - 1.3g of ammonium molydbate tetrahydrate to 0.875 ml water, neutralized to pH 7.2-7.4 with the addition of 0.125 ml of 10M NaOH at room temperature. This forms a saturated slurry that can be stored as such for some time. Immediately before the use we shake the slurry quickly again, let it sediment for a few seconds and take the supernatant as the negative staining solution. At this point we have measured a solution density of 1.45 ± 0.05 g/cm3. Finally, 100 μl aliquots of this staining solution are deposited on Parafilm and subsequently used for the staining procedure (De Carlo et al., 2002). A short evaporation period (1 – 3 sec) after blotting and before plunge freezing is essential for production of satisfactory thin films of vitrified ammonium molybdate (Fig. 11). Under these conditions, the vitrified specimens are almost fully hydrated (in terms of protein-bound water), as the vitrified medium contains a saturated heavy-metal salt with approximately 30% water by volume (Adrian et al., 1998). Nevertheless, the results obtained through the past decade and more recently have clearly demonstrated that although not in their fully hydrated state, samples prepared with the Adrian cryo-negative staining technique are well-preserved in a vitreous/frozen-hydrated state. Examples where a direct side-by-side comparison can be made are now available in the literature, among these are the bacterial chaperonin GroEL (Fig. 12) (see De Carlo et al., 2002; De Carlo et al., 2008b), and several eukaryotic RNA polymerases (Fig. 13) (see De Carlo et al., 2003; Kostek et al., 2006). In other cases, cryo-negative staining has revealed molecular details (i.e. between 10Å and 15Å) for proteins considered to be too small for cryo-EM, such as the human transcription factor TFIIE, which is a dimeric protein complex of ∼ 110 kDa (Jawahri et al., 2006).
Fig. 11.
A schematic outline of the cryo-negative staining procedure (Adrian et al., 1998). 5 μl Samples are pipetted onto holey carbon support films and on a Parafilm surface are mixed with 100μl saturated ammonium molybdate solution. Blotting is generally applied from one side only, but can be double-sided. Immediately after the blotting stage, a short period of time (a few seconds) will enable some evaporation to occur with concentration of the sample and stain, prior to plunge freezing/vitrification. This procedure can also incorporate PEG and other solutes within the sample prior to freezing which may structurally influence the biological material under investigation, e.g. by creating 2D crystals.
Fig. 12.
A field of view of GroEL prepared with the Adrian cryo-negative staining method shown in the background. a) Side-by-side comparison of GroEL 3D reconstructions obtained in cryo-EM (EMD-1081, Ludtke et al., 2004) and cryo-negative staining (De Carlo et al., 2008); b) side-by-side comparison of 2D projections along the same direction (0 and 30 degrees) obtained from the above 3D reconstructions. Projections of the cryo-EM model (B, left) are to be compared to corresponding projections of the cryo-negatively stained model (B, right).
Fig. 13.
(A) Cryo-negatively stained images of human RNA polymerase II (RNAP); (B) molecular model obtained from these images (Kostek et al., 2006) at about 18Å resolution; (C) high-resolution homology model of the human RNAP fitted in the cryo-negative staining molecular envelope shown in (B).
The improved resolution resulting from cryo-negative staining seems to be due to several factors: these may include hydration of the biological particles, suspension in a thin layer of vitreous ice instead of adsorption to a continuous support and the documented increase in signal-to-noise ratio. Partial specimen hydration is an obvious advantage, since it allows the embedded protein to maintain almost complete hydration, thus avoiding fine structural collapse that is likely to occur in the total absence of water. The stain does not dry, thus preventing the formation of a dried cast onto and around the protein, the molybdate anions remain free in the vitreous solution and may rapidly diffuse into the protein globular molecules, allowing the high resolution fine structure of the protein to be imaged in reversed contrast instead of imaging only the surface stain-excluded protein volume, as is the case for air-dry negative staining at room-temperature. The key is in the combination of adding solutes to the solution that preserve the hydration of protein, as has been proven for trehalose, with the cooling of samples (and their hydrated surfaces) to liquid N2 temperatures. Stark and colleagues used glycerol embedded samples with uranyl formate for cryo-negative staining, and achieved 9Å resolution with the carbon-sandwich method (Golas et al., 2003).
A more detailed analysis of this phenomenon was presented by De Carlo et al. (2008b), for the comparison between frozen-hydrated GroEL as compared to cryo-negatively stained samples in the presence of a vitrified saturated ammonium molybdate solution. Clearly, imaging only 14,000 particles in the vitrified stain allowed the authors to reach about 10Å resolution, as opposed to the hundreds of thousands of unstained GroEL particles necessary to reach sub-nanometer resolution, as demonstrated by several research groups (Ludtke et al., 2008; Stagg et al., 2006; Ranson et al., 2006). Studying biological enzyme activity has proved to be possible in the presence of the vitrified stain on a continuous carbon film. Kostek et al. (2006) showed that human RNA polymerase could be imaged at ∼20Å resolution, fully preserved in the thin vitreous stain layer, allowing the enzyme to be reconstructed in two distinct conformational states.
Another advantage of using anionic molybdate over the commonly used cationic uranyl salts, is that even at saturated concentrations it can be buffered to any desired physiological pH by the addition of a very small volume of strong base, although this comment could also apply to the phosphotugstate/silicotungstate negative staining salts. Cryo-negative staining can readily be performed in a semi-automated fashion inside a blotting and vitrification device that is fully computer controlled, such as the Vitrobot (FEI) or the Cp3 (Gatan). It should be noted, however, that there can be a difference between specimens prepared by single versus double-sided blotting, particularly if it is desirable to induce 2D crystal-formation at one untouched fluid-air interface prior to plunge freezing. Special precautions may need to be taken if the blotting chamber is used at 100% relative humidity. In our experience it is better to keep the sample environment relatively dry immediately before blotting. If the sample buffer concentrations need to be maintained at defined humidity values the blotting parameters on the automated vitrification device will need to be changed accordingly.
Since we have also considered 2D crystal formation by proteins and viruses during cryo-negative staining, we would like to discuss here the advantages to be gained by addition of polyethylene glycol (PEG). A few examples of para-crystalline formation for a solution of viruses or proteins are presented in Fig.14. Tomato Bushy Stunt Virus (TBSV) in the presence of 0.1g/L of PEG-1000 is shown cryo-negatively stained in panel A) of Fig. 14, whereas hexameric hemoglobin from the marine annelid Nereis virens is shown in Fig. 14 panel B). In our experience, adding 1-2% PEG induces order formation in particulates suspended at the air-water interface. This may be interpreted as protein-protein interaction becoming dominant by decreasing solute-solute repulsion, as observed for protein solutions near their isoelectric point. The combination of ions from the staining solution as well as the presence of PEG may facilitate this condition, inducing pseudo-crystal formation of larger size as compared to the same solutions, but in the total absence of PEG (see Lorber et al., 2008).
Fig. 14.
(A) Tomato Bushy Stunt Virus (TBSV), cryo-negatively stained with saturated ammonium molybdate and in the presence of 0.1g/L PEG-1000. (B) Hexameric hemoglobin from the marine worm Nereis virens in the presence of 2% (v/v) PEG-3350. The scale bar (B) indicates 0.2 μm.
Provided the protein complex under investigation endures well structurally in the staining solution (this may be cross-checked with conventional negative staining and cryo-EM and can be judged from the fitting parameters of individual particles to each other), cryo-negative staining has been found to have several advantages. Our main conclusions obtained so far from cryo-negative staining on biological particulates imaged both in 120kV LaB6 and a 200 kV FEG electron microscope under strict cryo-conditions can be summarized as follows:
The negative staining solution produces a higher signal-to-noise ratio than conventional unstained cryo-EM (Adrian et al., 1984). This has several positive effects on 3D structure determination of macromolecular complexes, as further outlined below.
For reaching a certain resolution on a given structure fewer particles have to be collected than with conventional cryo-EM.
The minimal size of particles may be lower because they are more easily visualized and classified due to the higher contrast.
The defocus values during image recording can be lowered, extending the first zero-node of the CTF further out. Unstained GroEL is hardly detectable on electron micrographs recorded with ∼1000 nm defocus at 200 kV while they are well visible in the presence of negative stain.
Our previous study has shown that samples are less beam-sensitive in the presence of stain as shown by the absence of damage despite the three-fold increase in the exposure dose (see Fig. 1 in De Carlo et al., 2002). However, a precise quantification remains to be done.
The vitrified and stained particles deliver a stronger Thon ring pattern, facilitating image quality control and CTF correction.
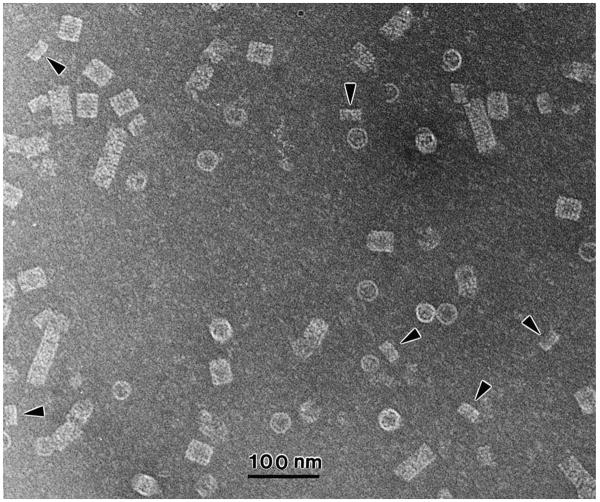
We have, however, also encountered a few limitations of cryo-negative staining. Most importantly, the structure under study must withstand the exposure to the concentrated ammonium molybdate. Over the last decade, a few biological assemblies studied by cryo-negative staining showed sensitivity to the saturated stain and tended to partially split apart into their smaller subunits (e.g. KLH, Fig. 15). Among these rare, yet important, unsuccessful cases we can cite microtubules, and some multimeric ATPases, such as NtrC (De Carlo et al., 2006), which dissociate completely (data not shown). Even in these cases, it is possible that useful information on the dissociation intermediates might be gained, for correlation with other biochemical or biophysical data. The other important finding is that, while the macromolecules that are well preserved in vitrified saturated ammonium molybdate and their structure is revealed with a good accuracy to about 10Å resolution, internal fine structures are sometimes lost, i.e. the resolution may not be isotropic in the 3D reconstruction. This is either due to insufficient stain penetration at these locations, or the structural detail may be imaged at reverse contrast (positive contrast as in conventional cryoEM instead of negative contrast as from cryo-negative staining). Alternatively, cryo-negative staining may over-emphasize the contrast of low-resolution features while reproducing high-resolution structures at a far lower contrast. Hence, the range in contrast from low- to high-resolution structures seems much larger than in conventional cryo-EM. Also, contrast enhancement may not be the same for all spatial frequencies, and it is difficult to estimate the real contribution of stain to the amplitude contrast in the CTF, especially at low spatial frequencies.
Fig. 15.
Keyhole limpet hemocyanin (KLH) didecamers and multidecamers prepared by cryo-negative staining. Increased exposure of the sample to the saturated ammonium molybdate staining solution (60 s) may induce dissociation of this large homo-oligomeric protein into decamers (arrowheads).
Cryo-negative staining represents a complementary method to conventional cryo-EM of unstained vitrified samples and a valuable alternative, in particular for situations where cryo-EM reaches its limits in terms of sample visibility, or where a preliminary 3D model is required to initiate a cryo-EM image averaging approach. It can be useful for cryo-electron tomography of non-symmetric viruses or small particulates. Indeed, the presence of ammonium molybdate helps preserving the samples being imaged with a total cumulative electron dose of 80-100 el./Å2 (Messaoudi et al., 2003). The present review demonstrates that cryo-negative staining preserves the structure of biological macromolecules to fine detail (i.e. 10 Å). The vitrified ammonium molybdate solution surrounding the sample can access and reveal internal densities of a protein. This finding is of great importance for structural biology studies of macromolecules that are too small for single particle reconstruction (less than 200 kDa), and especially with cases where subunits or even smaller functional domains of a protein complex cannot be easily detected in cryo-EM density maps, due to a lack of contrast. A useful technical innovation termed “GraFix”, presented by Kastner et al. (2008), enables labile molecular complexes to be stabilized by weak chemical fixation during isolation on a glycerol density gradient, prior to conventional negative staining, cryo-negative staining or unstained cryo-EM. The recent application of cryo-negative staining to proteins attached to carbon nanotubes (Edri and Regev, 2010) indicates the expanding use of this approach for molecular imaging.
4. Conclusions
We have discussed in some depth the range of technical possibilities available for the production of air-dried negatively stained specimens from macromolecular and viral samples, and have demonstrated within the figures some achievable electron images from such specimens. Emphasis has been placed upon the benefits to be gained from the production of air-dried specimens spread across holes and supported in negative stain alone. As with the mica-spreading “negative staining-carbon film” procedure, protein and viral samples dried across holes in the presence of negative stain and PEG have been shown to form 2-dimensional crystals, and also generate supramolecular assemblies in some instances (Meissner et al., 2007). This air-drying negative staining approach correlates particularly well with cryo-negative staining, where samples are also initially spread across holey carbon support films, blotted and then plunge-frozen. Indeed, it has been our intention to place strongest overall emphasis on the cryo-negative staining procedure (see Section 3), as this offers the greatest possibilities for future high-resolution molecular studies. Accordingly, a thorough account of the cryo-negative staining procedure and some recent applications has been given. The benefits and limitations are discussed, and meaningful comparisons made with the conventional air-dry negative staining and unstained vitrification procedures.
Acknowledgments
S. De Carlo would like to thank the Research Centers in Minority Institutions for support through a NIH/NCRR/RCMI Grant G12-RR03060 to CCNY.
Footnotes
Publisher's Disclaimer: This is a PDF file of an unedited manuscript that has been accepted for publication. As a service to our customers we are providing this early version of the manuscript. The manuscript will undergo copyediting, typesetting, and review of the resulting proof before it is published in its final citable form. Please note that during the production process errors may be discovered which could affect the content, and all legal disclaimers that apply to the journal pertain.
Contributor Information
Sacha De Carlo, Email: sdecarlo@ccny.cuny.edu.
J. Robin Harris, Email: rharris@uni-mainz.de.
References
- Ackermann HW. Basic phage electron microscopy. Meth Mol Biol. 2009;501:113–126. doi: 10.1007/978-1-60327-164-6_12. [DOI] [PubMed] [Google Scholar]
- Adrian M, Dubochet J, Lepault J, McDowall AW. Cryo-electron microscopy of viruses. Nature. 1984;308:32–36. doi: 10.1038/308032a0. [DOI] [PubMed] [Google Scholar]
- Adrian M, Dubochet J, Fuller SD, Harris JR. Cryo-negative Staining. Micron. 1998;29:145–160. doi: 10.1016/s0968-4328(97)00068-1. [DOI] [PubMed] [Google Scholar]
- Brenner S, Horne RW. A negative staining method for high resolution electron microscopy of viruses. Biochim Biophys Acta. 1959;34:103–110. doi: 10.1016/0006-3002(59)90237-9. [DOI] [PubMed] [Google Scholar]
- Burgess SA, Walker ML, Thirumurugan K, Trinick J, Knight PJ. Use of negative stain and single-particle image processing to explore dynamic properties of flexible molecules. J Struct Biol. 2004;47:247–258. doi: 10.1016/j.jsb.2004.04.004. [DOI] [PubMed] [Google Scholar]
- Charalambous K, O'Reilly AO, Bullough PA, Wallace BA. Thermal and chemical unfolding and refolding of a eukaryotic sodium channel. Biochim Biophys Acta. 2009;1788:1279–1286. doi: 10.1016/j.bbamem.2009.02.005. [DOI] [PMC free article] [PubMed] [Google Scholar]
- Cyrklaff M, Roos N, Gross H, Dubochet J. Particle-surface interaction in the vitrified films for cryo-electron microscopy. J Microsc. 1994;175:135–142. [Google Scholar]
- De Carlo S, El-Bez C, Alvarez-Rúa C, Borge J, Dubochet J. Cryo-negative staining reduces electron-beam sensitivity of vitrified biological particles. J Struct Biol. 2002;138:216–226. doi: 10.1016/s1047-8477(02)00035-7. [DOI] [PubMed] [Google Scholar]
- De Carlo S, Carles C, Riva M, Schultz P. Cryo-negative staining reveals conformational flexibility within yeast RNA polymerase I. J Mol Biol. 2003;329:891–902. doi: 10.1016/s0022-2836(03)00510-2. [DOI] [PubMed] [Google Scholar]
- De Carlo S, Chen B, Hoover TR, Kondrashkina E, Nogales E, Nixon BT. The Structural Basis of Regulated Assembly and Function of the Transcriptional Activator NtrC. Genes & Development. 2006;20:1485–1495. doi: 10.1101/gad.1418306. [DOI] [PMC free article] [PubMed] [Google Scholar]
- De Carlo S. Handbook of Cryopreparation Methods for Electron Microscopy. CRC Press; 2008a. Cryo-Negative Staining. Ed. [Google Scholar]
- De Carlo S, Boisset N, Hoenger A. High-resolution single-particles 3D analysis on GroEL prepared by cryo-negative staining. Micron. 2008b;39:934–943. doi: 10.1016/j.micron.2007.11.003. [DOI] [PubMed] [Google Scholar]
- Edri E, Regev O. Cryo-staining techniques in cryo-TEM studies of dispersed nan0tubes. Ultramicroscopy. 2010;110:754–760. doi: 10.1016/j.ultramic.2010.03.010. [DOI] [PubMed] [Google Scholar]
- Furuki T, Oku K, Sakkurai M. Thermodynamic, hydration and structural characteristics of alpha,alpha-trehalose. Front Biosci. 2009;14:3523–3535. doi: 10.2741/3468. [DOI] [PubMed] [Google Scholar]
- Gantz DL, Walsh MT, Small DM. Morphology of sodium deoxycholate-solublized apolipoprotein B-100 using negative stain and vitreous ice electron microscopy. J Lipid Res. 2000;41:1464–1472. [PubMed] [Google Scholar]
- Golas MM, Sander B, Will CL, Luhrmann R, Stark H. Molecular architecture of the multiprotein splicing factor SF3b. Science. 2003;300:980–984. doi: 10.1126/science.1084155. [DOI] [PubMed] [Google Scholar]
- Guo Y, Cheng A, Wang M, Zhou Y. Purification of anatid herpesvirus 1 particles by tangential-flow ultrafiltration and sucrose gradient ultracentrifugation. J Virol Meth. 2009;161:1–6. doi: 10.1016/j.jviromet.2008.12.017. [DOI] [PubMed] [Google Scholar]
- Hainfeld JF, Safer D, Walls JS, Simon M, Lin B, Powell RD. Methylamine vanadate (Nanaovan) negative stain. In: Bailey GE, Garratt-Reed AJ, editors. Proc 52nd Ann Meeting, Microsc Soc Amer. San Francisco Press; San Francisco, CA, USA: 1994. pp. 132–134. [Google Scholar]
- Hamilton RC, Walker MB. The use of negative stain electron microscopy for the examination of pharmaceutical preparations. Microsc Microanal. 2005;11(Suppl 2):1250–1251. [Google Scholar]
- Harris JR. Negative staining-carbon film technique: New cellular and molecular applications. J Elect Microsc Techn. 1991;18:269–276. doi: 10.1002/jemt.1060180309. [DOI] [PubMed] [Google Scholar]
- Harris JR. RMS Microscopy Handbook No 35. BIOS Scientific Publishers Ltd; Oxford: 1997. Negative Staining and Cryoelectron Microscopy: the thin film techniques. [Google Scholar]
- Harris JR. Negative staining of thinly spread biological particulates. In: Nasser Hajibagheri MA, editor. Electron microscopy methods and protocols. Vol. 117. Humana Press; 1999. pp. 13–30. (Methods in Molecular Biology). [DOI] [PubMed] [Google Scholar]
- Harris JR. Negative staining of thinly spread biological samples. In: Kuo J, editor. Electron Microscopy Methods and Protocols. 2nd. Vol. 369. Humana Press; 2007. pp. 107–142. (Methods in Molecular Biology). [DOI] [PubMed] [Google Scholar]
- Harris JR. Negative staining across holes: Application to fibril and tubular structures. Micron. 2008;39:168–176. doi: 10.1016/j.micron.2007.07.003. [DOI] [PubMed] [Google Scholar]
- Harris JR, Adrian M. Preparation of thin-film frozen-hydrated/vitrified biological specimens for Cryoelectron microscopy. In: Nasser Hajibagheri MA, editor. Electron microscopy methods and protocols. Vol. 117. Humana Press; 1999. pp. 31–48. (Methods in Molecular Biology). [DOI] [PubMed] [Google Scholar]
- Harris JR, Holzenburg A. Transmission electron microscopy of negatively stained human erythrocyte catalase. Micron & Microsc Acta. 1989;20:223–238. [Google Scholar]
- Harris JR, Holzenburg A. Human erythrocyte catalase: 2-D crystal nucleation and multiple 2-D crystal forms. J Struct Biol. 1995;115:223–238. doi: 10.1006/jsbi.1995.1034. [DOI] [PubMed] [Google Scholar]
- Harris JR, Horne RW. Negative Staining. In: Harris JR, editor. Electron Microscopy in Biology: A Practical Approach. IRL Press; Oxford: 1991. pp. 203–228. [Google Scholar]
- Harris JR, Scheffler D. Routine preparation of air-dried negatively stained and unstained specimens on holey carbon support films: a review of applications. Micron. 2002;33:461–480. doi: 10.1016/s0968-4328(01)00039-7. [DOI] [PubMed] [Google Scholar]
- Harris JR, Adrian M, Bhakdi S, Palmer M. Cholesterol-streptolysin O interaction: An EM study of wild-type and mutant streptolysin O. J Struct Biol. 1998;121:343–355. doi: 10.1006/jsbi.1998.3989. [DOI] [PubMed] [Google Scholar]
- Harris JR, Adrian M, Petry F. Structure of the Cryptosporidium parvum microneme: a metabolically and osmotically labile apicomplexan organelle. Micron. 2003;34:65–78. doi: 10.1016/s0968-4328(03)00020-9. [DOI] [PubMed] [Google Scholar]
- Harris JR, Bhakdi S, Scheffler D, Bittman R, Zitzer A, Palmer M. Interaction of the Vibrio cholerae Cytolysin (VCC) with cholesterol, some cholesterol esters and cholesterol derivatives: a TEM study. Journal of Structural Biology. 2002;139:122–135. doi: 10.1016/s1047-8477(02)00563-4. [DOI] [PubMed] [Google Scholar]
- Harris JR, Bhella D, Adrian M. Recent Developments in Negative Staining for Transmission Electron Microscopy. Microscopy and Analysis. 2006;20:17–21. [Google Scholar]
- Harris JR, Gebauer W, Markl J. Keyhole limpet hemocyanin (KLH): Negative Staining in the presence of trehalose. Micron. 1995;26:25–33. [Google Scholar]
- Harris JR, Pfeifer G, Pühler G, Baumeister W. Electron Microscopy. Vol. 1. EUREM 92. Granada, Spain: 1992. Production of 3-D Microcrystals from Thermoplasma Acidophilum multicatalytic proteinase / proteasome by the negative staining-carbon film technique; pp. 383–384. [Google Scholar]
- Harris JR, Roos C, Djalali R, Rheingans O, Maskos M, Schmidt M. Application of the negative staining technique to both aqueous and organic solvent solutions of polymer particles. Micron. 1999;30:289–298. [Google Scholar]
- Harris JR, Schroder E, Isupov MN, Scheffler D, Kristensen P, Littlechild JA, Vagin AA, Meissner U. Comparison of the decameric structure of peroxiredoxin II by transmission electron microscopy and X-ray crystallography. Biochim Biophys Acta. 2001;1547:221–234. doi: 10.1016/s0167-4838(01)00184-4. [DOI] [PubMed] [Google Scholar]
- Harris JR, Volker S, Engelhardt H, Holzenburg A. Human erythrocyte catalase: New 2-dimensional crystal forms and image processing. J Structural Biology. 1993;111:22–33. doi: 10.1006/jsbi.1993.1032. [DOI] [PubMed] [Google Scholar]
- Hirai T, Murata K, Mitsuoka K, Kimura Y, Fujiyoshi Y. Trehalose embedding technique for high-resolution electron crystallography: application to structural study on bacteriorhodopsin. J Elect Microsc. 1999;48:653–658. doi: 10.1093/oxfordjournals.jmicro.a023731. [DOI] [PubMed] [Google Scholar]
- Hoenger A, Aebi U. 3-D Reconstructions from ice-embedded and negatively stained biomacromolecular assemblies: A critical comparison. J Struct Biol. 1996;117:99–116. [Google Scholar]
- Horne RW, Pasquali-Ronchetti I. A negative staining-carbon film technique for studying viruses in the electron microscope. I. Preparation procedures for examining icosahedral and filamentous viruses. J Ultrastruct Res. 1974;47:361–383. doi: 10.1016/s0022-5320(74)90015-x. [DOI] [PubMed] [Google Scholar]
- Hudson BP, Quispe J, Lara-González S, Kim Y, Berman HM, Arnold E, Ebright RH, Lawson GL. Three-dimensional EM structure of an intact activator-dependent transcription initiation complex. Proc Natl Acad Sci USA. 2009 doi: 10.1073/pnas.0908782106. In press. [DOI] [PMC free article] [PubMed] [Google Scholar]
- Jawhari A, Uhring M, De Carlo S, Crucifix C, Tocchini-Valentini G, Moras D, Schultz P, Poterszman A. Structure and oligomeric state of human transcription factor TFIIE. EMBO Rep. 2006;7:500–505. doi: 10.1038/sj.embor.7400663. [DOI] [PMC free article] [PubMed] [Google Scholar]
- Jiang ZG, Simon MN, Wall JS, McKnight CJ. Structural analysis of reconstituted lipoproteins containing the N-terminal domain of apoliporotein B. Biophys J. 2007;92:4097–4108. doi: 10.1529/biophysj.106.101105. [DOI] [PMC free article] [PubMed] [Google Scholar]
- Kastner B, Fischer N, Golas MM, Sander B, Dube P, Boehringer D, Hartmuth K, Deckert J, Hauer F, Wolf E, Uchtanhagen H, Urlab H, Herzog F, Peters JM, Pörschke D, Lührmann R, Stark H. GraFix: sample preparation for single-particle electron cryomicroscopy. Nature Methods. 2008;5:53–55. doi: 10.1038/nmeth1139. [DOI] [PubMed] [Google Scholar]
- Kondo A, Muranaka Y, Ohta I, Kanno T. Dynamic reaction in a homogeneous HDL-cholesterol assay visualized by electron microscopy. Clin Chem. 1999;45:1974–1980. [PubMed] [Google Scholar]
- Kostek S, Grob P, De Carlo S, Lipscomb S, Garczarek F, Nogales E. Molecular architecture and conformational flexibility of human RNA polymerase II. Structure. 2006;14:1691–1700. doi: 10.1016/j.str.2006.09.011. [DOI] [PubMed] [Google Scholar]
- Kuchibhatla A, Abul Rasheed AS, Narayanan J, Bellare J, Panada D. An analysis of FtsZ assembly using small angle X-ray scattering and electron microscopy. Langmuir. 2009;25:3775–3785. doi: 10.1021/la8036605. [DOI] [PubMed] [Google Scholar]
- Lepault J, Booy FP, Dubochet J. Electron microscopy of frozen hydrated biological suspensons. J Microsc. 1983;129:89–102. doi: 10.1111/j.1365-2818.1983.tb04163.x. [DOI] [PubMed] [Google Scholar]
- Llorca O. Electron microscopy reconstructions of DNA repair complexes. Curr Opin Str Biol. 2007;17:215–220. doi: 10.1016/j.sbi.2007.03.009. [DOI] [PubMed] [Google Scholar]
- Lorber B, Adrian M, Witz J, Ethardt M, Harris JR. Formation of two-dimensional crystals of isosahedral RNA viruses. Micron. 2008;39:431–446. doi: 10.1016/j.micron.2007.02.008. [DOI] [PubMed] [Google Scholar]
- Ludtke S, Chen D, Song J, Chuang D, Chiu W. Seeing GroEL at 6Å resolution by single particle electron cryomicroscopy. Structure. 2004;12:1129–1136. doi: 10.1016/j.str.2004.05.006. [DOI] [PubMed] [Google Scholar]
- Luik P, Chew C, Aittoniemi J, Chang J, Wentworth P, Jr, Dweck RA, Biggin PC, Vénien-Bryan C, Zitzmann N. The 3-dimensional structure of a hepatitis C virus p7 ion channel by electron microscopy. Proc Natl Acad Sci USA. 2009;106:12712–12716. doi: 10.1073/pnas.0905966106. [DOI] [PMC free article] [PubMed] [Google Scholar]
- Massover WH. On the experimental use of light metal salts for negative staining. Microsc Microanal. 2008a;14:126–137. doi: 10.1017/S1431927608080033. [DOI] [PubMed] [Google Scholar]
- Massover WH. Negative staining produces images of proteins by which contrast mechanisms. Microsc Microanal. 2008b;14(Suppl. 2):672–673. [Google Scholar]
- Massover WH, Marsh P. Unconventional negative stains: Heavy metals are not required for negative staining. Ultramicroscopy. 1997;69:139–150. [Google Scholar]
- Massover WH, Fun Lai P, Marsh P. Negative staining permits 4.0Å resolution with low-dose electron diffraction of catalase crystals. Ultramicroscopy. 2001;90:7–12. doi: 10.1016/s0304-3991(01)00131-0. [DOI] [PubMed] [Google Scholar]
- Massover WH, Marsh P. Light atom derivatives of structure-preserving sugars are unconventional negative stains. Ultramicroscopy. 2000;85:107–121. doi: 10.1016/s0304-3991(00)00048-6. [DOI] [PubMed] [Google Scholar]
- Mast J, Demeestere L. Electron tomography of negatively stained complex viruses: application in their diagnosis. Diagnostic Pathol. 2009;4:5. doi: 10.1186/1746-15964-5. [DOI] [PMC free article] [PubMed] [Google Scholar]
- Meissner U, Schröder E, Scheffler D, Martin AG, Harris JR. Formation, TEM study and 3D reconstruction of the human erythrocyte peroxiredoxin-2 dodecahedral higher-order assembly. Micron. 2007;38:29–29. doi: 10.1016/j.micron.2006.04.010. [DOI] [PubMed] [Google Scholar]
- Messaoudi C, Boudier T, Lechaire JP, Rigaud JL, Delacroix H, Gaill F, Marco S. Use of cryo-negative staining in tomographic reconstruction of biological objects: application to T4 bacteriophage. Biol Cell. 2003;95(6):393–8. doi: 10.1016/s0248-4900(03)00086-8. [DOI] [PubMed] [Google Scholar]
- Min G, Stolz M, Zhou G, Liang F, Sebbel P, Stoffler D, Glockshuber R, Sun TT, Aebi U, Kong XP. Localization of uroplakin1a, the urothelial receptor for bacterial adhesin FimH, on the six inner domains of the 16nm urothelial plaque particle. J Mol Biol. 2002;317:697–706. doi: 10.1006/jmbi.2002.5442. [DOI] [PubMed] [Google Scholar]
- Mitchell JC, Harris JR, Malo J, Bath J, Turberfield AJ. Self-assembly of chiral DNA nanotubes. J Am Chem Soc. 2004;126:16342–16343. doi: 10.1021/ja043890h. [DOI] [PubMed] [Google Scholar]
- Nakane D, Miyata M. Cytoskeletal asymmetrical dumbbell structure of a gliding mycoplasma, Mycoplasma gallisepticum, revealed by negative-staining electron microscopy. J Bacteriol. 2009;191:3256–3264. doi: 10.1128/JB.01823-08. [DOI] [PMC free article] [PubMed] [Google Scholar]
- Nishino Y, Yasunaga T, Miyazawa A. A genetically encoded metallothionein tag enabling efficient protein detection by electron microscopy. J Elect Microsc (Tokyo) 2007;56:93–101. doi: 10.1093/jmicro/dfm008. [DOI] [PubMed] [Google Scholar]
- Ohi M, Li Y, Cheng Y, Walz T. Negative staining and image classification – Powerful tools in modern electron microscopy. Biol Proced Online. 2004;6:23–34. doi: 10.1251/bpo70. [DOI] [PMC free article] [PubMed] [Google Scholar]
- Ojogun VA, Lehmler HJ, Knutson BL. Cationic-anionic vesicle templating from fluorocarbon/fluorocarbon and hydrocarbon/fluorocarbon surfactants. J Coll Interf Sci. 2009;338:82–91. doi: 10.1016/j.jcis.2009.06.022. [DOI] [PubMed] [Google Scholar]
- Padrón A, Alamo R. The use of negative staining and cryo-electron microscopy to understand the molecular mechanism of myosin-linked regulation of striated muscle contraction. Acta Microscópica. 2004;13:14–29. [Google Scholar]
- Pires R, Hartliep B, Signor L, Schoehn G, Lata S, Roessle M, Moriscot C, popov S, Hinz A, Jamin M, Boyer V, Sadoul R, Forest E, Svergun DI, Göttlinger HG, Weisserhorn W. A crescent-shaped ALIX dimer targets ESCRT-III CHMP4 filaments. Structure. 2009;17:843–856. doi: 10.1016/j.str.2009.04.007. [DOI] [PMC free article] [PubMed] [Google Scholar]
- Radermacher M, Ruiz T, Clason T, Benjamin S, Brandt U, Zickermann V. The three-dimensional structure of complex I from Yarrowia lipolytica: A highly dynamic enzyme. J Struct Biol. 2006;154:269–279. doi: 10.1016/j.jsb.2006.02.011. [DOI] [PMC free article] [PubMed] [Google Scholar]
- Ranson NA, Clare DK, Farr GW, Houldershaw D, Horwich AL, Saibil HR. Allosteric signaling of ATP hydrolysis in GroEL-GroES complexes. Nat Struct Mol Biol. 2006;13:147–152. doi: 10.1038/nsmb1046. [DOI] [PMC free article] [PubMed] [Google Scholar]
- Sakurai M. Biological functions of trehalose as a substitute for water. In: Kuwajima K, Goto Y, Hirata F, Kataoka M, Terazima M, editors. Water and Biomolecules. Springer; Berlin: 2009. pp. 219–240. [Google Scholar]
- Simon JR, Adam NA, Salmon ED. Microtubules and tubulin sheet polymers elongate from isolated axonemes in vitro as observed by negative-stain electron microscopy. Micron Microsc Acta. 1991;22:405–412. [Google Scholar]
- Stagg SM, Lander GC, Pulokas J, Fellmann D, Cheng A, Quispe JD, Mallick SP, Avila RM, Carragher B, Potter CS. Automated cryoEM data acquisition and analysis of 284742 particles of GroEL. J Struct Biol. 2006;155:470–481. doi: 10.1016/j.jsb.2006.04.005. [DOI] [PubMed] [Google Scholar]
- Stoylova SS, Flint TD, Kitmitto A, Ford RC, Holzenburg A. Comparison of photosystem II 3D structure as determined by electron crystallography of frozen-hydrated and negatively stained specimens. Micron. 1998;29:341–348. [Google Scholar]
- Wells B, Horne RW, Shaw PJ. The formation of two-dimensional arrays of isometric plant viruses in the presence of polyethylene glycol. Micron. 1981;12:37–45. [Google Scholar]
- Willows RD, Hansson A, Birch D, Al-Karadaghi S, Hansson M. EM single particle analysis of the ATP-dependent BchI complex of magnesium chelatase: an AAA+hexamer. J Struct Biol. 2004;146:227–233. doi: 10.1016/j.jsb.2003.11.019. [DOI] [PubMed] [Google Scholar]
- Zahn R, Harris JR, Pfeifer G, Plückthun A, Baumeister W. Two-dimensional Crystals of the molecular chaperone GroEL reveal structural plasticity. J Mol Biol. 1993;229:579–584. doi: 10.1006/jmbi.1993.1062. [DOI] [PubMed] [Google Scholar]
- Zhao FQ, Craig R. Capturing time-resolved changes in molecular structure by negative staining. J Struct Biol. 2003;141:43–52. doi: 10.1016/s1047-8477(02)00546-4. [DOI] [PubMed] [Google Scholar]
- Zhao FQ, Craig R. Millisecond time-resolved changes occurring in Ca2+-regulated myosin filaments upon relaxation. J Mol Biol. 2008;381:256–260. doi: 10.1016/j.jmb.2008.06.032. [DOI] [PMC free article] [PubMed] [Google Scholar]


