

Abstract
We measured digit span (DS) in two experiments that used computerized presentation of randomized auditory digits with performance-adapted list length adjustment. A new mean span (MS) metric of DS was developed that showed reduced variance, improved test-retest reliability, and higher correlations with the results of other neuropsychological test results when compared to traditional DS measures. The MS metric also enhanced the sensitivity of forward versus backward span comparisons, enabled the development of normative performance criteria with sub-digit precision, and elucidated changes in DS performance with age- and education level. Computerized stimulus delivery and improved scoring metrics significantly enhance the precision of DS assessments of short-term verbal memory.
Introduction
Measures of forward and backward digit span (DS) are among the oldest and most widely used neuropsychological tests of short-term verbal memory (Richardson, 2007). For decades they have been a component of the widely used Wechsler memory scales (WMS) and Wechsler intelligence scales for adults and children (Wechsler, 1997a, 1997b). In each case, digit span is measured for forward and reverse-order (backward) recall of digit sequences. Digit sequences are presented beginning with a length of two digits and two trials are presented at each increasing list length. Testing ceases when the subject fails to accurately report either trial at one sequence length or when the maximal list length is reached (9 digits forward, 8 backward). The total number of lists reported correctly is combined across forward span (FS) and backward span (BS) to produce a Wechsler total correct score.
In traditional DS testing digit salience is influenced by two factors. First, because each list is read aloud by an examiner there are variations in the rate, intensity, emphasis and clarity of digit enunciations on each presentation as well as variations in clarity between different examiners (Reeves, Schmauder, & Morris, 2000; Silverman, 2007). In addition, the digits in each list are not selected randomly. Certain digit sequences (e.g., the local telephone area code) may inflate digit span in geographic regions where particular digit sequences are overlearned and underestimate span where digit sequences conflict with previously overlearned strings (e.g., the digit sequence “415” in a region where the local telephone area code is “451”).
There are also two problems in the methods used by the Wechsler Memory Scale-III (WMS-III) (Wechsler, 1997b) to sample digit list lengths. First, WMS-III testing involves the presentation of two digit lists at each span length, beginning with three digits in FS testing and two digits in BS testing. This procedure is relatively inefficient for subjects with normal memory spans (e.g., 7 digits in FS) because eight trials are delivered before the subject reaches list lengths that challenge memory capacity. A second, more serious problem relates to the suboptimal sampling of list lengths that bound the subjects’ maximal DS: testing ceases as soon as the subject misses two lists of the same length. This procedure assumes that the subject’s “true” maximum length (ML) span can be assessed by only four list presentations: two at the ML and two above. However, it may seriously underestimate the ML of subjects who are distracted or who encounter idiosyncratically difficult digit strings (e.g., permutations of their telephone area code) at a particular length.
In addition, the standard Wechsler total correct metric of DS performance is problematic for two reasons. First, it conflates inconsistent performance with limits in maximal DS. For example, a subject with variable performance who misses one trial in FS testing at lengths of 3, 4, 5, 6, 7 and 8 will have the same total correct score as another subject who accurately reports all trials at lengths 3, 4, and 5, but who fails twice at list length 6. Second, because different subjects receive different numbers of trials, the variance of the total correct metric is high relative to its mean, and is highly skewed. This inflates standard deviations, as reflected in high coefficients of variation (COV, the standard deviation divided by the mean) that is reportedly 23.4% for FS and 36.4% for BS (Wilde, Strauss, & Tulsky, 2004). The high variance reduces sensitivity to clinical abnormalities. For example, the average Wechsler total correct score for patients with mild Alzheimer’s disease shows mean z-score differences of only −0.22 for FS and −0.44 for BS (Wilde et al., 2004), indicating that the typical patient with mild Alzheimer’s disease is poorly discriminated from age-matched control subjects. In addition, the total correct score typically combines performance scores for FS and BS. Historically, these scores were combined to reduce the relative impact of digit span testing on overall IQ measures (Ramsay & Reynolds, 1995). However, subsequent studies have found different FS and BS abnormalities in various clinical populations (Carlesimo, Fadda, Lorusso, & Caltagirone, 1994; Kramer et al., 2003).
The Wechsler maximal span, the longest digit sequence accurately reported in WMS-III testing, is also often included in clinical reports. However, the Wechsler maximal span is also problematic for two reasons. First, it measures DS performance to a precision of only one digit: nearly as large as the standard deviation of the measure (Ardila, 2007). Second, it ignores performance variability. Thus, a subject who misses one digit on lists of 5, 6, and 7 digits, and then misses both lists at length 8 will have the same Wechsler maximal span as a subject who performs flawlessly on lists 5, 6 and 7 digits, but misses both lists at length 8.
Insofar as Wechsler maximal span reflects an underlying continuously varying probabilistic function, some subjects may have maximal spans that are best characterized by non-integer values. For example, if repeated testing were possible, a subject with a true maximal span of 7.5 digits would be expected to produce observed spans of 7 digits and 8 digits on equal numbers of WMS-III test sessions. In order to detect such intermediate spans in a single test, list lengths bounding the maximal span must be sampled on multiple trials.
The current study examined digit span performance using the computerized delivery of randomized digit lists that adaptively increased and decreased to repeatedly sample the lower and upper bounds of DS. During the test, it was also possible to characterize the longest list correctly reported before two errors occurred at the same list length (as in WMS-III maximal span) and the consistency of performance prior to making two successive errors at the same list length (as in WMS-III total correct). However, testing continued after two errors had been made at the same list length until the full set of trials had been delivered. This made it possible to evaluate new metrics that more fully captured the statistical properties of DS performance. In Experiment 1, 30 young volunteers participated in three separate test sessions in order to compare the variability and test-retest reliability of different metrics. In Experiment 2, DS and other cognitive tests were performed by 763 adults (age range 18–65 yrs) in broad community sample obtained as part of an epidemiological study of environmental influences on cognition. This made it possible to evaluate the influences of demographic variables (age, educational level, etc.) on DS performance and evaluate the correlations between different metrics of DS performance and the results of other tests of memory function.
Methods: Experiment 1
Subjects
Thirty one subjects participated in Experiment 1 after giving written informed consent, following IRB regulations of the Veterans Affairs Northern California Health Care System (VANCHCS). The subjects included 16 men and 15 women between the ages of 18 and 46 (mean age = 26 years) with an average of 14.8 years of education. One female subject, who used a mnemonic strategy and had a BS of 13 digits, was excluded from the analysis.
Apparatus and stimuli
Forward and backward digit span testing was performed mid-way through the 90 minute California Cognitive Assessment Battery (CCAB), a set of 15 computerized tests and three adaptive questionnaires1. In order to evaluate test-retest reliability, each subject underwent three complete CCAB test sessions at intervals ranging from 5 to 11 days.
Testing was performed in a quiet testing room using a standard PC controlled by Presentation software (Versions 13 and 14, Neurobehavioral Systems, Albany, CA). The PC was equipped with two monitors, one visible to the subject and one visible to the experimenter. Responses were recorded by the experimenter using a PC-gaming keyboard and mouse. First, the FS testing procedure was explained orally to the subject. Then, spoken digits (1–9) that had been digitally recorded (44.1 kHz, 16 bits) and normalized in mean sound intensity (70 dB SPL) were delivered binaurally through headphones at the rate of 1/s. Digits were randomly sampled without replacement up to list lengths of 9 digits (with single digit duplications when subjects’ spans surpassed 9) with the additional constraints that successive digits could not occur in regular ascending or descending sequence (e.g., 1–2 or 2-1), or in ascending or descending odd or even pairs (e.g., 1–3 or 2–4).
A warning cue followed the final digit at an interval of 1.0 s, cueing subjects to repeat the digit string. The digit sequence was displayed on the examiner’s monitor during list presentation and responses were transcribed by the examiner using the computer keyboard. The experiment logfile included the identity and timing of each digit presented, as well as the identity and timing of each response as transcribed by the examiner.
Subjects received 14 trials with list lengths adaptively adjusted to reflect subject performance. Forward testing began at lists of 3 digits with list length increasing following a 1:2 staircase; i.e., a single correct response increased the length of the subsequent list by one digit, while two incorrect responses were needed to reduce the list length by one digit. Following FS testing, the subject received 14 trials of BS testing with the digit sequence reported in backward order. BS testing began at lists of two digits.
Digit span scoring
The data from individual trials were analyzed using four different automated scoring metrics. Two measures estimated DS following procedures similar to those of the WMS-III. The two-error (TE) ML measure recorded the maximal list length successfully recalled prior to missing two successive lists of the same length. Since digit lists were delivered using a 1:2 staircase, the TE-ML reflected the total number of trials correct prior to two successive misses. To evaluate response consistency prior to achieving the TE-ML, we quantified two-error total trials (TE-TT), the total number of trials (both correct and incorrect) presented prior to two successive errors at the same list length. The TE-TT measure, like the total trial correct measure obtained in the WMS-III, reflects the consistency of performance prior to achieving the TE-ML.
Two metrics were also evaluated that utilized the responses from all 14 trials: the maximum length (ML), the longest list correctly reported on any of the 14 trials, and mean span (MS), the list length where 50% of lists would be correctly reported based on an estimation using psychophysical procedures (Killion, Niquette, Gudmundsen, Revit, & Banerjee, 2004). The MS baseline was set at 0.5 digits less than the initial list length (i.e., 2.5 digits in FS) and was incremented by the fraction of digit strings accurately reported at each succeeding list length.
Table 1 illustrates the testing procedure using data from a single subject. Trial length (column 2) increased with each correct report before the subject’s first miss on length 7 (trial 5). Thereafter, trial lengths varied between 6 and 9 digits. The subject’s TE-ML was 6 (reached on trial 4, prior to two successive misses at lists of length 7) and the TE-TT was 4 (reflecting flawless responding prior to the TE-ML). The subject went on to achieve a ML of 8 (trial 11). The MS was 7.08 as calculated by adding the hit rate for each list length (e.g., 3 = 1.0, 4 = 1.0, 5 = 1.0, 6 = 1.0, 7 = 0.25, 8 = 0.33 and 9 = 0.0, sum = 4.58) to the baseline value of 2.5.
Table 1.
Test results from a single forward span test for one subject. Fourteen trials were presented, with list length (column 2) increasing after each correct trial and decreasing after two successive incorrect trials at the same list length. The lists presented are shown in column 3 and the response in column 4. The correctness of the response is shown in column 5 (1 = correct, 0 = incorrect). Errors are shown in bold and underlined.
| Digit span trial scoring | ||||
|---|---|---|---|---|
| Trial | Length | Presented | Response | Outcome |
| 1 | 3 | 8 5 3 | 8 5 3 | 1 |
| 2 | 4 | 1 8 4 5 | 1 8 4 5 | 1 |
| 3 | 5 | 7 9 6 8 2 | 7 9 6 8 2 | 1 |
| 4 | 6 | 7 9 4 2 5 3 | 7 9 4 2 5 3 | 1 |
| 5 | 7 | 1 7 3 9 2 4 5 | 1 7 9 3 2 4 5 | 0 |
| 6 | 7 | 4 7 1 3 8 2 9 | 4 7 1 3 2 8 9 | 0 |
| 7 | 6 | 9 2 1 7 3 6 | 9 2 1 7 3 6 | 1 |
| 8 | 7 | 3 9 4 8 1 5 6 | 3 9 1 4 8 X X | 0 |
| 9 | 7 | 8 9 7 2 5 6 4 | 8 9 7 2 5 6 4 | 1 |
| 10 | 8 | 2 7 8 1 3 6 5 9 | 2 7 1 3 8 6 5 9 | 0 |
| 11 | 8 | 4 9 6 7 5 2 8 3 | 4 9 6 7 5 2 8 3 | 1 |
| 12 | 9 | 2 3 1 7 9 4 6 5 8 | 2 7 3 1 9 6 4 1 8 | 0 |
| 13 | 9 | 4 1 5 7 8 6 9 2 3 | 4 1 5 7 6 9 2 3 | 0 |
| 14 | 8 | 8 5 4 9 6 2 3 1 | 8 5 4 9 6 3 2 1 | 0 |
Results: Experiment 1
Comparing metrics of DS
Table 2 shows the mean and standard deviations of the four different performance metrics evaluated in Experiment 1, for FS and BS. For FS, mean TE-ML over the three days of testing averaged 7.36 digits, with a range of 5.7 to 9.0 digits in different individuals. TE-ML scores underestimated the maximal span obtained over all 14 digit-list presentations (ML = 7.87 digits) by 0.51 digits. TE-TT averaged 5.91 trials, indicating that subjects missed an average of 0.55 trials prior to achieving their TE-ML. For FS testing, mean MS scores (7.41 digits) were similar to mean TE-ML scores.
Table 2.
Means, standard deviations (SD) and coefficients of variation (COV) for different digit span metrics obtained from forward and backward span (FS and BS) of Experiment 1.
| DS metrics of forward span and backward span | ||||||||
|---|---|---|---|---|---|---|---|---|
| FS | BS | |||||||
| TE-ML | TE- TT | ML | MS | TE-ML | TE-TT | ML | MS | |
| Mean | 7.36 | 5.91 | 7.87 | 7.41 | 5.80 | 5.49 | 6.48 | 6.00 |
| SD | 0.88 | 0.97 | 0.97 | 0.94 | 1.42 | 1.81 | 1.36 | 1.32 |
| COV | 11.96% | 16.41% | 12.33% | 12.69% | 24.48% | 32.97% | 20.99% | 22.00% |
TE-ML = two-error maximum length, TE-TT = two-error total trials, ML = maximum length over all 14 trials, and MS = mean span over 14 trials. COV = coefficient of variation. The results have been averaged over three test sessions.
In BS testing, TE-ML scores averaged 5.80 digits with a range of 4.0 to 10.33 digits for different subjects. Subjects achieved an average ML of 6.48 digits, 0.68 digits longer than the TE-ML. TE-TT averaged 5.49 trials, indicating that subjects missed an average of 0.69 trials prior to achieving their TE-ML. Mean MS scores were significantly higher than mean TE-ML scores (6.00 vs. 5.80, t(89), p < 0.04). This likely reflected the fact that some subjects were confused by the BS test procedure early in the test sequence and hence produced short TE-ML scores because of two successive misses at a relatively short list length. Standard deviations and COV were reduced for FS in comparison with BS for all measures.
We evaluated the reliability of TE-ML scores across the three days of testing. For FS, TE-ML scores within subjects varied by 0–3 digits across testing days with an average absolute span difference between days of 0.96 digits. For backward span, spans varied by 0–3 digits across testing days with an average absolute span difference of 0.93 digits.
Table 3 shows the test-retest correlation matrix for different metrics of FS and BS across the three days of testing. Identity correlations reflect the accuracy with which a particular measure obtained on one day of testing predicts its score on a different day, while correlations across metrics reflect how well the scores on one metric predict the scores of other metrics obtained on different testing days. Across all measures, all correlations were significantly higher for BS than FS testing (12 of 12 comparisons, p < 0.001, sign test). This suggests that the ranking of subjects across trials was more consistent in BS than FS testing.
Table 3.
Mean pairwise correlations among different measures of FS and BS testing across three test sessions.
| Test-retest correlations of DS metrics | ||||||||
|---|---|---|---|---|---|---|---|---|
| FS | BS | |||||||
| TE-ML | TE-TT | ML | MS | TE-ML | TE-TT | ML | MS | |
| TE-ML | 0.39 | 0.26 | 0.51 | 0.52 | 0.67 | 0.59 | 0.76 | 0.75 |
| TE-TT | 0.12 | 0.40 | 0.38 | 0.53 | 0.68 | 0.64 | ||
| ML | 0.68 | 0.67 | 0.81 | 0.83 | ||||
| MS | 0.67 | 0.84 | ||||||
For FS, test-retest correlations were high for repeated ML (0.68) and MS (0.67) metrics. Correlations were also high between ML and MS metrics (0.67), suggesting that both metrics were capturing similar aspects of DS performance. Test-retest reliability was considerably lower for the two-error measures TE-ML (0.39) and particularly TE-TT (0.12). The low test-retest reliability of the TE-TT metric suggests that the small number of trials missed prior to achieving the TE-ML was highly variable across test sessions. Indeed, the ML and MS measures obtained on one day of testing were better predictors of TE-ML and TE-TT scores on other testing days than were the TE-ML and TE-TT metrics themselves.
A similar pattern of test-retest reliability was seen for BS testing. Test-retest correlations were high for repeated ML (0.81) and MS (0.84) metrics, and correlations were also high between ML and MS metrics (0.83). Test-retest reliability was considerably lower for TE-ML (0.67) and TE-TT (0.53) metrics. Again, ML and MS measures obtained on one day of testing were better predictors of TE-ML and TE-TT scores on other testing days than were TE-ML and TE-TT metrics themselves.
Table 4 shows mean FS-BS difference scores for each metric along with associated standard deviations and COVs. FS exceeded BS by more than one digit for ML, TE-ML, and MS metrics. Standard deviations and COVs were larger for TE-ML and particularly TE-TT metrics than for ML or MS. We also compared the incidence of extreme FS-BS difference scores for the two metrics (ML and TE-ML) with single digit precision and for the sub-digit precision MS metric. A total of 53% of test sessions showed FS-BS differences ≥ 2 digits or ≤ −2 digits with the TE-ML metric and 37% of the test sessions produced similarly extreme differences with the ML metric. In contrast, only 3% of test sessions showed such extreme FS-BS differences with the MS metric.
Table 4.
Mean differences between FS and BS, standard deviations and COVs for different metrics
| FS – BS | ||||
|---|---|---|---|---|
| TE-ML | TE-TT | ML | MS | |
| Mean | 1.56 | 0.42 | 1.39 | 1.41 |
| SD | 1.38 | 1.75 | 1.12 | 1.07 |
| COV | 88.4% | 416.7% | 80.5% | 75.9% |
The mean correlations between FS and BS are shown in Table 5. Despite the fact that these measures were obtained on the same day of testing, all correlations were substantially less than the correlations obtained for repeated FS or BS testing across days (Table 3). The correlation matrix reveals that FS scores are somewhat better predictors of BS scores than vice versa. FS ML (r = 0.46) and MS (r = 0.48) metrics were better predictors of BS performance than TE-ML and TE-TT on BS (respectively 0.21 and 0.10). As in the previous test-retest comparisons, ML and MS metrics in FS were better predictors of TE-ML and TE-TT performance in BS than were the TE-ML and TE-TT metrics themselves.
Table 5.
Mean correlations between FS (rows) and BS (columns) for the different metrics, averaged over the three testing sessions. See Table 2 for metric descriptions.
| Correlations between FS and BS | |||||
|---|---|---|---|---|---|
| BS | |||||
| TE-ML | TE-TT | ML | MS | ||
| FS | TE-ML | 0.21 | 0.14 | 0.32 | 0.34 |
| TE-TT | 0.15 | 0.10 | 0.27 | 0.28 | |
| ML | 0.42 | 0.39 | 0.46 | 0.50 | |
| MS | 0.41 | 0.37 | 0.45 | 0.48 | |
Learning effects
Subjects showed small learning effects over three testing days on all metrics, averaging 0.30 digits from day 1 to day 3 for FS and 0.45 digits for BS on the MS metric. An ANOVA of MS scores with Subjects, Day, and Test-Type (FS or BS) as factors showed a significant effect of Day [F(2,58) = 7.93, p < 0.001]. There was also a highly significant effect of Test-Type, reflecting the fact that forward spans exceeded backward spans [F(1,29) = 52.40, p < 0.0001] . However, there was no significant Day x Test-Type interaction [F(2,58) = 0.37, NS], indicating that learning effects of similar magnitude were obtained during FS and BS testing.
Discussion: Experiment 1
DS scores, measured using the two-error DS as in the WMS-III, appeared to vary continuously both in repeated tests of individual subjects and across the subject population. Thus, each subject’s TE-ML score sampled the continuously varying, probabilistic distribution of digit span capacity with single-digit measurement precision. Insofar as span capacity can be represented by a probability distribution reflecting the likelihood of correctly remembering digit lists of different lengths, continued sampling of DS performance would be expected to improve the accuracy of its estimation. It is therefore unsurprising that the ML metric, obtained over all 14 trials, was a more reliable predictor of future performance than the TE-ML metric that was obtained, on average, following 7.91 trials in FS and 7.49 trials in BS.
Comparison with previous digit span testing results
The TE-ML values obtained in the first session of Experiment 1 were somewhat longer than the digit spans of WMS-III normative data for young adults ages 20–29 (Wechsler, 1997) for both FS (7.10 vs. 6.74 digits) and BS (5.53 vs. 5.07 digits) spans. Moreover, the standard deviations of the TE-ML measures were lower than those reported in WMS-III control data for both FS (0.88 vs. 1.31 digits) and BS (1.42 vs. 1.57 digits). Thus, the measurement precision of the TE-ML metric in the current experiment appeared to be slightly superior to that of the Wechsler DS metric in WMS-III normative data. This may have in part reflected an increase in the clarity and regularity of digit presentations as well as a reduction in variance due to randomized digit sampling. Alternatively, reduced variance may have reflected the use of a more homogenous population of subjects, whose high average level of education (mean = 14.8 years) may also help to explain the increases in mean span.
Learning effects
Subjects’ spans improved slightly but significantly across test sessions due to procedural learning. The short intervals between test sessions and the subjects’ knowledge that they would be repeating DS testing may have enhanced procedural learning effects in the current study. However, repeated testing with the WAIS or WMS-III might be expected to produce somewhat greater improvement, because these tests involve the repeated presentation of identical digit lists and hence might produce additional improvements due to content learning. In any case, the results suggest that learning effects should be taken into consideration when interpreting the results of repeated DS testing of individual subjects.
Correlations between FS and BS
Correlational analysis showed relatively high correlations across FS and BS tests performed on separate days in comparison with the correlations between FS and BS tests performed on the same day. This confirms previous suggestions that FS and BS measure partially distinct cognitive operations (Ramsay & Reynolds, 1995) and is consistent with reports of their different clinical sensitivity profiles (Carlesimo et al., 1994; Kramer et al., 2003). As suggested by Lezak (1995), this implies that the standard WMS procedure of combining the total correct scores of FS and BS may reduce clinical sensitivity to neurocognitive deficits, particularly those that selectively impair BS.
Metrics for quantifying digit span performance
Our results indicate that the precision of digit-span assessment was significantly improved when performance was quantified with the ML and MS metrics. This superiority was reflected in lower coefficients of variation and increased test-retest reliability. There were two essential differences between MS and ML metrics: (1) the MS but not the ML metric reflected average digit span performance and hence would be expected to be relatively insensitive to the total number of lists presented. (2) The MS metric quantified DS with sub-digit precision while the ML metric quantified DS with single digit precision. The finer-grained distribution of MS scores permits the selection of performance criteria with controlled false-positive rates (e.g., 5%). In contrast, single-digit precision do not permit the selection of criterion performance levels with desired false-positive rates because quantification is restricted to cardinal digit values. In addition, the sub-digit precision of the MS metric reduced measurement rounding errors in FS-BS difference scores.
Introduction: Experiment 2
Experiment 2 was performed to examine digit span performance in a larger population of subjects varying in age and educational background. It also permitted the examination of correlations between different DS metrics and performance on other widely used neuropsychological tests.
Methods
In Experiment 2, a 10-list test was administered to 763 community volunteers in Rotorua, New Zealand, who were participating in a study investigating the effects of hydrogen sulfide exposure on health. FS and BS testing was performed midway through a brief 30 min computerized assessment battery that included six tests from the CCAB. The methods were similar to those used in Experiment 1 with the following exceptions: (1) Only 10 digit lists were used, to reduce the time required for digit span testing, (2) FS testing began at 5 digits and BS testing began at 4 digits, and (3) Scoring was modified so that the examiner could check an “all correct” box to indicate the correct report of the entire digit string. Data were also gathered on four paper-and-pencil memory tests for a subset of the subjects (N = 749). The tests included the Hopkins Verbal Learning Test (Shapiro, Benedict, Schretlen, & Brandt, 1999), the Benton Visual Retention Test (Benton, 1962), the digit-symbol test (Joy, Kaplan, & Fein, 2004), and the NART (O’Caroll & Gilleard, 1986). Because a large number of demographic and scoring correlations were examined, a strict criterion (p < 0.01) was used for evaluating statistical significance.
Subjects
Subjects ranged in age from 18 to 65 yrs (mean age = 46.5 years) with an average of 12.5 years of education. Subject recruitment was designed to obtain a random selection of Rotorua residents of these ages, subject to stratification according to high, medium or low levels of presumptive H2S exposure. Participants had to have resided in the city for 3 or more years. The only exclusions were inability to speak and write English, disability that would prevent visiting the study facility, and blindness. All subjects signed written consent forms approved by the Northern Y Regional Ethics Committee in Rotorua and by the IRB for the UC Davis/VANCHCS CTSC.
Results: Experiment 2
Metrics of DS performance
Table 6 shows means and variance measures for the different DS metrics for FS and BS in Experiment 2. The pattern of results was similar to that seen in Experiment 1. FS TE-ML scores averaged 6.35 digits, slightly less than MS scores (6.52) and nearly one-half digit less than ML scores (6.77). Standard deviations were somewhat increased relative to Experiment 1, reflecting the less homogenous population and the reduction in measurement precision due to shorter test duration. BS TE-ML scores were decreased by 1.74 digits with respect to FS scores. On average, the ML over the 10 trials was 0.68 digits longer than the TE-ML during BS testing.
Table 6.
Means, standard deviations, and coefficients of variation for FS and BS measures in Experiment 2.
| FS | BS | |||||||
|---|---|---|---|---|---|---|---|---|
| TE-ML | TE-TT | ML | MS | TE-ML | TE-TT | ML | MS | |
| Mean | 6.35 | 2.94 | 6.77 | 6.52 | 4.61 | 2.69 | 5.19 | 4.91 |
| SD | 1.15 | 1.48 | 1.03 | 1.00 | 1.22 | 1.38 | 1.09 | 1.06 |
| COV | 18.05% | 50.27% | 15.27% | 15.40% | 26.56% | 51.24% | 20.96% | 21.49% |
Figure 1 (left) shows the population distributions of scores for the different measures of FS. TE-ML, MS, and ML were positively skewed. TE-ML showed a median span of 6 with 80% of subjects showing spans between 5 and 7 digits. The lower tail of the TE-ML distribution was broad with 20.2% of subjects showing TE-MLs of 5 and 2.9% of subjects showing TE-MLs of 4. The median MS span was 6.45 with 92% of subjects producing MS scores between 5 and 7 digits. Also, there was less spread into the lower tail of the MS than the TE-ML metric, with only 5.00% showing MS scores of 5.08 or below. ML measures had a median of 7 digits, with more than 86% of subjects showing maximal spans between 6 and 8 digits.
Figure 1.

Population distributions of FS scores for TE-ML, ML, and MS for subjects in Experiment 2. Left: FS, Right: BS. For MS the percentages of scores within each 0.5- digit interval are shown.
Although average MS and TE-ML scores were similar in the population as a whole, there were significant differences in individual subjects. Overall, 13.7% of subjects missed two trials relatively early in the test sequence but went on to achieve MS scores that were at least 0.9 digits beyond their TE-ML and 4.3% of subjects had TE-ML scores that were at least 0.9 digits longer than their MS scores. For subjects with abnormal TE-ML scores (i.e., 4 or less), 64% also had abnormally low MS spans (< 5.08). However, of the 5% of subjects who showed significant abnormalities for the MS measure, only 37% had abnormal TE-ML scores.
Figure 1 (right) shows the distribution of BS scores, where TE-ML spans fell between 4 and 6 for 74% of subjects. The lower tail of the TE-ML distribution was discontinuous, in part because testing began with strings of length 3. Overall, 18.9% of subjects had TE-ML scores of 3, but no subjects produced scores below 3. MS scores fell between 3.5 and 6.5 in 85.3% of subjects with a median of 4.83. In the lower tail, 3.8% of subjects produced BS MS scores below 3.25 with a minimum of 2.5. In BS testing, 19.1% of subjects missed two trials relatively early in the test sequence, but went on to achieve MS that exceeded their TE-ML by at least 0.9 digits and 4.3% of subjects had TE-ML scores that exceed MS scores by at least 0.9 digits. Further investigation showed that of the subjects with low BS TE-MLs only 20% had abnormal MS scores. In contrast, of the subjects with low MS scores, 72% also had low TE-MLs. ML measures had a median of 5 digits, with 75% of subjects showing BS ML scores between 5 and 7 digits. An analysis of the distributions of the different metrics showed that skewness was reduced for ML in comparison with the other metrics.
Correlations between different measures of FS and BS are shown in Table 7. Again, the highest correlations were found for ML (r = 0.50) and MS (r = 0.56), whereas lower correlations were found for TE-ML (r = 0.43) and particularly for TE-TT (r = 0.21). Statistical analysis of z-transformed correlations revealed significant differences (p < .05) between ML and TE-TT and between MS and both TE-ML and TE-TT.
Table 7.
Correlations between different metrics of FS (rows) and BS (columns) in Experiment 2.
| Correlations between FS and BS: Exp. 2 | |||||
|---|---|---|---|---|---|
| BS | |||||
| TE-ML | TE-TT | ML | MS | ||
| FS | TE-ML | 0.43 | 0.25 | 0.48 | 0.50 |
| TE-TT | 0.32 | 0.21 | 0.35 | 0.37 | |
| ML | 0.46 | 0.27 | 0.50 | 0.54 | |
| MS | 0.49 | 0.28 | 0.53 | 0.56 | |
Figure 2 shows the distribution of FS-BS difference scores. All distributions are roughly normal, but the MS distribution showed less variance, with 82% of subjects showing FS-BS differences in the range of 0.5–3.0 digits and difference scores exceeding 3.20 digits observed in 5.0% of the control population. In contrast, broader upper tails were observed for the ML and TE-ML distributions. For TE-ML difference scores, 6.6% of FS-BS differences equaled or exceeded 4 digits and 25.6% equaled or exceeded 3 digits. For ML difference scores, 2.1% of difference scores equaled or exceeded 4 digits and 19% equaled or exceeded 3 digits.
Figure 2.
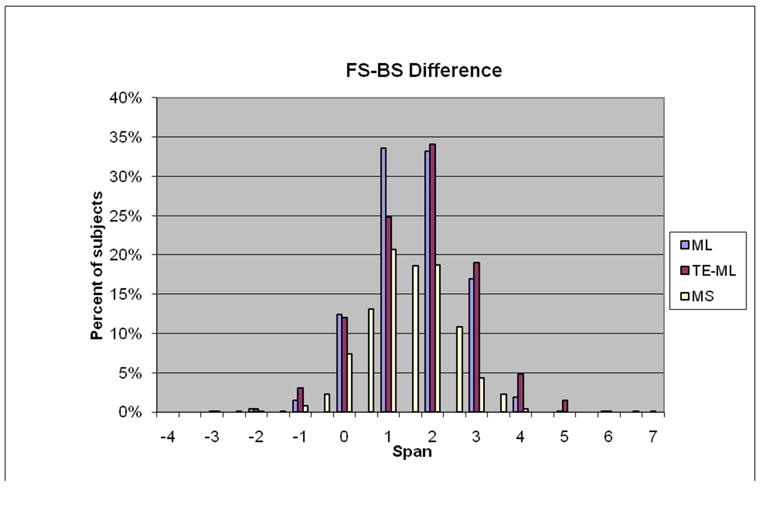
The population distribution of FS-BS difference scores for TE-ML, ML, and MS metrics In Experiment 2.
Correlations with age and education
The correlations between DS metrics, age, and education levels are shown in Table 8. None of the FS metrics correlated significantly with age. However, BS measures of ML, TE-ML, and MS showed small but significant negative correlations with age [r = −0.13 to −0.14, t(672) = 3.65 to 3.95, p < 0.0001]. All FS and BS metrics, except TE-TT, correlated positively with years of education [r = 0.11 to 0.20, t(672) ranged from 3.07 to 5.75, p < 0.0001] with larger correlations uniformly observed for BS than FS measures.
Table 8.
Correlations between DS metrics, age, and education level (Ed).
| FS | BS | |||||||
|---|---|---|---|---|---|---|---|---|
| TE-ML | TE-TT | ML | MS | TE-ML | TE-TT | ML | MS | |
| Age | −0.07 | −0.02 | −0.03 | −0.06 | −0.14 | −0.04 | −0.14 | −0.13 |
| Ed | 0.11 | 0.05 | 0.13 | 0.15 | 0.15 | 0.07 | 0.20 | 0.19 |
Correlations with the results of other neuropsychological tests
Correlations between digit span metrics for FS and BS and selected measures from the Hopkins Verbal Learning Test-Revised (HVLT-R) (Shapiro et al., 1999), the Symbol-Digit test, the National Adult Reading Test (NART), and Benton Visual Retention Test (BVRT), (Sivan, 1992) are shown in Table 9. With the exception of TE-TT, all DS metrics showed significant positive correlations with measures of verbal recall (HVLT total recall, HVLT delayed recall, BVRT correct, and Digit-Symbol performance) and significant negative correlations with errors (BVRT errors and NART). BS was a better predictor of performance on other neuropsychological measures than was FS: excluding TE-TT, all 18 correlations were greater for BS than FS [Sign test, p < 0.00001].
Table 9.
Correlations between DS metrics and other neuropsychological tests for FS and BS.
| Correlations between DS metrics and other neuropsychological measures | ||||||||||||
|---|---|---|---|---|---|---|---|---|---|---|---|---|
| FS | BS | |||||||||||
| HVLT (TR) | HVLT (Del) | DSym | NART (Err) | BVRT (Corr) | BVRT (Err) | HVLT (TR) | HVLT (Del) | DSym | NART (Err) | BVRT (Corr) | BVRT (Err) | |
| TE-ML | 0.20 | 0.13 | 0.22 | −0.25 | 0.16 | −0.24 | 0.30 | 0.27 | 0.28 | −0.27 | 0.22 | −0.33 |
| TE-TT | 0.12 | 0.07 | 0.12 | −0.18 | 0.10 | −0.16 | 0.09 | 0.09 | 0.11 | −0.12 | 0.10 | −0.13 |
| ML | 0.20 | 0.12 | 0.22 | −0.25 | 0.16 | −0.25 | 0.32 | 0.30 | 0.32 | −0.32 | 0.26 | −0.38 |
| MS | 0.22 | 0.14 | 0.23 | −0.28 | 0.18 | −0.28 | 0.33 | 0.29 | 0.32 | −0.33 | 0.26 | −0.40 |
HVLT = Hopkins Verbal Learning Test. DSym = digit symbol. NART = National Adult Reading Test. BVRT = Boston Visual Retention Test. (TR) = total recall, (Del) = delayed, Err = errors, Corr = correct.
Correlations with neuropsychological test results varied slightly with the different DS metrics with the MS metric correlating more highly than either the TE-ML or TE-TT metrics [Sign test, p < 0.0005] as well as the ML metric [9 of 12 comparisons, Sign test, p < 0.05]. The ML and TE-ML metrics did not differ significantly from each other. However, all 12 correlations with other neuropsychological tests results were higher for both metrics than with TE-TT [Sign test, p < 0.0005].
Discussion: Experiment 2
Comparisons with previous normative digit span test results
TE-ML scores in Experiment 2 were similar to those reported for the age-matched WMS-III control data sample (Wechsler, 1997) for both FS (6.4 vs. 6.6 digits) and BS (4.6 vs. 4.9 digits). However, the variance of the TE-ML metric in the current study was reduced in comparison with the variance reported in the WMS-III control data for both FS (1.15 vs. 1.31 digits) and BS (1.22 vs. 1.57 digits). Normative data from the WMS-III (Wechsler, 1997) reported an average FS-BS difference score of 1.6 in subjects aged 18–20 that increased to 1.8 in subjects aged 55–65 yrs. In the current study, the TE-ML difference scores averaged 1.7 digits, similar to that predicted from the WMS-III normative data on the basis of the mean age of our subjects. However, the standard deviation of the TE-ML FS-BS difference (1.3) was slightly lower than the variance reported for age-matched WMS-III normative data (1.4). Because of the 1:2 staircase procedure used in the current study, the TE-ML measures were obtained from fewer trials than the corresponding measures obtained from the WMS-III. Thus, the reduced variance of the TE-ML metrics of FS, BS, and FS-BS would appear likely to reflect the increased clarity and regularity of digit sequence presentations and possibly the use of randomized digit lists.
Metrics of digit span performance
The MS and ML metric again appeared to offer a number of advantages in comparison with the TE-ML or TE-TT metrics: reduced variance, higher correlations between FS and BS, and higher correlations with the results of other neuropsychological tests. The tightened distribution of MS measures would increase its clinical sensitivity in comparison with TE-ML span measures. For example, the abnormality threshold of the MS metric for FS testing (5.08) was more than 1 digit greater than the abnormality threshold (4) of the TE-ML metric. Moreover, the finer-grain of the MS distribution enabled the 5% false-positive rates for excessive FS-BS differences to be established with precision (3.08 digits), whereas the large TE-ML difference threshold of 4 produced a false-positive rate of 6.6%. As a result, the MS measure would be more sensitive to abnormal FS-BS differences in comparison with TE-ML measures.
Comparison of the results in Experiment 1 and Experiment 2
The results of Experiment 2 revealed that BS decreased with age and increased with education, whereas FS increased with educational level alone. The larger increase in BS than FS scores between Experiment 1 and Experiment 2 is consistent with the results of prior studies showing significant effects of education on both FS and BS (Gregoire & Van der Linden, 1997) and larger age-related differences in BS scores (Babcock & Salthouse, 1990; Hayslip & Kennelly, 1982; Hester, Kinsella, & Ong, 2004).
General discussion
Digit presentation effects on the precision of digit span assessment
The TE-ML metric showed lower variance in both experiments in comparison with WMS-III normative data scored with a similar algorithm. One explanation is that the computerized digit delivery reduced variability in the rate and clarity of digit presentation associated with variable digit articulation within and across examiners. The use of constrained random digit sequences also enabled multiple tests at the same list length without concern for the repetition of particular digit sequences, and may have improved the generalizability of results in regions where particular digit sequences in the WMS-III digit lists occur systematically (e.g., telephone area codes).
Improving the measurement of DS performance
The use of list lengths that sampled the upper and lower bound of digit span revealed that the TE-ML procedure of terminating testing after two errors underestimated the true ML span by more than 0.5 digits. The poorest metric was the TE-TT. The TE-TT, like the widely used WMS-III total correct score, reflects the consistency of performance at subthreshold list lengths. In comparison with the TE-ML, the TE-TT showed higher variance, a greater coefficient of variation, poorer test-retest reliability, lower correlations both with itself and with other measures of digit span performance across separate days of testing, and poorer correlations with scores on other neuropsychological tests of memory.
Sampling critical list lengths adaptively on additional trials improved the assessment of DS. In comparison with TE-ML and TE-TT metrics, MS and ML showed improved test-retest reliability, lower variance, higher correlations between FS and BS, and were better predictors of performance on other memory tests. MS was preferable to the ML metric because of its insensitivity to the number of lists presented and its finer measurement grain that permitted the establishment of normal performance criteria with precise false-positive rates.
Comparisons with other computerized sub-tests of digit span
A number of computerized cognitive tests have been developed that assess memory for digits (Wild, Howieson, Webbe, Seelye, & Kaye, 2008). For example, the Cognitive Drug Research (CDR) test battery (Parrott, Garnham, Wesnes, & Pincock, 1996) and the Cognitive Drug Research computerized Assessment System (COGDRAS) (Simpson, Wesnes, & Christmas, 1989) assess memory for digits using a modified Sternberg task while the Automated Neuropsychology Assessment Metrics (ANAM) (Kane & Kay, 1992) uses a Digit Set Comparison task. However, these tasks measure recognition memory for digit strings rather than verbal working memory as assessed in traditional DS testing.
There are also three computerized test batteries that include verbal working memory assessment of digit span: the NeuroCog FX (Fliessbach, Hoppe, Schlegel, Elger, & Helmstaedter, 2006), IntegNeuro (Gordon, Cooper, Rennie, Hermens, & Williams, 2005), and MicroCog (Powell et al., 1993). These tests differ from the CCAB DS test in several important ways. First, the CCAB DS test is designed to enhance the efficiency of test administration by a trained examiner who administers the test. Other computerized tests are designed for unsupervised self-administration by the test subject. While self-administration enhances test efficiency, it can increase spurious variation in DS performance due to motivation, emotional lability, poor comprehension of test instructions, and lack of computer literacy (Wild et al., 2008). Second, the CCAB DS test uses calibrated auditory digit presentation while the other tests present digits visually. There are significant intermodality differences in digit span performance, particularly for BS (Powell & Hiatt, 1996; Ramsay & Reynolds, 1995). Moreover, auditory digit presentation is thought to more directly assess the core systems of verbal working memory (Baddeley, 2003). In addition, in the current experiments subjects used verbal report, whereas existing computerized tests require subjects to use manual responses with a keypad or touch-screen. Manual responses are influenced by the subject’s familiarity with computer response devices and by motor or executive control processes. Additionally, the visual search for digits on a keyboard or computer screen requires visuospatial attention and may interfere with the iconic representations of visually presented lists. Finally, although list lengths are adaptively adjusted in one of the computerized batteries, test scoring is based on metrics that are similar to the TE-ML or TE-TC. The current experiments demonstrate that these metrics are less accurate and reliable than MS and ML scoring procedures.
Conclusions
Examiner-administered computerized tests of DS offer a number of advantages over traditional paper-and-pencil tests. First, they improve the consistency and clarity of digit list delivery and permit the use of randomized digit lists. Second, the use of adaptive adjustment of digit list length using a 1:2 staircase shortens the time required to measure spans near the limits of average subjects’ capacities and therefore optimizes the sampling of digit span performance. The traditional approach of ending the test after two errors fails to adequately sample performance and metrics based on this approach neglect useful information that is present in performance variability around maximal span. Acquiring more samples improves the reliability of span measures particularly when combined with a mean span (MS) metric that provides sub-digit estimates of DS performance and generates a more continuous distribution of DS scores increasing sensitivity to FS-BS difference scores. Examiner-administered computer-controlled measures of digit span can significantly enhance the reliability and precision of digit span assessments of short-term verbal memory.
Acknowledgments
Supported by grants from the Office of Research and Development, Rehabilitation R&D Service, Department of Veterans Affairs and by NIH grant ES014038.
Footnotes
The CCAB includes the following computerized tests and questionnaires: Finger tapping, simple reaction time, symbol-digit, Stroop, digit span forward and backward, phonemic and semantic verbal fluency, card sorting, verbal list learning, spatial span, trail making, symmetry detection, design fluency, the Wechsler Test of Adult Reading (WTAR), visual feature conjunction, the Paced Auditory Serial Addition Task (PASAT), the Cognitive Failures Questionnaire (CFQ), the post-traumatic stress disorder (PTSD) symptoms checklist, and a traumatic brain injury (TBI) questionnaire.
References
- Ardila A. Normal aging increases cognitive heterogeneity: analysis of dispersion in WAIS-III scores across age. Arch Clin Neuropsychol. 2007;22(8):1003–1011. doi: 10.1016/j.acn.2007.08.004. [DOI] [PubMed] [Google Scholar]
- Babcock RL, Salthouse TA. Effects of increased processing demands on age differences in working memory. Psychology and Aging. 1990;5:421–428. doi: 10.1037//0882-7974.5.3.421. [DOI] [PubMed] [Google Scholar]
- Baddeley A. Working memory and language: an overview. J Commun Disord. 2003;36(3):189–208. doi: 10.1016/s0021-9924(03)00019-4. [DOI] [PubMed] [Google Scholar]
- Benton AL. The visual retention test as a constructional praxis task. Confinia Neurologica. 1962;22:141–155. doi: 10.1159/000104348. [DOI] [PubMed] [Google Scholar]
- Carlesimo GA, Fadda L, Lorusso S, Caltagirone C. Verbal and spatial memory spans in Alzheimer’s and multi-infarct dementia. Acta Neurol Scand. 1994;89(2):132–138. doi: 10.1111/j.1600-0404.1994.tb01648.x. [DOI] [PubMed] [Google Scholar]
- Fliessbach K, Hoppe C, Schlegel U, Elger CE, Helmstaedter C. NeuroCogFX--a computer-based neuropsychological assessment battery for the follow-up examination of neurological patients. Fortschr Neurol Psychiatr. 2006;74(11):643–650. doi: 10.1055/s-2006-932162. [DOI] [PubMed] [Google Scholar]
- Gordon E, Cooper N, Rennie C, Hermens D, Williams LM. Integrative neuroscience: the role of a standardized database. Clin EEG Neurosci. 2005;36(2):64–75. doi: 10.1177/155005940503600205. [DOI] [PubMed] [Google Scholar]
- Gregoire J, Van der Linden M. Effect of age on forward and backward digit spans. Aging, Neuropsychology, and Cognition. 1997;4(2):140–149. [Google Scholar]
- Hayslip B, Kennelly KJ. Short-term memory and crystallized-fluid intelligence in adulthood. Research on Aging. 1982;4:314–332. [Google Scholar]
- Hester RL, Kinsella GJ, Ong B. Effect of age on forward and backward span tasks. J Int Neuropsychol Soc. 2004;10(4):475–481. doi: 10.1017/S1355617704104037. [DOI] [PubMed] [Google Scholar]
- Joy S, Kaplan E, Fein D. Speed and memory in the WAIS-III Digit Symbol--Coding subtest across the adult lifespan. Archives of Clinical Neuropsychology. 2004;19(6):759–767. doi: 10.1016/j.acn.2003.09.009. [DOI] [PubMed] [Google Scholar]
- Kane RL, Kay GG. Computerized assessment in neuropsychology: A review of tests and test batteries. Neuropsychology Review. 1992;3:1–117. doi: 10.1007/BF01108787. [DOI] [PubMed] [Google Scholar]
- Killion MC, Niquette PA, Gudmundsen GI, Revit LJ, Banerjee S. Development of a quick speech-in-noise test for measuring signal-to-noise ratio loss in normal-hearing and hearing-impaired listeners. J Acoust Soc Am. 2004;116(4 Pt 1):2395–2405. doi: 10.1121/1.1784440. [DOI] [PubMed] [Google Scholar]
- Kramer JH, Jurik J, Sha SJ, Rankin KP, Rosen HJ, Johnson JK, et al. Distinctive neuropsychological patterns in frontotemporal dementia, semantic dementia, and Alzheimer disease. Cogn Behav Neurol. 2003;16(4):211–218. doi: 10.1097/00146965-200312000-00002. [DOI] [PubMed] [Google Scholar]
- Lezak MD. Neuropsychological Assessment. 3. New York: Oxford University Press; 1995. [Google Scholar]
- O’Caroll RE, Gilleard CJ. Estimation of premorbid intelligence in dementia. British Journal of Clinical Psychology. 1986;25(Pt 2):157–158. doi: 10.1111/j.2044-8260.1986.tb00690.x. [DOI] [PubMed] [Google Scholar]
- Parrott AC, Garnham NJ, Wesnes K, Pincock C. Cigarette smoking and abstinence: comparative effects upon cognitive task performance and mood state over 24 hours. Hum Psychopharmacol. 1996;11:391–400. [Google Scholar]
- Powell DH, Hiatt MD. Auditory and visual recall of forward and backward digit spans. Percept Mot Skills. 1996;82(3 Pt 2):1099–1103. doi: 10.2466/pms.1996.82.3c.1099. [DOI] [PubMed] [Google Scholar]
- Powell DH, Kaplan EF, Whitla D, Weintraub S, Catlin R, Funkenstein HH. Microcog: Assessment of cognitive functioning (Version 2.1) (Version 2.1) San Antonio, TX: The Psychological Corporation; 1993. [Google Scholar]
- Ramsay MC, Reynolds CR. Separate digits tests: a brief history, a literature review, and a reexamination of the factor structure of the Test of Memory and Learning (TOMAL) Neuropsychol Rev. 1995;5(3):151–171. doi: 10.1007/BF02214760. [DOI] [PubMed] [Google Scholar]
- Reeves C, Schmauder AR, Morris RK. Stress grouping improves performance on an immediate serial list recall task. J Exp Psychol Learn Mem Cogn. 2000;26(6):1638–1654. doi: 10.1037//0278-7393.26.6.1638. [DOI] [PubMed] [Google Scholar]
- Richardson JT. Measures of short-term memory: a historical review. Cortex. 2007;43(5):635–650. doi: 10.1016/s0010-9452(08)70493-3. [DOI] [PubMed] [Google Scholar]
- Shapiro AM, Benedict RH, Schretlen D, Brandt J. Construct and concurrent validity of the Hopkins Verbal Learning Test-revised. Clin Neuropsychol. 1999;13(3):348–358. doi: 10.1076/clin.13.3.348.1749. [DOI] [PubMed] [Google Scholar]
- Silverman MJ. The effect of paired pitch, rhythm, and speech on working memory as measured by sequential digit recall. J Music Ther. 2007;44(4):415–427. doi: 10.1093/jmt/44.4.415. [DOI] [PubMed] [Google Scholar]
- Simpson PM, Wesnes KA, Christmas L. A computerised system for the assessment of drug-induced performance changes in young, elderly and demented populations. British Journal of Clinical Pharmacology. 1989;27:711–712P. [Google Scholar]
- Sivan AB. Benton Visual Retention Test. 5. San Antonio, TX: The Psychological Corporation; 1992. [Google Scholar]
- Wechsler D. WechslerAdult Intelligence Scale –Administration and scoring manual. 3. San Antonio, TX: 1997a. [Google Scholar]
- Wechsler D. WMS-III Administration and Scoring Manual. San Antonio, TX: The Psychological Corporation. Harcourt Brace & Co; 1997b. [Google Scholar]
- Wild K, Howieson D, Webbe F, Seelye A, Kaye J. Status of computerized cognitive testing in aging: a systematic review. Alzheimers Dement. 2008;4(6):428–437. doi: 10.1016/j.jalz.2008.07.003. [DOI] [PMC free article] [PubMed] [Google Scholar]
- Wilde NJ, Strauss E, Tulsky DS. Memory span on the Wechsler Scales. J Clin Exp Neuropsychol. 2004;26(4):539–549. doi: 10.1080/13803390490496605. [DOI] [PubMed] [Google Scholar]