

Abstract
Transcriptional repression by the C-terminal Binding Protein (CtBP) is proposed to require NAD(H). Prior studies have implicated CtBP in transcriptional repression of the p21waf1/cip1 gene. Similarly, the NAD-dependent Poly(ADP)ribose Polymerase (PARP1) may affect p21 expression via its NAD-dependent enzymatic activity; we therefore asked if PARP1 and CtBP were functionally linked in regulating p21 transcription. We found that restraint of basal p21 transcription requires both CtBP and PARP1. PARP inhibition attenuated activation of p21 transcription by both p53-independent and p53-dependent processes, in a CtBP-dependent manner. CtBP1+2 or PARP1+2 knockdown partially activated p21 gene expression, suggesting relief of a co-repressor function dependent on both proteins. We localized CtBP-responsive repression elements to the proximal promoter region, and found ZBRK1 over-expression could also overcome DNA damage-dependent, but not p53-dependent activation through this region. By chromatin immunoprecipitation we find dismissal of CtBP from the proximal promoter following DNA-damage, and that PARP1 associates with a CtBP co-repressor complex in nuclear extracts. We propose a model in which both CtBP and PARP functionally interact in a co-repressor complex as components of a molecular switch necessary for p21 repression, and following DNA damage signals activation of p21 transcription by co-repressor dismissal and co-activator recruitment.
Keywords: Poly(ADP)ribose Polymerase, p21, CtBP, PARP inhibitor
Introduction
CtBP was originally identified as a binding partner for the E1A oncoprotein (Boyd et al., 1992), and serves as a co-repressor for a variety of cellular transcriptional repressors. Candidate gene targets were subsequently suggested from differential gene expression data by comparison of wild type and CtBP isoform deficient mouse embryonic fibroblasts (MEFs) (Grooteclas and Frisch, 2000; Grooteclas et al., 2003), while immunoprecipitation and mass spectrometry analysis highlighted the diverse nature of the CtBP containing complex (Shi et al., 2003). Although the biological implications of CtBP co-repressor function at individual gene targets are not well described, data from CtBP knockout mice and Drosophila indicate the biological role of CtBP appears to be for controlling transcription pathways important in oncogenesis and essential developmental programs (Nibu et al., 1998; Hildebrand and Soriano, 2002; Bergman and Blades, 2006).
The CtBP gene family (Boyd et al., 1993; Schaeper et al., 1995) consists of two widely expressed genes encoding 3 proteins (Furusawa et al., 1999; Sewalt et al., 1999) that bind to diverse repressor proteins through a PxDLS motif. The co-repressor activity of the two major homologues (CtBP1 and CtBP2) is inferred from co-purification with Histone Deacetylases (HDACs) and Histone Methyltransferases (HMTs) (Sundqvist et al., 1998; Shi et al., 2003), and repression activity as a GAL4 fusion protein in UAS-dependent reporter assays. CtBP structurally resembles a 2-hydroxyacid dehydrogenase and some studies suggest that co-repressor activity requires both NAD(H) binding and a proposed enzymatic activity (Zhang et al., 2002; Nardini et al., 2003). The importance of these functions is unclear (Chinnadurai, 2007), with NAD(H) binding and putative catalytic functions, including NAD dependent dimerization (Balasubramanian et al., 2003), important in some (Kumar et al., 2002) but not all experimental paradigms (Quinlan et al., 2006).
NAD+ is also a substrate for PARP1 activated in response to DNA damage. PARP1 facilitates cellular responses and DNA repair by catalyzing poly(ADP-ribosyl)action of itself, histone and other proteins (Schreiber et al., 2006). PARP1 also regulates transcription by affecting chromatin structure and may bind DNA directly to alter gene expression (Kim et al., 2004; Krishnakumar et al., 2008) either through its chromatin modifying enzymatic activity or by direct interactions with other transcriptional regulatory proteins (Ju et al., 2004; Ambrose et al., 2007), similar to a co-activator and co-repressor model of action. These findings demonstrate gene specific transcriptional control by PARP proteins. One proposed mechanism is for PARP1 to act as a switch, converting from a repressor to an activator following its activation (Ju et al., 2004).
CtBP was implicated in p21 gene transcription by analysis of CtBP-dependent differential expression microarray data (Grooteclas et al., 2003), suggesting that CtBP co-repressor activity might restrain p21 expression. Interestingly, PARP enzymatic inhibition also attenuated p21 expression after γ-IR (Wielder et al., 2003), implying that either PARP directly, or the consequences of PARP activity are required for p21 activation. The p21 promoter is activated by p53-dependent and -independent pathways during cytotoxic stress or DNA damage (Gartel and Radhakrishnan, 2005) and p53-independent activation required a BRCA1 activator function at the proximal promoter (Somasundaram et al., 1997). Interestingly, CtBP has been shown to decrease BRCA1 mediated p21 activation (Li et al., 1999) and is recruited to BRCA1 by CtIP (C-terminal Interacting Protein). We hypothesized that CtBP and PARP might have a common functional link through NAD and cooperate in a switch between repression and activation of p21 transcription.
In this report we demonstrate that CtBP is required for the attenuation of p21 activation observed with PARP inhibitors suggesting a functional interaction between CtBP and PARP in restraint of basal p21 expression and activation in response to DNA damage. CtBP restrained both p53-dependent and p53-independent p21 activation, and in the absence of CtBP, activation of p21 does not require PARP activity. We found CtBP1 localized to the proximal p21 promoter by chromatin immunoprecipitation, and demonstrated the CtBP-dependent element mapped within a region important for p53-independent activation by promoter-reporter assays. These data suggest a model in which both PARP and CtBP cooperate in, and are necessary for maintenance of a repression complex at the proximal promoter, with PARP activity subsequently participating in p21 promoter activation in part through CtBP co-repressor dismissal.
Results
PARP inhibitor attenuation of activated p21 expression requires CtBP
Previous studies independently suggest that PARP (Wieler et al., 2003) and CtBP (Grooteclas et al., 2003) are among the many factors implicated in regulation of the p21 promoter. Because of a link between CtIP recruitment and p21 transcriptional activation (Li et al., 1999) and a potential role for NAD in CtBP function, we asked if there was a functional link between the CtBP co-repressor and PARP activity in p21 expression.
We first examined the effects of PARP inhibition on p21 expression in LNCaP cells following different methods of DNA damage pathway activation. Both UV-C and H2O2 induced poly(ADP)-ribose (PAR) accumulation (Figure S1), and UV-C activation of p21 mRNA accumulation was attenuated by pre-treatment with the PARP inhibitors 3AB (Figure 1A) and PJ34 (Figure 1B) at 6 through 18 hours. These results were replicated in other cell lines (U2OS, HeLa, H1299 and mouse embryonic fibroblasts) with adriamycin, γ-IR and H2O2, demonstrating PARP-dependence across the various pathways for p21 activation (for example Figures 2A and 7, and data not shown). These treatments did not alter CtBP1 or CtBP2 protein levels (Figures 1A and B; 3, S4). PARP inhibition did not alter stabilization of p53 or serine-15 (p53pSer15) phosphorylation, demonstrating that PARP inhibition does not impede UV-C induced ATR-dependent p53 activation (Figures 1A, 2B; Canman et al., 1998).
Figure 1. PARP inhibition attenuates UV-C p21 activation.
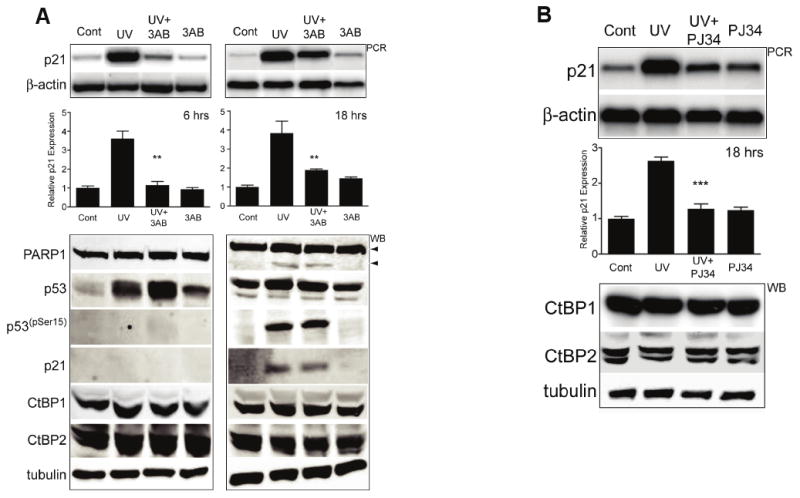
(A) P21 expression induced by UV-C is shown by semi-quantitative (sq)PCR (top panel) in LNCaP cells. A typical single, triplicate experiment is shown (n=3) performed either 6 (A: left) or 18 (B: right) hours following the UV-C treatment. Graphs: densitometric, quantified triplicate data from spur, ** = p<0.01 comparing UV to UV+3AB. (Lower panels) Western blots (WB) of parallel treated samples. p53(pSer15) = phosphoSerine15 p53. Arrowheads = full length (upper, 110kDa) and cleavage product (lower; 85kDa) of PARP1; minimal PARP cleavage is seen and only at 18 hours. Tubulin is shown as a loading control. UV = UV-C treatment alone; UV-C+3AB = 1 hour pre-incubation with 3AB followed by UV-C treatment; 3AB = 3AB incubation alone.
(B) Similar sqPCR and western blot results are seen in cells treated as in (A) using UV-C and the PARP inhibitor PJ-34, analyzed after 18 hours.
Figure 2. CtBP is required for PARP inhibitor attenuation of p21 activation.
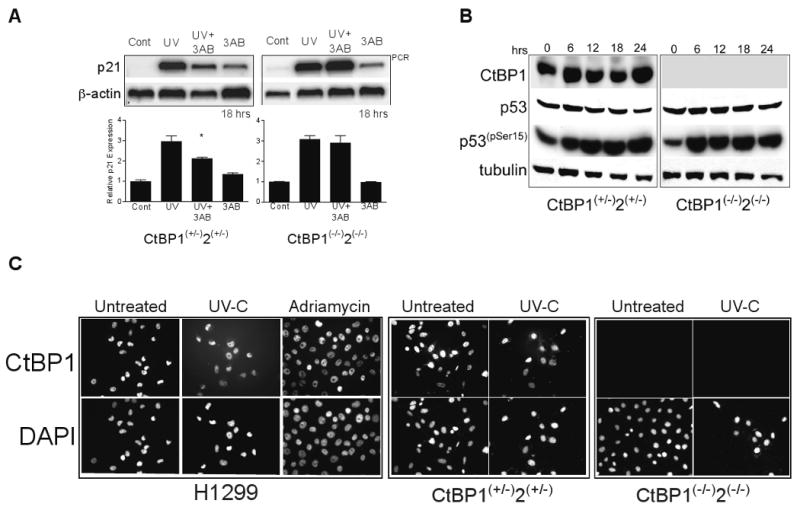
(A) Similar experiment as (1A) using the CtBP heterozygous (CtBP1+/-;2+/-) and homozygous CtBP1+2 null MEFs (CtBP1-/-;2-/-). Cells were either untreated (control), treated with 3AB alone (3AB), UV-C or UV-C following a 1 hour pre-incubation with 3AB (UV-C+3AB), and semi-quantitative PCR (upper) was performed after 18 hours. A representative, quantified triplicate sample experiment is shown below (bars). *= p<0.05 for (n=3) replicate experiments comparing UV to UV+3AB in the heterozygous MEFs; not significant in the CtBP null MEFs.
(B) Western blots for the indicated proteins following a single UV-C (50J/m2) dose and protein harvested at the indicated time points from either CtBP heterozygous (CtBP1+/-;2+/-) or homozygous CtBP1+2 null MEFs (CtBP1-/-;2-/-). Tubulin is shown as a loading control.
(C) Indirect Immunofluorescence for CtBP1 in H1299 and CtBP heterozygous (CtBP1+/-;2+/-) or homozygous null MEFs (CtBP1-/-;2-/-). The indicated cell lines were treated with either UV-C (50J/m2) or adriamycin (0.2μg/mL) and immunostained after 18 hours. Predominately nuclear distribution is maintained following either UV-C or adriamycin compared with the untreated controls. Homozygous null MEFs (CtBP1-/-;2-/-) are negative for CtBP1. DAPI staining identifies nuclei.
Figure 7. Both CtBP and PARP are required for PARP inhibitor attenuation of p21 activation.
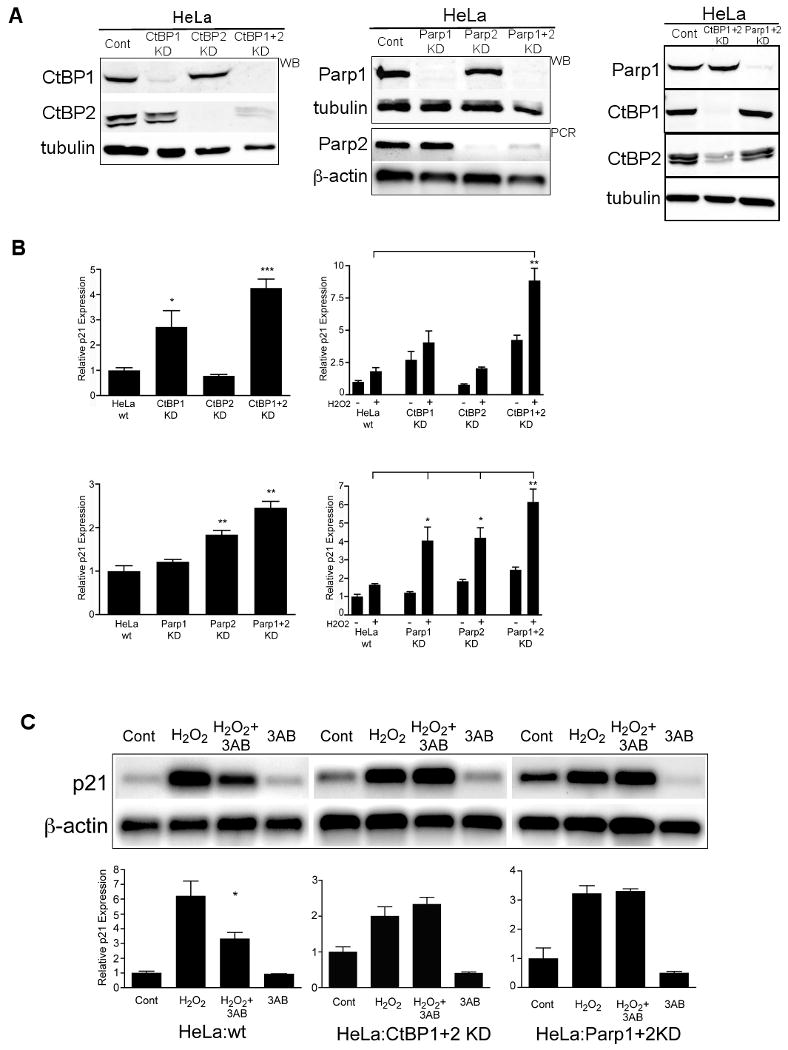
(A) Western blots (WB) or PCR for each of the HeLa (Cont) derived knockdown (KD) cell lines for CtBP (Left panel) or PARP (Middle panel) isoforms. Semi-quantitative PCR for PARP2 is shown. (Right panel) Reciprocal western blots for CtBP1, CtBP2 and PARP1 in either HeLa wild type (Cont) or the CtBP1+2 and PARP1+2 knockdown cell lines. Tubulin (western blot) or β-actin (PCR) are shown as loading controls.
(B) Real time p21 PCR of triplicate parallel cultures relative to β-actin and normalized to the wild type HeLa cells (HeLa:wt). (Top, Left graph) Wild type (wt) or HeLa CtBP knockdown cell lines showing only the basal (untreated, growth phase) p21 expression. * p<0.05, *** p<0.001 relative to HeLa:wt. (Top, right graph) Comparison of both basal (-H2O2) and stimulated (+H2O2) p21 expression in these same cell lines. ** p<0.01 relative to +H2O2 in HeLa wt. Error bars, SEM, (n=6). (Bottom left graph) Same experiment as above using the HeLa PARP knockdown cell lines, basal expression only. ** = p<0.01 relative to the wt control. (Bottom right graph) Comparison of basal and stimulated p21 expression in the PARP:KD cell lines. * = p<0.05, ** = p< 0.01. Error bars, SEM (n= 6).
(C) Semi-quantitative PCR for p21 and β-actin and corresponding quantified triplicate parallel treated cultures (graphs) relative to untreated cells (Cont) similar to the experiment in Figure 7C using wild type HeLa, CtBP1+2 (HeLa:CtBP1+2KD) or PARP1+2 (HeLa:PARP1+2KD) knockdown cell lines. * = p<0.05. Error bars, SEM (n=3).
Figure 3. CtBP is not degraded following UV-C treatment.
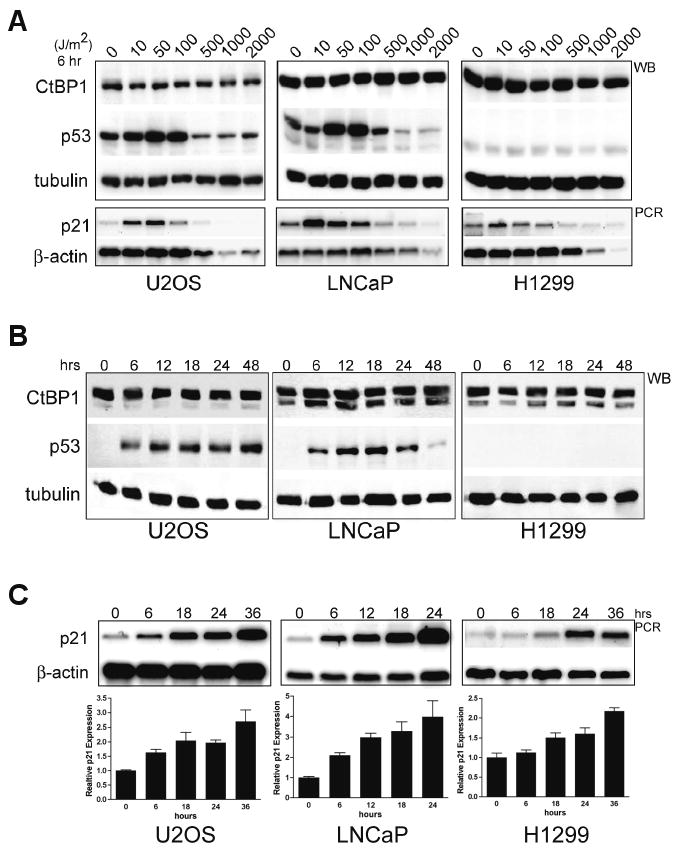
(A) A dose ranging experiment 6 hour post-treatment with the indicated doses of UV-C (0-2000 J/m2) on three different cell lines analyzed by western blot (WB) for CtBP1, p53 and tubulin (upper panels). H1299 cells lack p53, a faint non-specific signal seen is also present in the LNCaP extract. Parallel treated cultures were also analyzed by semi-quantitative PCR for p21 and β-actin (lower panels).
(B) A single dose time course of UV-C (50 J/m2) in three cell lines analyzed for CtBP1, p53 and tubulin by western blot for samples harvested at the indicated times up to 48-hours post treatment.
(C) Time course of UV-C (50 J/m2) p21 activation by semi-quantitative PCR in 3 different cell lines (U2OS, LNCaP, H1299) with β-actin control. A single representative experiment from parallel treated cultures is shown. (Graphs) Triplicate samples for each time point and cell line were treated in parallel, analyzed by sqPCR, quantified and the data expressed relative to control p21 mRNA expression (at time = 0) normalized to β-actin. Error bars represent SEM.
We next asked whether CtBP mechanistically operated in PARP-dependent p21 transcriptional activation, employing MEFs from CtBP1/CtBP2 double knockout embryos (Hildebrand and Soriano, 2002). In contrast to heterozygous CtBP1+/-/2+/- MEFs, PARP inhibition did not attenuate p21 activation in homozygous CtBP1-/-/CtBP2-/- MEFs (Figure 2A). PARP inhibitor attenuation of peroxide (H2O2)-induced p21 activation also depended on CtBP (Figure S2), suggesting a common mechanism among different p21 activation pathways. Relative PARP1 (Figure S3) and CtBP1 (Figure 2B) protein levels remained unchanged in these MEFs while p53 was activated (p53pSer15) following UV-C treatment (Figure 2B). Following UV-C, adriamycin or γ-IR, CtBP1 remains nuclear in CtBP1+/-/2+/- MEFs, U2OS and H1299 cells (Figure 2C, S4). These experiments implicate PARP in p21 activation, and demonstrate that in the absence of CtBP, activation of p21 does not require PARP activity.
One model proposed for regulation of CtBP-dependent co-repression is rapid nuclear export and proteosomal degradation following UV-B exposure (Zhang et al., 2005). CtBP steady-state levels and subcellular localization did not change in our initial experiments in response to UV-C (Figures 1, 2, S4). We performed a dose ranging experiment with UV-C dose equivalents (Takasawa et al., 2005), to determine whether CtBP degradation could account for the loss of repression. This experiment included energy (>500 J/m2) sufficient to induce DNA double strand breaks and decrease steady state β-actin mRNA (Figure 3A, lower panel), and demonstrated appropriate increases in p53 protein and p21 mRNA while CtBP levels remained unchanged after 6 (Figure 3A, upper panel) or 24 hours (Figure S5). An extended time course (50 J/m2; 48 hours) revealed no alteration in CtBP1 levels (Figure 3B) and shows the expected p53-dependent (U2OS, LNCaP) and p53-independent (H1299) p21 activation (Figure 3C). Other DNA damage agents also did not influence CtBP levels (H2O2, adriamycin and γ-IR; Figures 1, 2, 4F, S4) or subcellular localization, with CtBP remaining predominately nuclear 24 hours post-treatment (UV-C, adriamycin, γ-IR and H2O2) in U2OS, LNCaP, HeLa, H1299 and CtBP MEFs (Figures 2C, S4). We conclude that in contrast to reports of rapid UV-B induced CtBP proteosomal degradation (Zhang et al., 2005), steady-state CtBP levels do not change following oxidative-, radiation-, or UV-induced DNA damage and therefore this is not a primary mode of regulation of the CtBP co-repressor in this induction mechanism.
Figure 4. p53-idependent activation and PARP inhibitor attenuation of p21 transcription is directed to proximal promoter elements.
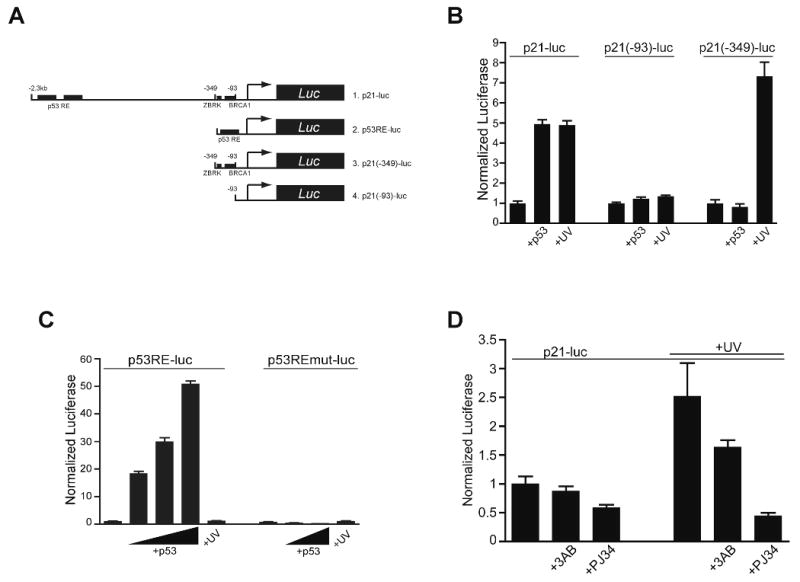
(A) Schematic of the luciferase constructs used. The full length promoter includes the distal p53 response elements (RE). For simplicity, only the proximal regions thought to be important for BRCA1 and ZBRK1 interaction are shown.
(B) H1299 cells were transfected with the full-length p21 promoter luciferase construct (p21-luc), or either of two proximal promoter constructs (p21(-93)-luc, p21(-349)-luc) then after 18 hours either co-transfected with p53 (+p53) or treated with UV-C (+UV) and analyzed 24 hours later. Triplicate, parallel samples from a single representative experiment are shown for this and the following experiments.
(C) H1299 cells were transfected with p53RE control (p53RE-luc) or a mutant p53RE (p53REmut-luc) luciferase construct and either co-transfected with p53 or transfected or exposed to UV-C and analyzed as described as in (B) after 24 hours (n=3; error bars, SEM).
(D) The full-length p21 promoter luciferase construct was transfected into H1299 cells and after 18 hours the cells treated with PARP inhibitors (2.5mM 3AB or 75 μM PJ34) either without UV-C (left bars) or as a 1 hour pre-incubation before UV-C treatment (+UV; right; n=3; error bars, SEM).
CtBP acts as a co-repressor for p53-independent and dependent p21 activation at the proximal promoter
We found UV-C activated p21 in both p53-sufficient (U2OS, LNCaP) and p53-deficient cells (H1299) (Figure 3C). We next asked whether PARP and CtBP cooperate in restraint of activation in both p53-dependent (el-Deiry et al., 1993) and p53-independent (Ocker and Schneider-Stock, 2007) mechanisms.
Previous studies have indicated that p53-independent activation of p21 in response to UV is mediated through promoter proximal elements (Haapajarvi, et al., 1999). Both transient expression of a p53 expression plasmid and UV-C treatment activated a full-length (2.3 kb) p21 promoter reporter in p53-deficient H1299 cells (Figure 4B, p21-luc), whereas a truncated construct lacking distal p53 sites (-349 to +1; p21(-349)-luc) responded to only UV-C and not p53. A minimal construct (-93 to +1; p21(-93)-luc;) did not respond to either UV-C or transfected p53. The specificity of the p53 response is shown by activation of a multimerized p53 response element (RE) promoter-reporter by co-transfected p53, but not by UV-C (Figure 4C). These results identify the region between -93 and -349 in the p21 promoter 5′ flanking region as important for p53-independent p21 activation in response to UV-C, consistent with previous studies in p53-deficient MEFs (Haapajarvi, et al., 1999). PARP inhibition reduced p53-independent UV-C activation of the transfected p21 promoter-reporter by ∼30-75% (Figure 4D), similar to the endogenous p21 promoter in a native chromatin context (Figure 1), whereas basal expression was not significantly affected (Figure 4D, left bars).
We next examined CtBP-dependent co-repression at the p21 promoter. Co-transfection of both CtBP1 and -2 modestly but significantly reduced both p53-independent (Figure 5A, left) and p53–dependent (Figure 5A, middle) activation as well as basal expression (Figure 5B) from the full-length p21 promoter-reporter by ∼25%. Expression of CtBP with a mutation that abrogates PxDLS binding (CtBP1-A52D) (Nardini et al., 2003) but retains ability to act as a repressor as a GAL4 fusion (Figure S6), failed to repress p21 promoter activation. The CtBP1-A52D protein modestly enhanced activation by UV-C (Figure 5A), suggesting a dominant-negative activity (described below). Neither CtBP1 nor CtBP2 reduced activation from the p53RE-luc reporter by p53 (Figure 5A, right). Taken together, these data suggest CtBP functions as a co-repressor for a promoter proximal factor that blocks both p53-dependent and -independent pathways of p21 promoter activation, and that PARP activity leads to derepression through this region.
Figure 5. CtBP co-repressor affects both p53-dependent and independent p21 activation.
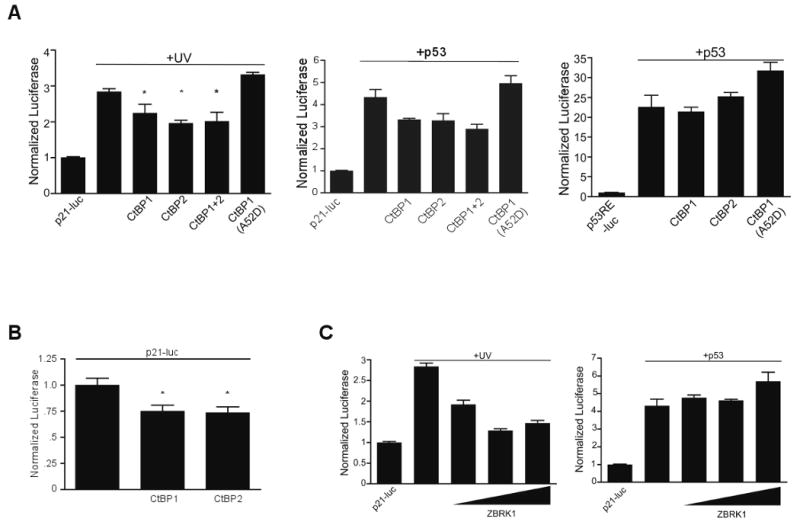
(A) H1299 cells were co-transfected with the full-length p21 promoter luciferase (left, middle graph) or p53RE-luciferase construct (right graph) and either CtBP1, CtBP2, CtBP1+CtBP2 or CtBP1(A52D). (Left) Transfected cells were treated with UV-C (+UV, left) or co-transfection with p53 (+p53; Middle and right) and analyzed after 24 hours as in Figure 4. Error bars, SEM (n=3), For the UV experiment, *p < 0.03 for each of the CtBP co-transfected conditions. For the +p53 (middle graph) experiment p< 0.05 for CtBP1, CtBP1+2 condition, p = 0.09 for CtBP2, p= 0.2 for CtBP1(A52D). Note the difference in scale for the p53RE-luc experiment (Right) owing to the ∼6 fold greater stimulation of p53 on the RE alone versus the full promoter (Middle).
(B) H1299 cells were transfected with full-length p21-luciferase and co-transfected with either CtBP1 or CtBP2 and analyzed after 24 hours. A ∼25% decrease in read-through promoter activation is seen (* = p < 0.05). In this experiment higher amounts of the p21-luciferase reporter were utilized required in this experiment than in A and C to provide increased levels of transcriptional activation. For comparison, the RLU (Relative Light Unit) for the control p21-luciferase construct alone in Figure 5A+C is <10,000 units, while in this experiment it is >30,000 units.
(C) The full-length p21 luciferase reporter was co-transfected with increasing amounts of ZBRK1 cDNA and after 18 hours the cells either treated with UV-C (+UV, left) or co-transfected with p53 (+p53, right). Error bars, SEM (n=3). p<0.005 for each UV+ZBRK1 condition compared with UV alone and non-significant for each p53+ZBRK condition.
Previous studies have additionally mapped a BRCA1-regulated element to this proximal region of the p21 promoter (Somasundaram et al., 1997), and suggest that CtBP may repress BRCA1-dependent transactivation of the p21 promoter in a co-repressor complex including the BRCA1-interacting protein CtIP (Li et al., 1999). ZBRK1, a zinc-finger KRAB domain repressor DNA binding protein (Zheng et al., 2000) likely directs this complex to this region. ZBRK1 contains a C-terminal BRCA1-dependent binding and repression domain (Tan et al., 2004) and has a putative DNA binding site at -322 to -318 (Lee et al., 2007). Over-expressed ZBRK1 significantly repressed p53-independent, but not p53-dependent, activation of a p21 promoter reporter (Figure 5C). Collectively these experiments demonstrate p53-independent p21 activation is repressed by elements in the proximal promoter, through CtBP, and is reversed by PARP activity. ZBRK1 repression of p53-independent p21 activation provides a potential candidate for a DNA binding protein upon which CtBP might be recruited.
CtBP1 and PARP1/2 functionally interact to control p21 transcription
PARP inhibitor attenuation of p21 activation in response to UV-C (Figure 1) and H2O2 (Figure S2) was abrogated in CtBP1-/-/CtBP2-/- MEFs. Therefore, we asked whether CtBP reintroduction into these cells was sufficient to restore p21 repression. Wild type or mutant CtBP isoforms were re-expressed in CtBP1-/-/CtBP2-/- MEFs via lentiviral transduction. Lentiviral expressed CtBP1 and 2 were predominately nuclear (Figure 6A), similar to endogenous CtBP1 (Figure 2C) and in partial contrast to transfected CtBP1 (Figure S7; Verger et al., 2006). Lentiviral expressed CtBP levels were similar to those measured endogenously (Figure S8).
Figure 6. CtBP is required for p21 basal repression and occupies the proximal promoter, and is dismissed by PARP activation.
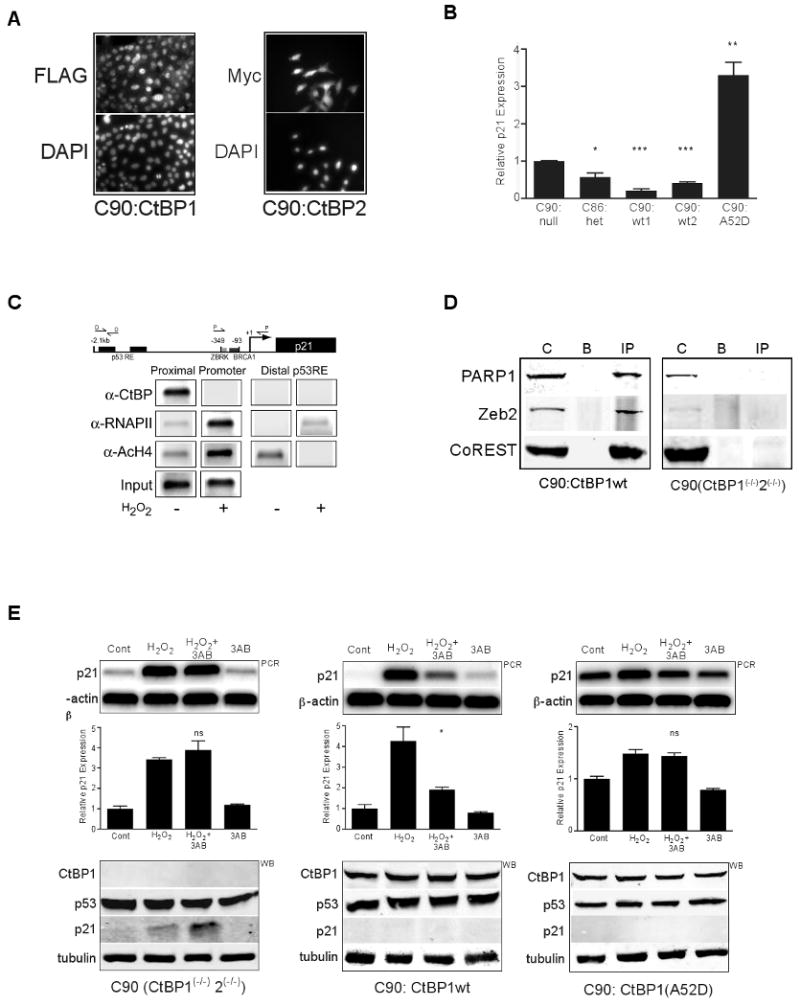
(A) Immunofluorescence in the indicated CtBP reconstituted CtBP1(-/-)2(-/-) MEF cell lines. C90:CtBP1 and C90:CtBP2 cells were immunostained with anti-FLAG (detecting CtBP1) or anti-my (detecting CtBP2) demonstrating a predominately nuclear re-expressed CtBP1 or CtBP2. DAPI staining identifies nuclei.
(B) Real time p21 and β-actin PCR of triplicate samples for the indicated cell lines; C90:null = CtBP1+2 null MEFs (CtBP1(-/-)2(-/-)); C86:het = CtBP1(+/-)2(+/-); C90:wt1, C90:wt2, C90:A52D = CtBP null (CtBP1(-/-)2(-/-)) MEFs expressing either wtCtBP1, wtCtBP2, or CtBP1(A52D). CtBP protein levels were equivalent. A single, representative experiment from triplicate samples is shown with p21 expression normalized to β-actin and graphed relative to the normalized data in the C90:null cells. Error bars SEM, n= 3. * = p<0.05, ** = p<0.01, *** = p<0.001.
(C) ChIP analysis in LNCaP cells using primer sets at the distal p53RE or proximal p21 promoter region (schematic). Pooled cells treated in the absence (-) or presence (+) of H2O2 were treated as in the Methods, an Input aliquot removed and ChIP performed using the indicated antibodies followed by PCR for either the distal or proximal region. Shown are results from a single experiment on parallel treated samples. Antibodies used at left: RNAPII = RNA polymerase II, AcH4 = acetyl K9 Histone H4. Input = entire treated or untreated pooled samples prior to splitting for the immunoprecipitation step.
(D) Immunoprecipitation for CtBP in the CtBP1+2 null MEFs (CtBP1(-/-)2(-/-)) and CtBP null MEFS re-expressing wtCtBP1 (C90:CtBP1) with Western blot detection for the proteins indicated at left. C = input control lysate, B = beads alone/no primary antibody, IP = immunoprecipitate with anti-CtBP.
(E) (Top panel) semi-quantitative PCR for p21 or β-actin in untreated (Cont), H2O2, H2O2+3AB or 3AB treated CtBP1+2 null MEFs (CtBP1(-/-)2(-/-)), CtBP null MEFS re-expressing either wtCtBP1 (C90:CtBP1) or CtBP1(A52D) (C90:CtBP1(A52D)). (Middle graphs) Quantified triplicate, parallel treated semi-quantitative PCR samples for each condition. Error bars SEM (n=3), ** p<0.01, ns = not significant p>0.05. (Bottom panels) Western blots (WB) for proteins indicated (left) with a tubulin loading control.
CtBP1-/-/CtBP2-/- MEFs had significantly higher level of basal p21 mRNA than the heterozygous CtBP1+/-/CtBP2+/- MEFs (Figures 6B, S2). CtBP1 or CtBP2 reconstituted MEFs significantly reduced basal p21 expression to levels below that observed in CtBP1-/-/CtBP2-/- MEFs (Figure 6B). Interestingly, CtBP deficient MEFs reconstituted with CtBP1-A52D had a significantly increased basal p21 mRNA level, possibly through a dominant negative effect of titrating away other co-repressor proteins, similar to results from transient repression assays (Figure 5A). Chromatin immunoprecipitation analysis demonstrated the association of CtBP with the proximal p21 promoter, but not the distal p53-responsive elements (Figure 6C). Following p21 activation by H2O2, CtBP was dismissed with increases in acetylated Histone H4 and RNA polymerase II recruitment, consistent with activated transcription. Because PARP activity and CtBP co-repressor function appeared interdependent, we asked whether CtBP and PARP might co-exist in a complex. Immunoprecipitation of CtBP1 (Figure 6D) from nuclear extracts of CtBP1 reconstituted CtBP1-/-/CtBP2-/- MEFs (C90:CtBP1wt) recovered a complex including PARP1 and as well as two known CtBP binding partners, ZEB2 and CoREST (Shi et al., 2003). Finally, CtBP1 but not CtBP1-A52D reconstituted MEFs restored PARP inhibitor attenuation of p21 activation as compared with CtBP1-/-/CtBP2-/- MEFs (Figure 6E). Relatively higher basal p21 expression in CtBP1-A52D cells (Figures 6B, 6E) reduced the magnitude of the H2O2-stimulated induction.
We performed the reciprocal experiment and also asked whether the presence of PARP protein was required for p21 basal repression. We determined the relative contribution of PARP1 and PARP2 to activation by constructing PARP or CtBP RNAi knockdown cell lines via lentiviral transduction of small-hairpin RNA expression vectors. In HeLa cells we achieved nearly 99% knockdown of CtBP1 and/or 2 and PARP1 protein (Figure 7A). CtBP1 and -2 knockdown did not alter the expression of PARP1, nor did the PARP1/PARP2 knockdown affect CtBP1 or 2 expression (Figure 7A, right).
Knockdown of CtBP1 but not CtBP2 released steady-state repression, whereas the CtBP1 and -2 double knockdown resulted in larger increases in basal p21 mRNA (4-fold; Figure 7B, top left). Interestingly, PARP1 and PARP2 knockdown also increased basal p21 mRNA levels (Figure 7B, bottom left). Following activation, p21 increased by the same relative degree (2 to 3-fold) for both CtBP and PARP knockdown lines (Figure 7B, right panels). The absolute p21 activation in CtBP1/CtBP2 double knockdown cell line was significantly greater than wild type HeLa cells (Figure 7B, top right). A similar additive effect was found in the PARP1/PARP2 double knockdown cell lines (Figure 7B, bottom) while p21 activation was significantly enhanced in each PARP knockdown cell line compared to wild type cells. Both the CtBP1/CtBP2 knockdown and PARP1/PARP2 knockdown cell lines were insensitive to PARP inhibitor attenuation of p21 activation (Figure 7C), similar to what we observed for CtBP1-/-/CtBP2-/- MEFs (Figure 2A). From these experiments we conclude that PARP1 and PARP2 together are necessary for PARP-dependent activation of the p21 promoter and that PARP may comprise a repression complex with CtBP at the p21 promoter under basal conditions.
Discussion
In this study we demonstrate that repression of basal p21waf1/cip1 transcription requires both CtBP and PARP proteins, and that activation of PARP enzymatic activity is necessary for activation, by relief of repression, for both p53-dependent and -independent pathways. In this model, a CtBP-dependent repression complex exerts a dominant inhibitory influence over p21 transcription and must be dismissed by PARP activation before other promoter-directed activators may influence transcription (Figure 8).
Figure 8. Model of CtBP and PARP effects on p21 repression and activation.

Activation of PARP activity by oxidative injury or UV damage leads to dismissal of the CtBP co-repressor complex and permits recruitment of a co-activator complex. In the absence of CtBP, DNA-damage activates p21 irrespective of PARP activity, but in the presence of CtBP, PARP activity is necessary for removal of the co-repressor complex.
How does the co-repressor CtBP specifically regulate transcription of the p21 gene? Previous studies implicated the CtBP-interacting Protein (CtIP) in regulating BRCA1-dependent trans-activation of the p21 promoter (Li et al., 1999). In this model, phosphorylation of BRCA1 in response to DNA damaging agents disrupts binding of a repressive CtIP/CtBP complex. In a similar model, a BRCA1/CtBP/CtIP co-repressor complex regulates the angiopoietin-1 promoter through recruitment by ZBRK1 (Furuta et al., 2006). Our data indicate DNA damaging treatments induce p21 via a p53-independent, PARP-sensitive control element that resides within the first 350 nucleotides of the p21 promoter, corresponding to a proposed ZBRK1 binding site at -322 to -318 (Figures 4, 5; Lee et al., 2007). This region also harbors a HDAC sensitive region (Wilson et al., 2008; Mottet et al., 2009), and previous studies have demonstrated that BRCA1 trans-activates the p21 promoter through elements located within the proximal promoter region (Somasundaram et al., 1997). We found that ZBRK1 acted as a repressor of p21 transcription (Figure 5C), and that CtBP repressed p21 promoter activity through an overlapping region (Figure 5A). Collectively, these data suggest a hypothesis that CtBP may be recruited to the p21 promoter via ZBRK1, possibly indirectly through the BRCA1/CtIP complex.
Recent studies have defined a role for PARP in gene-specific regulation, in both activation and repression mechanisms (reviewed by Kraus, 2008). Our data suggest that PARP serves a dual role at the p21 promoter, as an intrinsic component of a repressor complex under basal conditions, with poly(ADP-ribosyl)ation enzymatic activity necessary for transcriptional activation. PARP knockdown increases basal p21 expression (Figures 6B), an effect also noted in PARP1 deficient ES cells (Ogino et al., 2007), consistent with loss of a repressor function for this promoter. Inhibition of enzymatic activity precludes robust activation but does not detectably alter basal p21 transcription.
PARP enzymatic activity and the co-regulatory role of PARP at a promoter may have variable functions, depending on the gene-specific context. For example, the presence of PARP1 is associated with AP-2α expression while its enzymatic activity contributed to repressing transcription (Li et al., 2004). At the MASH1 promoter, occupancy by PARP1 as a component of the Gro/TLE1 co-repressor complex is associated with repression, but upon enzymatic activation turns on transcription by promoting an exchange for co-activators (Ju et al., 2004). In contrast, retinoic acid-dependent transcription requires PARP as a ligand-dependent co-activator independent of enzymatic activity (Pavri et al., 2005). In another variation, both PARP inhibitors and PARP1 knockdown promoted bcl6 gene expression in parallel (Ambrose et al., 2007), while both pharmacologic inhibition and knockdown inhibited the CXCL1 promoter (Amiri et al., 2006).
Although our data suggest PARP1 may be the predominant form interacting with CtBP biochemically, these data also suggest that PARP2 may be involved. We find reducing PARP2 has a significant effect alone in increasing p21 and has an additive effect on both basal and stimulated transcription in conjunction with knockdown of PARP1 (Figure 7B). PARP1 and PARP2 form dimers in vitro (Schreiber et al., 2002) and may account for functional interaction between these different PARP forms at this promoter.
Both PARP and the poly(ADP-ribosyl)ation enzymatic activity of PARP have been proposed to determine a co-regulatory protein exchange mechanism at specific promoters in response to pathways not typically associated with PARP1 activation. The Gro/TLE co-repressor maintains repression of the MASH1 promoter and has been biochemically demonstrated to include PARP1 (Ju et al., 2004). At this promoter, knockdown of PARP1 leads to derepression of transcription suggesting an intrinsic repressor function. In a manner similar to regulation of CtBP-dependent co-repression of the p21 promoter, CaMKII-dependent transcriptional activation requires PARP enzymatic activity, possibly leading to poly(ADP-ribosyl)ation and dismissal of components of the co-repressor complex (Ju et al., 2004). PARP1 has also been shown to be necessary for retinoic acid-dependent activation of transcription (Pavri et al., 2005) by converting a resident inactive Mediator to an active state, however in this role, PARP1 enzymatic activity is dispensable. In both these complexes, PARP serves a regulatory role in switching a repressive complex to an activator.
How might PARP and CtBP functionally interact? CtBP has been proposed to require NAD for co-repressor activity (Zhang et al., 2002; Nardini et al., 2003), raising the intriguing possibility that PARP and CtBP may interact through this metabolic co-enzyme. A similar functional interdependence has been proposed between PARP and SIRT1 (Kolthur-Seetharam et al., 2006), with depletion of NAD through activation of each altering the function of the other. PARP-dependent depletion of NAD could alter either a proposed intrinsic dehydrogenase activity (Nardini et al., 2003), or alternatively NAD dependent dimerization (Balasubramanian et al., 2003) leading to disruption of CtBP co-repressor complex formation.
CtBP may also serve to regulate PARP activity through alteration of the relative ratio of NAD:NADH, although a catalytic function (or substrate) for CtBP as a dehydrogenase has not yet been described. Alternatively PARP may alter CtBP-dependent repression by ADP-ribosylation of proteins within the CtBP co-repressor complex. Poly(ADP)ribose acceptor sites in PARP1 are specific glutamate, aspartate (Tao et al., 2009) or lysine (Altmeyer et al., 2009) residues and CtBP has a glutamate (E295) at its proposed dehydrogenase site (Kumar et al., 2002; Nardini et al., 2003). We attempted to identify poly(ADP-ribosyl)ation of CtBP by a sequential immunoprecipitation-western approach but did not detect modification (not shown). We do not see a shift in the size of CtBP with activation as might be expected for poly(ADP-ribosyl)ation (Figures 1-3), however the amount of PARP in association with CtBP may be small, and the extent of modification may be limited.
Collectively our data support a model (Figure 8) where p21 activation following a DNA damage stimulus requires sequential activation of PARP1/2 followed by CtBP1 dismissal, converting the repression complex to allow for recruitment of transcriptional activators. In this model PARP may constitute a transcription switch, linked to CtBP via NAD as a common cofactor.
Materials and Methods
Cell Culture
Cell lines were passage within 24 hours prior to experiments. U2OS, H1299, HeLa, MCF, CtBP null (C90) and heterozygote (C86) MEFs (Dr J. Hildebrand, Unit Pitt) and all lentiviral cell lines were grown with 10% Fetal Calf Serum (FCS) in Dulbecco's Modified Eagle's Medium (DMEM; Invitrogen, Carlsbad, CA USA) with selection antibiotics when necessary. LNCaP cells were grown in 10% FCS/RPMI.
Lentiviral Expression and siRNA Vectors, Lentiviral Stable Cell Lines
Lentiviral transfected cell lines were created using a modified vector system (Invitrogen). Viral production was according to standard techniques in HEK293T cells.
Stable human wild type or mutant CtBP re-expression cell lines were constructed from CtBP1-/-/CtBP2-/- MEFs using lentiviruses containing the Tet-ON promoter (5′-CCCTATCAGTGATAGA-3′) (Moyed et al., 1983), dominant selection markers and either FLAG-CtBP1 or myc-CtBP2 cloned into the lentiviral expression vectors. Both clonal and pooled cell lines had similar transgene protein expression.
Stable shRNA knockdown cell lines were constructed using lentiviruses harboring the human H1 promoter, a shRNA (n19), loop and (T6) terminator sequence. Multiple sequences and cell lines were screened for each; the shRNA used for the data presented are CtBP1: 5′-CGACTTCACCGTCAAGCAG, CtBP2: 5′-ATCCACGAGAAGGTTCTAA, PARP1 5′-GCCTCCGCTCCTGAACAAT (Kameoka et al., 2004), PARP2 5′-TGGGAGTACAGTGCCATTA. Knockdown was evaluated by western blot for protein (CtBP1, CtBP2, and PARP1) or for mRNA by RT-PCR (PARP2; primers: Forward 5′-TTAGAAGATGATGCCCAGAGGAAC, Reverse 5′-GCCTTGATTTGTGCCACTGTCAG).
UV-C, γ-IR and Drug Treatment
3-Aminobenzamide (3-AB; 2.5-5 mom) and PJ34 (25-75 μM) (EMD Biosciences, Gibbstown, NJ USA), adriamycin (0.2 μg/ml; Sigma, St Louis, MO USA) and hydrogen peroxide (250 μM) were diluted in growth media directly before use. PARP inhibitors were added one hour before further treatments and left in the media for the indicated experiment length. For UV treatment, the media was removed, cells exposed to UV-C energy (J/m2) in a Stratalinker (Stratagene, LaJolla, CA USA) and then returned. γ-IR treatment (10Gy) was carried out using a cesium [137Cs] source.
Immunofluorescence
Cells were fixed in 4% paraformaldehyde, permeabilized in 0.1%Triton-X100 and immunostained (3%NGS:PBS) with antibodies for CtBP1 (C1, Santa Cruz Biotechnology, Santa Cruz, CA USA), FLAG (M2) and c-myc (9E10) (Sigma, St Louis, MO USA) and fluorescent secondary antibodies (Invitrogen), followed by DAPI. For poly(ADP)-ribose (PAR-10H, Alexis Biocehmicals; Plymouth Meeting, PA USA) cells were fixed in 1:1 cold acetone:methanol and immunostaining performed.
Western analysis and antibodies
For whole cell extract preparation, cells were harvested in cold lysis buffer (50 mom HEPES pH7.4, 250 mM NaCl, 10 mM NaF, 0.2 mM EDTA, 0.5% NP-40 plus protease inhibitors (Sigma)), cellular debris pelleted and supernatant used for western blots. For immunoprecipitation, cells were harvested into lysis buffer (50 mom HEPES (pH 7.5) 10 mM KCl, 0.2 mM EDTA, 0.5% NP-40, 1 mM DTT, 250mM NaCl plus protease inhibitors), the supernatant cleared, brought to 150 mom NaCl, incubated with primary antibodies (anti-FLAG), then Protein-A Sepharose (Sigma), washed extensively and western blots performed. Antibodies: anti-tubulin (b-5-1-2, Sigma), FLAG (M2, Sigma), p53 (Bp53-12 or FL-393; Santa Cruz), p21 (F-5; Santa Cruz), phospho-p53(Ser15) (Cell Signaling; Danvers, MA USA), CtBP1 (C-1, E12 or H-440; Santa Cruz), CtBP2 (BD Biosciences; San Jose, CA USA), PARP-1 (C2-10; BD Ptarmigan), Zeb2 (H-102, Santa Cruz), CoREST (BD Biosciences). Secondary antibodies were conjugated with chromophores or horseradish peroxidase (Invitrogen).
Quantitative Real-time PCR and Semi-quantitative PCR
RNA was isolated from cultured cells by Trizol (Invitrogen), chloroform extracted and isopropanol precipitated. Equal amounts of RNA were used for cDNA synthesis (Promega, Madison, WI USA) and standardized spur (semi-quantitative) reactions analyzed on ethidium stained agarose gel electrophoresis and quantified by densitometry (Imager-FX, Bio-Rad). Primers: human p21 (forward: 5′-ATGTCAGAACCGGCTGGGGATGTC, reverse 5′-GGGCTTCCTCTTGGAGAAGATC), mouse p21 (forward: 5′-CCAATCCTGGTGATGTCCG, reverse: 5′-CGCTTGGAGTGATAGAAATCTG) and mouse and human β-actin (forward: 5′-GATGGAGCCGCCGATCCACACGG, reverse 5′-CTACGTCGCCCTGGACTTCGAGC). Conditions that provided a signal within the linear range of detection were used for each primer set.
Real time (rt) PCR (Taq-Man, Applied Biosystems; Foster City, CA USA) was performed with p21 and β-actin probes per manufacturers instructions. The reaction products were analyzed by calculating the relative, normalized target gene expression in the low exponential range (Pfaffl, 2001). Each experiment with separately treated, triplicate samples was performed at least twice, graphed as a SEM, relative to control samples. Statistical analyses utilized two-tailed t-test, 95% confidence interval.
Chromatin Immunoprecipitation
In brief, pooled, treated cells were cross-linked with formaldehyde, lyses, sonicated and cleared, input samples removed for analysis and the cell lysates incubated overnight at 4°C with the indicated antibodies. Salmon sperm treated protein-A agarose beads were added for 1 hour followed by low and high salt buffer washes according to the manufacturer's protocols (Millipore; Billerica, MA USA). Chromatin was eluted (1% SDS/50 mom NaHCO3/250 mM NaCl/20 μg/ml proteinase K), the cross-links reversed (65°C, 12 hours) and the DNA products phenol:chloroform extracted and ethanol precipitated. PCR at the p21 promoter was performed for a fragment encompassing 279 base pair region overlapping the TATA box (forward: GTGCTGTGTCCTCCTGGAGAGTGCCAACTCATTCTCC reverse: CGACCCGCGCTCGGCCCACCGCGCCG), and 318 nucleotides overlapping the primary p53 response element (forward: CCATGCTGCTCCACCGCACTCTGG, reverse: CCTGTCGCAAGGATCCTGCTGG). Antibodies: CtBP1 (C-1, Santa Cruz), RNA polymerase II (N-20, Santa Cruz), acetyl-Histone H4 (Millipore).
Plasmid Construction, Transfections and P21 reporter luciferase assays
Human CtBP1 and 2 constructs were PCR tagged in pcDNA3 with either a 2XFLAG or human c-my epitopes. Point mutations were created by oligonucleotide mutagenesis. ZBRK1 (ATCC; Manassas, VA USA) was PCR inserted into 2XFLAG/pcDNA3. A full-length (2.3 kb 5′ flanking DNA) p21 promoter-luciferase reporter and deletions were constructed by PCR in pGL3-luciferase (luc) (Protégé). The p53-response element (RE) luciferase construct was created by direct tandem oligonucleotide ligation of either wild type or mutant p53RE (Kern et al., 1992) upstream of a minimal TATA sequence. Transfections for immunofluorescence and luciferase assays used Trans-IT (Panvera; Madison, WI USA). For luciferase assays: Reporter constructs were co-transfected with a Renilla-luciferase control vector (Protégé; 10 ng) and pcDNA3 to equalize the DNA amount using. For drug experiments, 18 hours following transfection fresh media containing PARP inhibitors was added and cells harvested after 18 hours. For UV experiments, 18 hours following transfection, cells were either pre-incubated for one hour with PARP inhibitors or in media alone and UV-C (50J/m2) exposed. Luciferase assays were performed on triplicate samples. Data are plotted using a single average ratio of three Firefly:Renilla ratios.
Supplementary Material
S1. PAR accumulates following UV-C or H2O2.
Either H2O2 (250 μM) or UV-C (UV; 50 J/m2) induced PAR after 1 hour in LNCaP cells as measured by immunofluorescence. H2O2 resulted in >97% cells PAR+. Pre-incubation with either 3AB or PJ34 prior to UV-C reduces PAR+ accumulation in a dose dependent manner. Graph is %PAR+ cells of the total DAPI+ cells counted in >10 fields.
S2. H2O2 as a p21 activator demonstrates CtBP dependent, PARP inhibitor attenuation.
Semi-quantitative PCR for p21 or β-actin control in H2O2 treated CtBP heterozygous (CtBP1+/-;2+/-) and homozygous CtBP1+2 null MEFs (CtBP1-/-;2-/-), with or without the PARP inhibitors 3AB and PJ34 or PARP inhibitors alone. Similar to the results in Figure 1, pre-incubation (1hr) with PARP inhibitors prior to the H2O2 stimulus resulted in attenuation of p21 gene expression in the presence of CtBP in the CtBP1(+/-)2(+/-) MEFs, but not in the absence of CtBP in CtBP1(+/-)2(+/-) MEFs.
S3. PARP1 levels in CtBP MEFs.
Western blot for PARP1 in CtBP 1+2 heterozygous (+/-) or null (-/-) MEFs in control (0 hrs) or 6 hours post treatment with UV-C.
S4. CtBP remains nuclear and its levels do not change following γ-IR treatment.
Indirect immunofluorescence for CtBP1 in the 3 indicated cell lines demonstrating that 24 hours after a 10Gy dose of γ-IR that CtBP is predominately nuclear, similar to the results in Figure 1E for UV-C and adriamycin. TOPRO (Invitrogen) used per manufacturers instructions is shown as a nuclear indicator.
(Right) Western blot for CtBP1, p53 or tubulin (loading control) in parallel cultured H1299 cells treated with either adriamycin (Ad) or γ-IR (IR) and analyzed after 24 hours demonstrating that the absolute levels of CtBP do not change with these treatments, similar to results seen in Figure 1 and 2.
S5. Varying doses of UV-C do not change CtBP levels.
A dose ranging experiment 24 hours post-treatment with different doses of UV-C (0-2000 J/m2) on three different cell lines analyzed by western blot (WB) for CtBP1, p53 and tubulin. This experiment was performed plated, treated and analyzed in parallel with the 6 hour experiment in Figure 2B. No significant difference in CtBP protein is seen.
S6. CtBP1-A52D abrogates PxDLS binding but retains repression activity as a GAL4 DNA binding domain fusion.
(A) Mammalian 2-hybrid assay for the CtBP-E1A interaction. A minimal TATA-luciferase promoter containing 4 repeats of a GAL4 binding DNA binding site (75ng) was co-transfected into U2OS cells with a Renilla luciferase control vector (10ng) and a construct expressing the fusion protein GAL4-E1A either alone or with constructs expressing VP16-CtBP1 fusion proteins (200ng) and luciferase activity measured after 24 hours. The data were normalized to Renilla luciferase activity and set relative to the control. A single triplicate, representative experiment is shown. Wild type CtBP1 is able to bind to the E1A protein containing a PxDLS motif, reconstituting a strong transcriptional activator, whereas CtBP1-A52D does not. Error bars represent SEM (n=3). Protein levels of expressed CtBP proteins were equivalent by Western blot (not shown).
(B) A thymidine kinase (TK) luciferase reporter construct containing 4 repeats of a GAL4 DNA binding domain (75ng) was co-transfected with a Renilla luciferase control and either wild type CtBP1 or CtBP1-A52D into U2OS cells, the activity measured and data graphed as in (A). A single, parallel triplicate experiment is shown. Both wild type CtBP1 and CtBP1-A52D GAL4 fusion proteins are able to repress the TK promoter indicating CtBP1-A52D retains the ability to bind to other (co)-repressive elements necessary for this activity, similar to wild-type CtBP1. Error bars SEM (n=3).
S7. Indirect immunofluorescence for endogenous or transfected CtBP1 or CtBP2 in H1299 cells.
(A) Immunofluorescence for endogenous CtBP1 and either transfected CtBP 1 or 2 in H1299 cells. H1299 cells were either immunostained with anti-CtBP1 (Untransfected) or transfected with FLAG-CtBP1 (CtBP1) or FLAG-CtBP2 (CtBP2) and immunostained with anti-FLAG after 24 hours. DAPI is shown as a nuclear counterstain.
S8. CtBP1 levels in the C90:CtBP1 cells are similar to endogenous CtBP1.
Western blot for CtBP1 in U2OS (U2), CtBP1+2 null MEFs (CtBP1-/-;2-/-; C90) and the CtBP1 reconstituted CtBP1+2 null MEF cell line (C90:CtBP1). Near equivalent levels of CtBP1 are seen in the C90:CtBP1 cell line as the endogenous levels in U2OS. The CtBP1 protein in C90:CtBP1 cells runs slightly higher because it contains a 2xFLAG epitope. Tubulin is shown as a loading control.
Acknowledgments
This work as supported by grants (NIDDK R01DK060133) to JRL and DLM (NCI K08CA109158). We thank J Hildebrand (University of Pittsburgh) for the CtBP MEFs, R Klein (OHSU) for access to and assistance with rtPCR, R Kwok (University of Michigan) for the p53 expression construct and Madeleine Pham and Loren Brown for technical assistance.
Grant support: NCI K08CA109158 (DLM), NIDDK R01DK060133 (JRL)
Footnotes
Conflict of Interest: The authors have nothing to disclose and no competing financial interests with the work herein.
Supplemental Information: Supplemental data as referenced in the text is available through the journals home page: http://www.nature.com/onc/index.html.
References
- Altmeyer M, Messner S, Hassa PO, Fey M, Hottiger MO. Molecular mechanism of poly(ADP-ribosyl)ation by PARP1 and identification of lysine residues as ADP-ribose acceptor sites. Nucl Acids Res. 2009;37:3723–3738. doi: 10.1093/nar/gkp229. [DOI] [PMC free article] [PubMed] [Google Scholar]
- Ambrose HE, Papadopoulou V, Beswick RW, Wagner SD. Poly-(ADP-ribose) polymerase-1 (PARP1) binds in a sequence specific manner at the bcl6 locus and contributes to the regulation of bcl6 transcription. Oncogene. 2007;26:6244–6252. doi: 10.1038/sj.onc.1210434. [DOI] [PubMed] [Google Scholar]
- Amiri KI, Ha HC, Smulson ME, Richmond A. Differential regulation of CXC ligand 1 transcription in melanoma cell lines by poly(ADP-ribose) polymerase-1. Oncogene. 2006;25:7714–7722. doi: 10.1038/sj.onc.1209751. [DOI] [PMC free article] [PubMed] [Google Scholar]
- Balasubramanian P, Zhao LJ, Chinnadurai G. Nicotinamide adenine dinucleotide stimulates oligomerization, interaction with adenovirus E1A and an intrinsic dehydrogenase activity of CtBP. FEBS Lett. 2003;537:157–160. doi: 10.1016/s0014-5793(03)00119-4. [DOI] [PubMed] [Google Scholar]
- Bergman LM, Blades JP. C-terminal binding proteins: Emerging roles in cell survival and tumorigenesis. Apoptosis. 2006;11:879–888. doi: 10.1007/s10495-006-6651-4. [DOI] [PubMed] [Google Scholar]
- Boyd JM, Subramanian T, Schaeper U, LaRegina M, Bayley S, Chinnadurai G. A region in the C-terminus of adenovirus 2/5 E1a protein is required for association with a cellular phosphoprotein and important for the negative modulation of T24-ras mediated transformation, tumorigenesis and metastasis. EMBO J. 1993;12:469–478. doi: 10.1002/j.1460-2075.1993.tb05679.x. [DOI] [PMC free article] [PubMed] [Google Scholar]
- Canman CE, Lim DS, Cimprich KA, Taya Y, Tamai K, Sakaguchi K, et al. Activation of the ATM kinase by ionizing radiation and phosphorylation of p53. Science. 1998;281:1677–1679. doi: 10.1126/science.281.5383.1677. [DOI] [PubMed] [Google Scholar]
- Chinnadurai G. Transcriptional regulation by C-terminal binding proteins. Int J Biochem Cell Biol. 2007;39:1593–1607. doi: 10.1016/j.biocel.2007.01.025. [DOI] [PubMed] [Google Scholar]
- El Deiry WS, Tokino T, Velculescu VE, Levy DB, Parsons RM, Trent JM, et al. WAF1, a potential mediator of p53 tumor suppression. Cell. 1993;75:805–816. doi: 10.1016/0092-8674(93)90500-p. [DOI] [PubMed] [Google Scholar]
- Furusawa TH, Moribe H, Kondoh H, Higashi Y. Identification of CtBP1 and CtBP2 as corepressors of zinc finger-homeodomain factor deltaEF1. Mol Cell Biol. 1999;19:8581–8590. doi: 10.1128/mcb.19.12.8581. [DOI] [PMC free article] [PubMed] [Google Scholar]
- Furuta S, Wang JM, Wei S, Jeng YM, Jiang X, Gu B, et al. Removal of BRCA1/CtIP/ZBRK1 repressor complex on ANG1 promoter leads to accelerated mammary tumor growth contributed by prominent vasculature. Cancer Cell. 2006;10:13–24. doi: 10.1016/j.ccr.2006.05.022. [DOI] [PubMed] [Google Scholar]
- Gartel AL, Radhakrishnan SK. Lost in translation: p21 repression, mechanisms, and consequences. Cancer Res. 2005;65:3980–3985. doi: 10.1158/0008-5472.CAN-04-3995. [DOI] [PubMed] [Google Scholar]
- Grooteclas M, Frisch SM. Evidence for a function of CtBP in epithelial gene regulation and anoikis. Oncogene. 2000;19:3823–3828. doi: 10.1038/sj.onc.1203721. [DOI] [PubMed] [Google Scholar]
- Grooteclas M, Deveraux Q, Hildebrand J, Zhang Q, Goodman RH, Frisch SM. C-terminal binding protein corepresses epithelial and proapoptotic gene expression programs. Proc Natl Acad Sci USA. 2003;100:4568–4573. doi: 10.1073/pnas.0830998100. [DOI] [PMC free article] [PubMed] [Google Scholar]
- Haapajärvi T, Kivinen L, Heiskanen A, des Bordes C, Datto MB, Wang XF, Laiho M. UV radiation is a transcriptional inducer of p21(Cip1/Waf1) cyclin-kinase inhibitor in a p53-independent manner. Exp Cell Res. 1999;248:272–9. doi: 10.1006/excr.1999.4403. [DOI] [PubMed] [Google Scholar]
- Hildebrand JD, Soriano P. Overlapping and unique roles for C-terminal binding protein 1 (CtBP1) and CtBP2 during mouse development. Mol Cell Biol. 2002;22:5296–5307. doi: 10.1128/MCB.22.15.5296-5307.2002. [DOI] [PMC free article] [PubMed] [Google Scholar]
- Ju BG, Solum D, Song EJ, Lee KJ, Rose DW, Glass CK, et al. Activating the PARP-1 sensor component of the groucho/TLE1 corepressor complex mediates a CaMKinase IIdelta-dependent neurogenic gene activation pathway. Cell. 2004;119:815–829. doi: 10.1016/j.cell.2004.11.017. [DOI] [PubMed] [Google Scholar]
- Kameoka M, Nukuzuma S, Itaya A, Tanaka Y, Ota K, Ikuta K, Yoshihara K. RNA interference directed against poly(ADP-ribose) polymerase 1 efficiently suppresses human immunodeficiency virus type 1 replication in human cells. J Virol. 2004;78:8931–8934. doi: 10.1128/JVI.78.16.8931-8934.2004. [DOI] [PMC free article] [PubMed] [Google Scholar]
- Kern SE, Pietenpol JA, Thiagalingam S, Seymour A, Kinzler KW, Vogelstein B. Oncogenic forms of p53 inhibit p53-regulated gene expression. Science. 1992;256:827–830. doi: 10.1126/science.1589764. [DOI] [PubMed] [Google Scholar]
- Kim MY, Mauro S, Gévry N, Lis JT, Kraus WL. NAD+-dependent modulation of chromatin structure and transcription by nucleosome binding properties of PARP-1. Cell. 2004;119:803–814. doi: 10.1016/j.cell.2004.11.002. [DOI] [PubMed] [Google Scholar]
- Kolthur-Seetharam U, Dantzer F, McBurney MW, de Murcia G, Sassone-Corsi P. Control of AIF-mediated cell death by the functional interplay of SIRT1 and PARP-1 in response to DNA damage. Cell Cycle. 2006;5:873–877. doi: 10.4161/cc.5.8.2690. [DOI] [PubMed] [Google Scholar]
- Kraus WL. Transcriptional control by PARP-1: chromatin modulation, enhancer-binding, coregulation, and insulation. Curr Opin Cell Biol. 2008;20:294–302. doi: 10.1016/j.ceb.2008.03.006. [DOI] [PMC free article] [PubMed] [Google Scholar]
- Krishnakumar R, Gamble MJ, Frizzell KM, Berrocal JG, Kininis M, Kraus WL. Reciprocal binding of PARP-1 and histone H1 at promoters specifies transcriptional outcomes. Science. 2008;319:819–821. doi: 10.1126/science.1149250. [DOI] [PubMed] [Google Scholar]
- Kumar V, Carlson JE, Ohg KA, Edwards TA, Rose DW, Escalante CR, et al. Transcription corepressor CtBP is an NAD+-regulated dehydrogenase. Molec Cell. 2002;10:857–869. doi: 10.1016/s1097-2765(02)00650-0. [DOI] [PubMed] [Google Scholar]
- Lee YK, Thomas SN, Yang AJ, Ann DK. Doxorubicin down-regulates Kruppel-associated Box Domain-associated Protein 1 sumoylation that relieves its transcriptional repression on p21waf1/cip1 in breast cancer MCF-7 cells. J Biol Chem. 2007;282:1595–1606. doi: 10.1074/jbc.M606306200. [DOI] [PubMed] [Google Scholar]
- Li S, Chen PL, Subramanian T, Chinnadurai G, Tomlinson G, Osborne CK, et al. Binding of CtIP to the BRCT repeats of BRCA1 involved in the transcription regulation of p21 is disrupted upon DNA damage. J Biol Chem. 1999;274:11334–11338. doi: 10.1074/jbc.274.16.11334. [DOI] [PubMed] [Google Scholar]
- Li M, Naidu P, Yu Y, Berger NA, Kannan P. Dual regulation of AP-2α transcriptional activation by poly(ADP)-ribose polymerase-1. Biochem J. 2004;382:323–329. doi: 10.1042/BJ20040593. [DOI] [PMC free article] [PubMed] [Google Scholar]
- Mottett D, Pirotte S, Lamour V, Hagedorn M, Javerzat S, Bikfalvi A, et al. HDAC4 represses p21(waf1/cip1) expression in human cancer cells through a Sp1-dependent, p53-independent mechanism. Oncogene. 2009;28:243–256. doi: 10.1038/onc.2008.371. [DOI] [PubMed] [Google Scholar]
- Moyed HS, Bertrand KP. Mutations in multicopy Tn10 tet plasmids that confer resistance to inhibitory effects of inducers of tet gene expression. J Bacteriol. 1983;155:557–564. doi: 10.1128/jb.155.2.557-564.1983. [DOI] [PMC free article] [PubMed] [Google Scholar]
- Nardini M, Spano S, Cericola C, Pesce A, Massaro A, Millo E, et al. CtBP/BARS: a dual-function protein involved in transcription co-repression and Golgi membrane fission. EMBO J. 2003;22:3122–30. doi: 10.1093/emboj/cdg283. [DOI] [PMC free article] [PubMed] [Google Scholar]
- Nibu Y, Zhang H, Bajor E, Barlo S, Small S, Levine M. dCtBP mediates transcriptional repression by Knirps, Kruppel and Snail in the Drosophila embryo. EMBO J. 1998;17:7009–7020. doi: 10.1093/emboj/17.23.7009. [DOI] [PMC free article] [PubMed] [Google Scholar]
- Ocker M, Schneider-Stock S. Histone deacetylase inhibitors: Signaling towards p21cip1/waf1. Int J Biochem Cell Biol. 2007;39:1367–1374. doi: 10.1016/j.biocel.2007.03.001. [DOI] [PubMed] [Google Scholar]
- Ogino H, Nozaki T, Gunji A, Maeda M, Suzuki H, Ohta T. Loss or PARP1 affects gene expression profile in a genome wide manner in ES cells and liver cells. BMC Genomics. 2007;8:41. doi: 10.1186/1471-2164-8-41. [DOI] [PMC free article] [PubMed] [Google Scholar]
- Pavri R, Lewis B, Kim TK, Dilworth FJ, Erdjument-Bromage H, Tempst P, et al. PARP-1 determines specificity in a retinoid signaling pathway via direct modulation of mediator. Mol Cell. 2005;18:83–96. doi: 10.1016/j.molcel.2005.02.034. [DOI] [PubMed] [Google Scholar]
- Pfaffl MW. A new mathematical model for relative quantification in real-time PCR. Nucleic Acids Res. 2001;29:e45. doi: 10.1093/nar/29.9.e45. [DOI] [PMC free article] [PubMed] [Google Scholar]
- Quinlan KG, Nardini M, Verger A, Franscesato P, Yaswen P, Corda C, et al. Specific recognition of ZNF217 and other zinc finger proteins at a surface groove of C-terminal binding proteins. Mol Cell Biol. 2006;26:8159–8172. doi: 10.1128/MCB.00680-06. [DOI] [PMC free article] [PubMed] [Google Scholar]
- Schaeper U, Boyd JM, Verma S, Uhlmann E, Subramanian T, Chinnadurai G. Molecular cloning and characterization of a cellular phosphoprotein that interacts with a conserved C-terminal domain of adenovirus E1A involved in negative modulation of oncogenic transformation. Proc Natl Acad Sci USA. 1995;92:10467–10471. doi: 10.1073/pnas.92.23.10467. [DOI] [PMC free article] [PubMed] [Google Scholar]
- Schreiber V, Amé JC, Dollé P, Schultz I, Rinaldi B, Fraulob V, et al. Poly(ADP-ribose) polymerase-2 (PARP-2) is required for efficient base excision DNA repair in association with PARP-1 and XRCC1. J Biol Chem. 2002;271:23028–23036. doi: 10.1074/jbc.M202390200. [DOI] [PubMed] [Google Scholar]
- Schreiber V, Dantzer F, Ame JC, de Murcia G. Poly(ADP-ribose): novel functions for an old molecule. Nat Rev Mol Cell Biol. 2006;7:517–528. doi: 10.1038/nrm1963. [DOI] [PubMed] [Google Scholar]
- Sewalt RG, Gunster MJ, Satijn DP, Otte AP. C-Terminal binding protein is a transcriptional repressor that interacts with a specific class of vertebrate Polycomb proteins. Mol Cell Biol. 1999;19:777–787. doi: 10.1128/mcb.19.1.777. [DOI] [PMC free article] [PubMed] [Google Scholar]
- Shi Y, Sawada JI, Sui G, Affar EB, Whetstine JR, Lan F, et al. Coordinated histone modifications mediated by a CtBP co-repressor complex. Nature. 2003;422:735–738. doi: 10.1038/nature01550. [DOI] [PubMed] [Google Scholar]
- Somasundaram K, Zhang H, Zeng YX, Houvras Y, Peng Y, Zhang H, et al. Arrest of the cell cycle by the tumour-suppressor BRCA1 requires the CDK-inhibitor p21WAF1/CiP1. Nature. 1997;389:187–190. doi: 10.1038/38291. [DOI] [PubMed] [Google Scholar]
- Sundqvist A, Sollerbrandt K, Svensson C. The carboxy-terminal region of adenovirus E1A activates transcription through targeting of a C-terminal binding protein-histone deacetylase complex. FEBS Lett. 1998;429:183–188. doi: 10.1016/s0014-5793(98)00588-2. [DOI] [PubMed] [Google Scholar]
- Takasawa R, Nakamura H, Mori T, Tanuma S. Differential apoptotic pathways in human keratinocyte HaCaT cells exposed to UVB and UVC. Apoptosis. 2005;10:1121–1130. doi: 10.1007/s10495-005-0901-8. [DOI] [PubMed] [Google Scholar]
- Tao Z, Gao P, Liu HW. Identification of the ADP-ribosylation sites in the PARP-1 automodification domain: analysis and implications. J Am Chem Soc. 2009;131:14258–14260. doi: 10.1021/ja906135d. [DOI] [PubMed] [Google Scholar]
- Tan EW, Zheng L, Lee WH, Boyer TG. Functional dissection of transcription factor ZBRK1 reveals zinc fingers with dual roles in DNA-binding and BRCA1-dependent transcriptional repression. J Biol Chem. 2004;279:6576–6587. doi: 10.1074/jbc.M312270200. [DOI] [PubMed] [Google Scholar]
- Verger A, Quinlan KGR, Crofts LA, Spano S, Corda D, Kable EPW, Braet F, Crossley M. Mechanisms directing the nuclear localization of the CtBP family proteins. Molec Cell Biol. 2006;26:4882–4894. doi: 10.1128/MCB.02402-05. [DOI] [PMC free article] [PubMed] [Google Scholar]
- Wieler S, Gagne JP, Vaziri H, Poirier GG, Benchimol S. Poly(ADP-ribose) polymerase-1 is a positive regulator of the p53-mediated G1 arrest response following ionizing radiation. J Biol Chem. 2003;278:18914–18921. doi: 10.1074/jbc.M211641200. [DOI] [PubMed] [Google Scholar]
- Wilson AJ, Byun DS, Nasser S, Murray LB, Ayanar K, Arango D, et al. HDAC4 promotes growth of colon cancer cells via repression of p21. Mol Biol Cell. 2008;19:4062–4075. doi: 10.1091/mbc.E08-02-0139. [DOI] [PMC free article] [PubMed] [Google Scholar]
- Zhang Q, Piston DW, Goodman RH. Regulation of corepressor function by nuclear NADH. Science. 2002;295:1895–1897. doi: 10.1126/science.1069300. [DOI] [PubMed] [Google Scholar]
- Zhang Q, Nottke A, Goodman RH. Homeodomain-interacting protein kinase-2 mediates CtBP phosphorylation and degradation in UV-triggered apoptosis. Proc Natl Acad Sci USA. 2005;102:2802–2807. doi: 10.1073/pnas.0409373102. [DOI] [PMC free article] [PubMed] [Google Scholar]
- Zheng L, Pan H, Li S, Fleskin-Nikitin A, Chen PL, Boyer TG, Lee WH. Sequence specific transcriptional corepressor function for BRCA1 through novel zinc finger protein, ZBRK1. Molec Cell. 2000;6:757–768. doi: 10.1016/s1097-2765(00)00075-7. [DOI] [PubMed] [Google Scholar]
Associated Data
This section collects any data citations, data availability statements, or supplementary materials included in this article.
Supplementary Materials
S1. PAR accumulates following UV-C or H2O2.
Either H2O2 (250 μM) or UV-C (UV; 50 J/m2) induced PAR after 1 hour in LNCaP cells as measured by immunofluorescence. H2O2 resulted in >97% cells PAR+. Pre-incubation with either 3AB or PJ34 prior to UV-C reduces PAR+ accumulation in a dose dependent manner. Graph is %PAR+ cells of the total DAPI+ cells counted in >10 fields.
S2. H2O2 as a p21 activator demonstrates CtBP dependent, PARP inhibitor attenuation.
Semi-quantitative PCR for p21 or β-actin control in H2O2 treated CtBP heterozygous (CtBP1+/-;2+/-) and homozygous CtBP1+2 null MEFs (CtBP1-/-;2-/-), with or without the PARP inhibitors 3AB and PJ34 or PARP inhibitors alone. Similar to the results in Figure 1, pre-incubation (1hr) with PARP inhibitors prior to the H2O2 stimulus resulted in attenuation of p21 gene expression in the presence of CtBP in the CtBP1(+/-)2(+/-) MEFs, but not in the absence of CtBP in CtBP1(+/-)2(+/-) MEFs.
S3. PARP1 levels in CtBP MEFs.
Western blot for PARP1 in CtBP 1+2 heterozygous (+/-) or null (-/-) MEFs in control (0 hrs) or 6 hours post treatment with UV-C.
S4. CtBP remains nuclear and its levels do not change following γ-IR treatment.
Indirect immunofluorescence for CtBP1 in the 3 indicated cell lines demonstrating that 24 hours after a 10Gy dose of γ-IR that CtBP is predominately nuclear, similar to the results in Figure 1E for UV-C and adriamycin. TOPRO (Invitrogen) used per manufacturers instructions is shown as a nuclear indicator.
(Right) Western blot for CtBP1, p53 or tubulin (loading control) in parallel cultured H1299 cells treated with either adriamycin (Ad) or γ-IR (IR) and analyzed after 24 hours demonstrating that the absolute levels of CtBP do not change with these treatments, similar to results seen in Figure 1 and 2.
S5. Varying doses of UV-C do not change CtBP levels.
A dose ranging experiment 24 hours post-treatment with different doses of UV-C (0-2000 J/m2) on three different cell lines analyzed by western blot (WB) for CtBP1, p53 and tubulin. This experiment was performed plated, treated and analyzed in parallel with the 6 hour experiment in Figure 2B. No significant difference in CtBP protein is seen.
S6. CtBP1-A52D abrogates PxDLS binding but retains repression activity as a GAL4 DNA binding domain fusion.
(A) Mammalian 2-hybrid assay for the CtBP-E1A interaction. A minimal TATA-luciferase promoter containing 4 repeats of a GAL4 binding DNA binding site (75ng) was co-transfected into U2OS cells with a Renilla luciferase control vector (10ng) and a construct expressing the fusion protein GAL4-E1A either alone or with constructs expressing VP16-CtBP1 fusion proteins (200ng) and luciferase activity measured after 24 hours. The data were normalized to Renilla luciferase activity and set relative to the control. A single triplicate, representative experiment is shown. Wild type CtBP1 is able to bind to the E1A protein containing a PxDLS motif, reconstituting a strong transcriptional activator, whereas CtBP1-A52D does not. Error bars represent SEM (n=3). Protein levels of expressed CtBP proteins were equivalent by Western blot (not shown).
(B) A thymidine kinase (TK) luciferase reporter construct containing 4 repeats of a GAL4 DNA binding domain (75ng) was co-transfected with a Renilla luciferase control and either wild type CtBP1 or CtBP1-A52D into U2OS cells, the activity measured and data graphed as in (A). A single, parallel triplicate experiment is shown. Both wild type CtBP1 and CtBP1-A52D GAL4 fusion proteins are able to repress the TK promoter indicating CtBP1-A52D retains the ability to bind to other (co)-repressive elements necessary for this activity, similar to wild-type CtBP1. Error bars SEM (n=3).
S7. Indirect immunofluorescence for endogenous or transfected CtBP1 or CtBP2 in H1299 cells.
(A) Immunofluorescence for endogenous CtBP1 and either transfected CtBP 1 or 2 in H1299 cells. H1299 cells were either immunostained with anti-CtBP1 (Untransfected) or transfected with FLAG-CtBP1 (CtBP1) or FLAG-CtBP2 (CtBP2) and immunostained with anti-FLAG after 24 hours. DAPI is shown as a nuclear counterstain.
S8. CtBP1 levels in the C90:CtBP1 cells are similar to endogenous CtBP1.
Western blot for CtBP1 in U2OS (U2), CtBP1+2 null MEFs (CtBP1-/-;2-/-; C90) and the CtBP1 reconstituted CtBP1+2 null MEF cell line (C90:CtBP1). Near equivalent levels of CtBP1 are seen in the C90:CtBP1 cell line as the endogenous levels in U2OS. The CtBP1 protein in C90:CtBP1 cells runs slightly higher because it contains a 2xFLAG epitope. Tubulin is shown as a loading control.