Summary
Serial block face imaging is a microscopy technique in which the top of a specimen is cut or ground away and a mosaic of images is collected of the newly revealed cross-section. Images collected from each slice are then digitally stacked to achieve three-dimensional images. The development of fully-automated image acquisition devices has made serial block face imaging more attractive by greatly reducing labor requirements. The technique is particularly attractive for studies of biological activity within cancellous bone as it has the capability of achieving direct, automated measures of biological and morphological traits and their associations with one another. When used with fluorescence microscopy, serial block face imaging has the potential to achieve 3D images of tissue as well as fluorescent markers of biological activity. Epifluorescence-based serial block face imaging presents a number of unique challenges for visualizing bone specimens due to noise generated by subsurface signal and local variations in tissue autofluorescence. Here we present techniques for processing serial block face images of trabecular bone using a combination of non-uniform illumination correction, precise tiling of the mosaic in each cross-section, cross-section alignment for vertical stacking, removal of subsurface signal, and segmentation. The resulting techniques allow examination of bone surface texture that will enable 3D quantitative measures of biological processes in cancellous bone biopsies.
Keywords: Bone remodeling, cancellous bone, epifluorescence microscopy, fluorescence imaging, histomorphometry, image processing
INTRODUCTION
Bone remodeling is the primary processes for modifying bone mass in adults. Bone remodeling is therefore a key process in the development and treatment of osteoporosis and other metabolic bone diseases. Bone remodeling occurs at discrete locations on the bone surface and consists of a group of osteoclasts that remove a patch of bone, followed in time by a group of osteoblasts that form bone at the same location. Characteristics of bone remodeling such as the rate of appearance of new remodeling events, the percent eroded surface (where osteoclasts have resorbed bone and formation has not yet initiated), and the rate at which new bone is formed are often measured histologically in bone biopsies to diagnose disease and to compare treatments. Histological examination of bone biopsies remains the only way to measure localized aspects of bone remodeling (Compston, 2004). Currently, such histological analysis is performed on two-dimensional sections using light and epifluorescence microscopy as part of a technique known as “dynamic bone histomorphometry” (Weibel, 1979; Kimmel & Jee, 1983; Parfitt et al., 1987). Dynamic bone histomorphometry is a specialized technique that uses model-based stereological principles to obtain quantitative data about the bone remodeling process in a specimen. Dynamic histomorphometry is commonly performed in clinical and pre-clinical studies of osteoporosis therapies and occasionally for diagnosis of metabolic bone disease. In a dynamic bone histomorphometry study, subjects are given two doses of a fluorescent marker separated by some time (typically one week in human studies) (Kimmel & Jee, 1983; Rao, 1983). The fluorescent marker (tetracycline in humans) binds to regions of newly forming bone. In the histology slide, the percent of bone surface covered with the fluorescent label, and the distance between the two labels are used to calculate measures of bone formation and the rate of bone turnover (commonly expressed per unit bone surface). Additionally, the eroded surface is measured as an assay of osteoclast activity. These dynamic bone histomorphometry measures are commonly performed through stereological point counting as well as by manually tracing regions of interest using commercially available microscope-computer data acquisition systems. Surface areas in bone, some of the most important types of measures, are commonly estimated from perimeter measurements using a geometric model (Parfitt et al., 1987).
Although dynamic bone histomorphometry is the only technique capable of achieving local measures of bone remodeling, the approach is not without limitations. After the technique is applied to two-dimensional histological sections, a geometric model is commonly used to interpret two-dimensional measures of perimeter in terms of surface area (Parfitt et al., 1987). Another challenge in dynamic bone histomorphometry is that many of the measurements require manual segmentation and tracing of traits of interest, making the analysis technique time intensive and subject to considerable inter-observer variation, factors that limit precision (Recker, 1983; Compston et al., 1986; Parfitt et al., 1987; Wright et al., 1992). Lastly, the spatial relationship between different aspects of the remodeling process (distances between bone formation and bone resorption for example) cannot be evaluated in two-dimensional sections and is an unproven assumption used in dynamic bone histomorphometry. Unbiased model-independent methods have been occasionally applied to remove the need for a geometric model when evaluating percent labeled and percent eroded surfaces (Vesterby et al., 1987).
Instead of dynamic histomorphometry, we used a direct 3D approach. Serial block face imaging is an image acquisition technique that has the potential to lead to three-dimensional dynamic bone histomorphometry. The technique has been used to obtain three-dimensional images of cancellous bone structure for some time (Odgaard et al., 1990; Beck et al., 1997; Kazakia et al., 2007). Serial block face imaging involves repeatedly trimming off the top of a specimen and collecting images of the specimen block’s newly revealed cross-section. By collecting images of the specimen block instead of serial sections, labor requirements are reduced because there is no need to mount and align individual sections. Additionally, because a mosaic of images can be collected using serial block face imaging, the size of the specimen that can be imaged is independent of resolution, unlike other common three-dimensional imaging techniques, such as micro-computed tomography, in which the field-of-view decreases as image resolution increases and the capability of imaging multiple overlapping regions to form mosaics may not be present. While confocal microscopy is also capable of obtaining three-dimensional images like those obtained through serial milling, it is severely limited in the depth of material that may be visualized (~100 μm maximum). A limitation of serial block face imaging is that it is destructive (no histological slides are available for later analysis) and time intensive (Kazakia et al., 2007).
Recently, Kazakia and colleagues demonstrated a technique for serial block face imaging implemented through fully-automated serial milling (Kazakia et al., 2007). Images were collected using fluorescent microscopy and were shown to be suitable for forming three-dimensional images of bone and fluorescent markers, indicating that the image acquisition approach has the potential to achieve three-dimensional images for dynamic bone histomorphometry. However, bone formation indices (i.e. fluorescent markers) are not the only important measures in bone histomorphometry, measures of the bone surface are also important (measures of fluorescent markers are expressed relative to bone surface). Additionally, measures of the percent of the bone surface that has been eroded by osteoclasts are also used to interpret histomorphometry data. Eroded surfaces are regions on the bone that have undergone or are currently undergoing bone resorption and are detected as irregularities on the bone surface (the so-called “scalloped surface” or “crenated surface”) (Parfitt et al., 1987). Eroded surfaces are not readily visible in images obtained by Kazakia and colleagues, suggesting that increased image resolution and/or improved image processing techniques are required to detect such surface traits. Potential limitations of previously used image processing techniques are that they do not account for noise generated by material below the surface of the specimen or variability in tissue intensity, which can make segmentation challenging.
The long-term goal of this work is to achieve direct three-dimensional measures of bone remodeling activity in bone biopsies. Toward that goal, the current work demonstrates a method of processing images obtained through serial block face imaging to capture representations of bone surface texture and architecture that can be used to identify eroded surfaces.
Methods
Imaging System
Serial block face imaging using epifluorescence is implemented using a serial milling device as described by Kazakia and colleagues (Kazakia et al., 2007). We refer the reader to the original publication for a thorough description of the image acquisition device and comparison to other available approaches. We only briefly describe the technique here. The device consists of a computer numerically controlled (CNC) milling device with an attached microscope, high-resolution digital camera, fluorescent light source and automated filter changer. A specimen embedded in methyl-methacrylate is secured to the CNC workbench and the top five micrometers of the sample are removed by the endmill. Automated air pressure release and vacuum ensure that the surface is clear of cutting particles. Cutting artifacts on the specimen surface (grooves aligned with endmill rotation) are present but have a negligible effect on image clarity. After cutting, the specimen is automatically positioned beneath the microscope and images are obtained using one or more fluorescence filter sets. The process is repeated until the desired volume of the specimen has been acquired. In our implementation, a 14 bit gray-scale digital camera with 2048 X 2048 pixel field-of-view is used to collect images (pco2000, Cooke Corp., Romulus, MI, USA). Resolution of the images is controlled using different microscope objectives (we have achieved success with 4X and 10X objectives, corresponding to pixel sizes ranging from 1.8 μm to 0.7μm). Images described below are collected using a 10X objective (0.7μm/pixel). Out-of-plane resolution is determined by the amount of material trimmed away in each slice (5 μm in the current implementation). A complete raw image of rat vertebral cancellous bone requires a 4 × 3 array of images within each cross-section for a total cross-sectional area of 5.1 × 4.4 mm. A depth of 4mm achieved using 800 image slices (5 μm/slice) requires five days of fully-automated image acquisition. The raw images occupy 80 GB of memory for each fluorescent channel (16-bit data).
Image Processing Overview
A series of automated image processing steps is used to generate three-dimensional images of the bone surface. First, non-uniform illumination correction is applied to the images to equalize the contrast and intensity of the signals over each image field-of-view (FOV). Subsequently, a mosaic is created by aligning overlapping image regions using normalized cross-correlation. Alignment (registration) of each cross-section in the stack is performed using fiduciary markers (vertical objects placed close to the specimen to allow more precise alignment for stacking). Cross-sectional alignment then allows for precise subtraction of sub-surface fluorescence. Each image cross-section is then cropped to present only cancellous bone from the rat vertebra, reducing image size for the 800 slices from 80 GB/fluorescent channel to 35 GB/fluorescent channel (stored as 16-bit data). Finally, segmentation is performed using an advanced technique known as iterative thresholding (Wu et al., 2001). The segmented signals occupy a total of 2.2 GB of data and can then be visualized as isosurfaces. Image processing is performed using custom software written for Matlab (Mathworks, Natick, Massachusetts, USA). Three-dimensional visualization is performed using Amira (Visage Imaging, Inc., Carlsbad, California, USA).
Non-uniform Illumination Correction
Non-uniform illumination in epifluorescence imaging results in reduced signal intensity towards the edges and corners of each field-of-view. Non-uniform illumination is problematic because reduced pixel intensities at image edges result in decreased signal-to-noise ratio. Poor signal-to-noise ratio can result in segmentation errors and prevent proper mosaic tiling. To compensate for non-uniform illumination, there are two approaches. The first is to use a smaller field-of-view centered on the light source to achieve a flat illumination profile. One drawback to this option in serial block face imaging is that a reduced field-of-view requires a larger mosaic (more images per cross-section) to capture the same image area, substantially increasing image acquisition time. Instead, we compensate for non-uniform illumination post-hoc.
Background intensity profiles for our system are well characterized by polynomial surfaces (Tomazevic et al., 2002). The non-uniform illumination correction algorithm we employ uses a second order polynomial intensity profile fit in the x-y plane of the form:
| (1) |
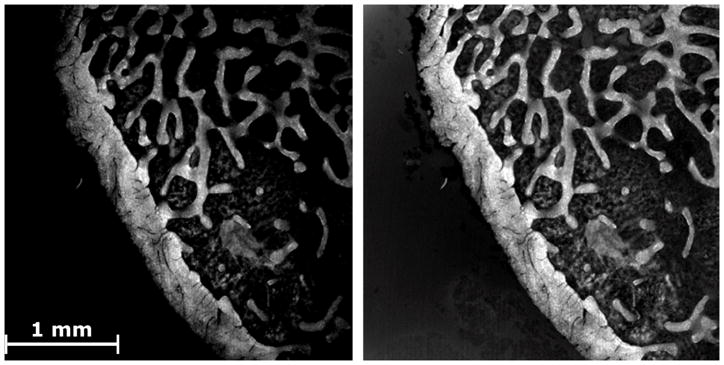
To determine the coefficients ai, a system of linear equations is solved using the intensities (IB) at locations within an image. The locations are taken from the lowest intensity values in each of 16 equally sized rectangular subdivisions of the image. Although only six points are necessary to solve (1), all 16 are used to reduce the contribution of noise. Using these parameters, an illumination profile is generated for each image in the mosaic. The original image is then divided by the illumination profile (Figure 1) (Chow et al., 2006; Russ, 2006).
Figure 1.
An image of a bone specimen (bright) is shown. (Left) The original image shows reduced signal intensity at the periphery of the FOV. (Right) The same image after correction for non-uniform illumination.
Mosaic Tiling
An important advantage of using serial block face imaging is that a mosaic of images can be collected. This allows image resolution to be selected independent of the physical size of the specimen. When collecting a mosaic of images, the repeatability of stage positioning can affect the relative positions of each field-of-view. This effect is negligible when the positioning repeatability of the stage is less than one image pixel. However, at higher magnification, this inaccuracy has the potential to influence quantitative measurements of surface texture, surface area and spatial correlations among small features.
Because our pixel size is much smaller than the positioning repeatability in our system (5 μm), images in the mosaic must be aligned using automated tiling (Chow et al., 2006). To reduce computational expense, only regions corresponding to a prescribed overlap ± camera positioning repeatability are used to achieve the tiled mosaic. Vertical alignment of each cross-section is similarly subject to stage positioning inaccuracy and is addressed using a set of fiduciary markers (in this case perpendicular holes drilled into the embedding media near the specimen) (McNamara et al., 2006).
Sub-surface Signal Removal
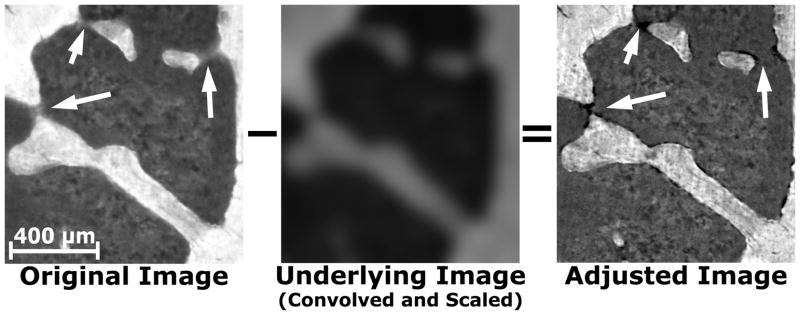
Serial block face imaging with epifluorescence is subject to noise created by signal originating below the primary optical plane. The sub-surface signal manifests itself as blurred features in an image (Figure 2). The use of an opaque embedding medium can mediate this effect, but subsurface fluorescence cannot be attenuated completely. To remove a majority of sub-surface fluorescence, we first express the intensity of light detected by the imaging system in two consecutive slices as a sum of the intensity within the optical plane as well as that below the optical plane as follows:
| (4) |
| (5) |
where I0 is the excitation light intensity. Ii and Ii+1represent the intensity of a pixel measured in two sequential cross-sections. The Fi terms represent the actual fluorescence intensities of tissue at each slice number i. The terms μ and Tat/Tta, which vary from 0 to 1, represent coefficients of signal attenuation due to embedding medium and the transition from air to tissue/tissue to air, respectively and s is the thickness of each slice (5 μm in this application). If we assume that all sub-surface signal seen in an image is contained within image i+1, subtraction of the two observed intensities will obtain the true in-plane signal (Figure 2). The true signal is then calculated as follows:
| (6) |
where h represents a convolution kernel simulating the dispersion of light due to the scattering effect of the tissue and embedding medium. A parametric analysis found that Gaussian kernel of size 5 × 5 provides suitable results, as it rather accurately models the blurring due to the dispersion effect of the embedding medium. The attenuation constant of the scattered signal (μ) is calculated from the signal intensity of pixels that are identified as partial volumes (i.e. where the specimen is present in one slice but not the slice below). The value of μ is specific to each specimen due to variations in the opacity of the embedding medium from specimen to specimen. Typical values of μ were 0.04 – 0.08 in the specimens examined in the current study (note that Tat and Tta do not need be explicitly determined).
Figure 2.
The original image of trabecular bone shows considerable sub-surface signal observed as blurring (Arrows). The underlying image is convolved, scaled, and then subtracted from the original image to adjust for sub-surface signal. The adjusted image does not have the blurred regions and the edges of the bone are more defined.
Deconvolution can be used as a secondary method to remove sub-surface signal and will also remove blurring due to lens aberrations. Application of 3D deconvolution in our implementation caused only marginal improvements in out-of-plane signal removal and did not justify the computational expense.
Segmentation
Segmentation and isosurface renderings are required for automated and semi-automated measures of bone remodeling in 3D images. Global thresholding can be insufficient for segmenting epifluorescence images of bone due to variations in signal intensity and noise associated with autofluorescence of neighboring tissues (marrow cells and extracellular matrix). A liberal global threshold is capable of retaining most, if not all, of the bone in the segmentation, but the resulting segmentation will often contain neighboring tissues, potentially confounding measures of bone surface texture. Similar challenges are present when segmenting images of bone collected through micro computed tomography where global thresholds are typically set manually, introducing inter-observer variation (Waarsing et al., 2004). Images with strong edges (high contrast) and relatively uniform signal intensity (specimen/void interfacial gradients) can successfully be segmented using local adaptive algorithms, such as that proposed by Burghardt et al. (Burghardt et al., 2007). However, images collected through epifluorescence (particularly images of bone) require a different segmentation approach.
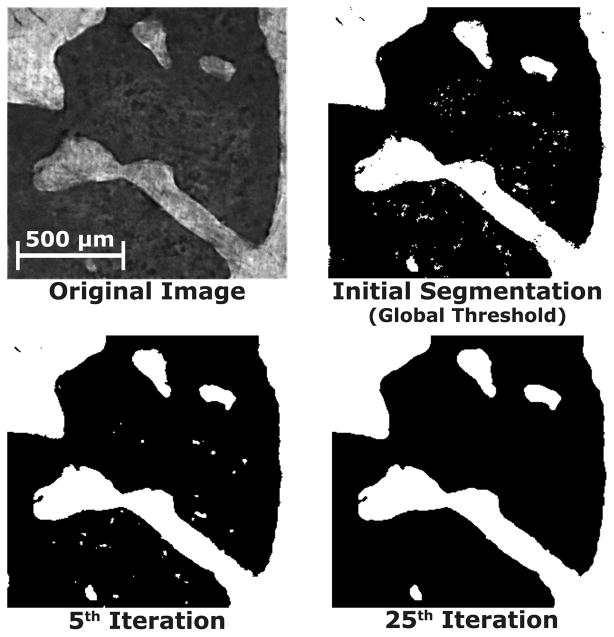
One solution is to employ an “iterative” thresholding algorithm as described by Wu et al. (Wu et al., 2001). Although we refer the reader to the original article for a complete description of the iterative thresholding approach, we will describe it briefly here. In iterative thresholding, a field of pixel specific threshold values is iteratively adjusted based on the local neighborhood (Figure 3). A matrix containing pixel specific threshold values (Txy) is created and applied to the original image. This threshold matrix is initially a uniform value determined using the histogram triangle method (Zack et al., 1977). A second matrix (ΔTxy) is then created to describe a change in pixel specific threshold values. ΔTxy is created such that the threshold Txy will be reduced for pixels that exceed the threshold and will be increased for pixels that are below the threshold. ΔTxy is then convolved by a 3 × 3 Gaussian kernel so that changes in the threshold are mediated by the local neighborhood. ΔTxy is then added to Txy to create new pixel-specific threshold values. These steps are repeated a specified number of iterations. The total number of iterations is selected based on comparisons of the segmented image to the grayscale version, similar to selections of global thresholds used in processing micro-computed tomography images (Kazakia et al., 2008). In our implementation 25–30 iterations are commonly selected (Figure 4). Following segmentation, a morphological processing step is applied in 3D to remove any remaining groups of free-floating voxels that represent noise in images of bone (from components within the marrow space). Total image processing time for a rat lumbar vertebra (5.1mm × 4.4mm × 4mm) is typically 5 days on a 2.66GHz dual-core Intel processor with 1333 MHz front side bus and 18GB of RAM.
Figure 3.

Images are segmented using an iterative thresholding algorithm adapted from Wu, et al. (2001). An original image is segmented using a matrix of pixel-specific threshold values. Subsequently, the threshold values are adjusted and the original image is segmented again. This process is repeated for a number of iterations selected by user comparison to the gray-scale image.
Figure 4.
An original image shows bone (bright) and surrounding marrow (dark). More bone and less marrow is included in the segmentation as the algorithm iterates (bottom left). After the final (25th) iteration, some free floating pixels representing marrow components (noise) are removed (bottom right). Note the improvement in the segmentation in comparison to global thresholding (top right).
To determine improvements gained by using these steps, images of cancellous bone from the fourth lumbar vertebra from five rats are collected and processed using the same approach used in previous publications (no mosaic tiling or out-of-plane signal subtraction and a global threshold) as well as the current technique. The two techniques are compared by measuring bone volume fraction (the ratio of bone volume to total image volume, BV/TV), specific surface (ratio of bone surface to total image volume, BS/TV), and the mean local surface curvature across the entire bone surface. Mean local surface curvature is used as an indicator of how well the processing techniques represent roughness of the final bone surface. Local curvature measures are obtained using a built-in function in Amira (GetCurvature) that fits a quadric surface to a 26-connected local neighborhood around each polygon. The maximum eigenvalue (in magnitude) for each quadric surface is determined and the average over the whole specimen is used as a measure of local curvature, with larger values indicating more irregular surface texture. Because scanning electron microscopy of cancellous bone suggests that bone surfaces not part of resorption cavities are smooth (Mosekilde, 1990), images with lower mean local curvature values can be considered more accurate depictions of the bone surface (eroded surfaces typically represent less than 10% of the total bone surface and will therefore not greatly influence measures of local surface curvature) (Li et al., 2003). The raw images, collected at a resolution of 0.7 μm/pixel in-plane, are uniformly coarsened to 3.6 μm/pixel in-plane to determine the influence of resolution on the final image. Statistical comparisons of images processed using different techniques were performed using paired t-tests.
Results
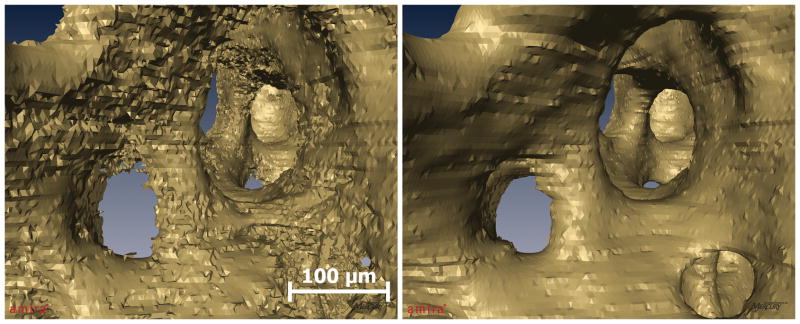
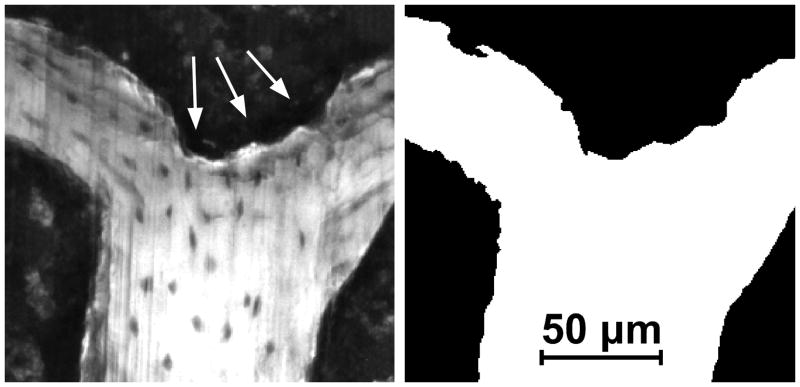
High-resolution images processed with the techniques described in the current study showed much smoother bone surfaces than those processed with previous techniques (Figures 5–7). Surface irregularities characteristic of osteoclast activity are readily visible in the grayscale and segmented images at 0.7 μm resolution (Figures 6–7) and are not visible in lower resolution images or images processed using previous techniques. Iterative thresholding was particularly effective because it properly segmented noise and was capable of producing a segmentation in which the irregular surface texture resulting from remodeling activity was distinguishable from the rest of the bone.
Figure 5.
Images of cancellous bone acquired through serial block face imaging processed with previously described techniques (left) and with the current techniques (right). Both images have been visualized using identical isosurface smoothing parameters. Images processed using the current technique show a much smoother bone surface that is similar to images obtained using scanning electron microscopy (Mosekilde, 1990).
Figure 7.
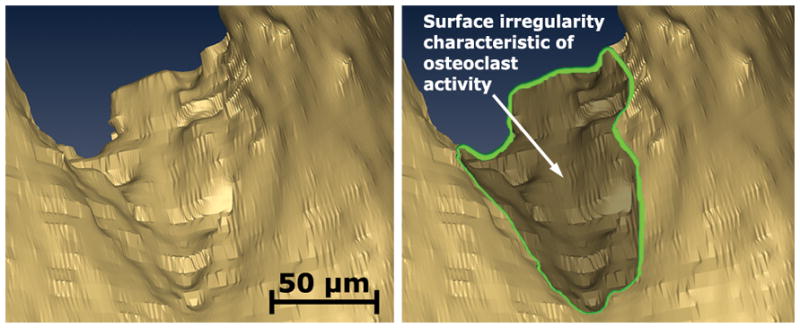
An isosurface rendering of a location on the bone surface is shown illustrating surface texture variations characteristic of eroded surfaces.
Figure 6.
(Left) A gray scale image of the cancellous bone surface collected using serial block face imaging is shown. An eroded surface is indicated by bone surface irregularities (arrows). Non-eroded surfaces are smooth (lower right corner of the image). (Right) A fully processed version of the same image in which the bone surface irregularities characteristic of eroded surface can also be seen.
In the highest resolution images, the inclusion of automated tiling, out-of-plane signal subtraction, and iterative thresholding resulted in a large reduction in mean surface curvature. Images processed using the current techniques with an in-plane resolution of 0.7 μm showed a mean surface curvature 40.6% less than when processed using previous techniques (p <0.05, Table 1). No significant differences in bone volume fraction or bone specific surface (the ratio of bone surface to total specimen volume) were observed among images at 0.7 μm/pixel resolution. In images with an in-plane resolution of 3.6 μm (similar to the resolution used in previous serial milling implementations) no significant differences in mean surface curvature, bone volume fraction or specific surface were observed between processing methods.
Table 1.
Bone volume fraction, bone surface density, and the mean surface curvature of cancellous bone isosurfaces (mean ± SD) were measured in 5 rat lumbar vertebrae using the previous image processing techniques and the revised techniques presented in the current study. Non uniform illumination (NUI) correction was applied in all cases.
| 0.7 μm | 0.7 μm | 3.6 μm | 3.6 μm | |
|---|---|---|---|---|
| Previous | Revised | Previous | Revised | |
| Bone Volume Fraction (BV/TV) | 35.6 ± 3.5% | 35.2 ± 3.3% | 37.0 ± 5.5% | 35.1 ± 3.3% |
| Bone Surface/Bulk Volume (BS/TV, 1/mm) | 12.8 ± 1.3 | 13.8 ± 2.6 | 11.7 ± 2.0 | 11.6 ± 1.7 |
| Mean Surface Curvature (1/μm) | 2.6 ± 0.6 | 1.8 ± 0.5* | 1.1 ± 0.6 | 1.3 ± 0.5 |
Different from image processed using previous methods (p <0.05, paired t-test)
Discussion
At high resolution (0.7 μm/pixel in-plane), the image processing techniques described here provide a substantial improvement in bone surface representation. At lower resolutions, however, there is little improvement in surface representation when using the more refined processing we have presented. Furthermore, measures of bone volume fraction do not appear to be sensitive to image resolution and are similar when using both image processing techniques.
The strength of the current image processing approach is that it addresses the major challenges in processing images obtained through serial block face imaging using fluorescent microscopy: mosaic tiling and vertical alignment, out-of-plane signal, and variations in tissue intensity. Additionally, when using the technique on high-resolution (0.7 μm/pixel) images, eroded surfaces are visible and appear similar to those observed using scanning electron microscopy. This approach therefore has the potential to allow measurements of the number and size of individual eroded surfaces in a three-dimensional image of cancellous bone, measurements that cannot be achieved with traditional two-dimensional histomorphometry techniques. A limitation of the current approach is that the image processing methods are specific to serial block face imaging.
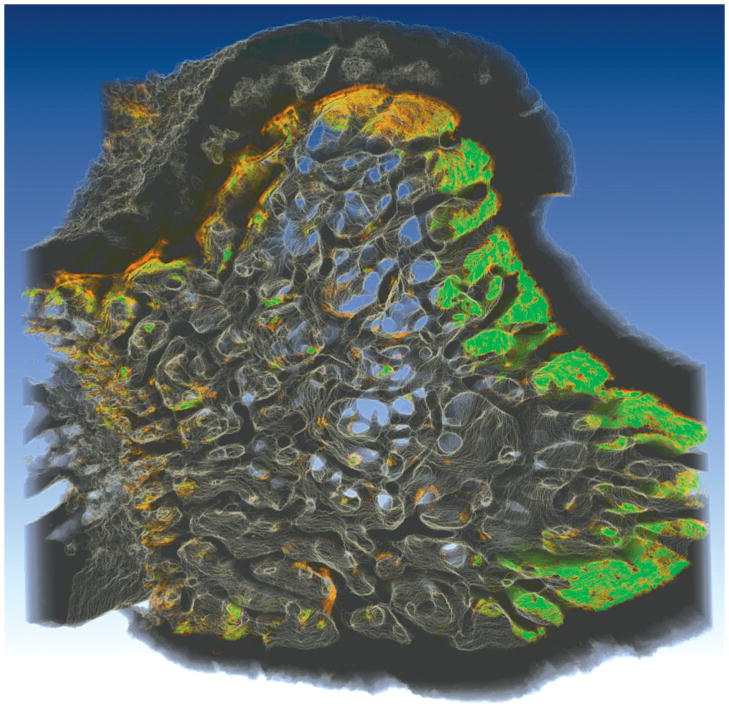
Previous implementations of serial block face imaging through epifluorescence used lower image resolution (3.3 μm/pixel in-plane) and more rudimentary image processing techniques (no adjustment for out-of-plane signal and use of a global threshold) (Kazakia et al., 2007). The current study suggests that such an approach will achieve adequate representations of bone microarchitecture (as are commonly performed in three-dimensional images obtained through micro-computed tomography), but will not provide representations of bone surface texture needed to detect eroded surfaces. At higher image resolutions (0.7 μm/pixel in-plane) surface texture irregularities characteristic of eroded surfaces can be detected, but only when using more complicated image processing steps, such as those presented in the current study. Serial block face imaging has a number of advantages over other three-dimensional imaging modalities that may be applied to bone (confocal microscopy, micro-computed tomography, serial sectioning) because it can capture both an almost unlimited specimen size and fluorescent markers (see Kazakia et al. 2007 for a thorough discussion of the advantages and disadvantages of this image acquisition approach). Although analysis of fluorescent markers of bone formation was not performed in the current study, the same image processing techniques could be applied to images of bone with fluorescent markers of bone formation (Figure 8). With the inclusion of bone formation markers, unique measurements such as the spatial relationship between eroded surfaces and local bone formation could be achieved. The advancements in processing presented here will enable further development of automated and semi-automated measurement techniques to achieve three-dimensional dynamic bone histomorphometry. Future studies will involve validation of these three-dimensional measurements, including comparison to the current two-dimensional histology standard.
Figure 8.
An image of a rat tibial metaphysis, collected using serial milling and processed using the methods described in the current study, is shown. Two different fluorescent markers were applied to the animal prior to euthanasia, xylenol orange (shown in orange) followed one week later by calcein (shown in green). Three-dimensional images of the bone and the fluorescent markers of bone formation were collected using serial block face imaging with fluorescent markers processed using global thresholding. Future work will refine and validate the image processing techniques used to examine the fluorescent markers to allow direct, three-dimensional measures of eroded surfaces as well as the fluorescent markers of bone formation.
Acknowledgments
This work was supported by NIH/NIAMS R21 AR054448 and T32 AR007505-22 (C.R.S.). Dr. Wilson has an interest in BioInVision, Inc., which may commercialize the serial milling technology.
References
- Beck JD, Canfield BL, Haddock SM, Chen TJ, Kothari M, Keaveny TM. Three-dimensional imaging of trabecular bone using the computer numerically controlled milling technique. Bone. 1997;21:281–287. doi: 10.1016/s8756-3282(97)00122-1. [DOI] [PubMed] [Google Scholar]
- Burghardt AJ, Kazakia GJ, Majumdar S. A local adaptive threshold strategy for high resolution peripheral quantitative computed tomography of trabecular bone. Ann Biomed Eng. 2007;35:1678–1686. doi: 10.1007/s10439-007-9344-4. [DOI] [PubMed] [Google Scholar]
- Chow SK, Hakozaki H, Price DL, MacLean NA, Deerinck TJ, Bouwer JC, Martone ME, Peltier ST, Ellisman MH. Automated microscopy system for mosaic acquisition and processing. J Microsc. 2006;222:76–84. doi: 10.1111/j.1365-2818.2006.01577.x. [DOI] [PubMed] [Google Scholar]
- Compston JE. Bone histomorphometry -- the renaissance? BoneKey-Osteovision. 2004;1:9–12. [Google Scholar]
- Compston JE, Vedi S, Stellon AJ. Inter-observer and intra-observer variation in bone histomorphometry. Cal Tiss Int. 1986;38:67–70. doi: 10.1007/BF02556831. [DOI] [PubMed] [Google Scholar]
- Kazakia GJ, Burghardt AJ, Cheung S, Majumdar S. Assessment of bone tissue mineralization by conventional x-ray microcomputed tomography: Comparison with synchrotron radiation microcomputed tomography and ash measurements. Med Phys. 2008;35:3170–3179. doi: 10.1118/1.2924210. [DOI] [PMC free article] [PubMed] [Google Scholar]
- Kazakia GJ, Lee JJ, Singh M, Bigley RF, Martin RB, Keaveny TM. Automated high-resolution three-dimensional fluorescence imaging of large biological specimens. J Microsc. 2007;225:109–117. doi: 10.1111/j.1365-2818.2007.01721.x. [DOI] [PubMed] [Google Scholar]
- Kimmel DB, Jee WSS. Measurements of area, perimeter, and distance: Details of data collection in bone histomorphometry. In: Recker R, editor. Bone histomorphometry: Techniques and interpretation. CRC Press; Boca Raton: 1983. [Google Scholar]
- Li CY, Jee WSS, Chen A, Mo A, Setterberg RB, Su M, Tian XY, Ling YF, Yao W. Estrogen and ‘‘exercise’’ have a synergistic effect in preventing bone loss in the lumbar vertebra and femoral neck of the ovariectomized rat. Cal Tiss Int. 2003;72:42–49. doi: 10.1007/s00223-001-1086-y. [DOI] [PubMed] [Google Scholar]
- McNamara LM, van der Linden JC, Weinans H, Prendergast PJ. Stress-concentrating effect of resorption lacunae in trabecular bone. In: J Biomech. 2006;39:734–741. doi: 10.1016/j.jbiomech.2004.12.027. [DOI] [PubMed] [Google Scholar]
- Mosekilde L. Consequences of the remodelling process for vertebral trabecular bone structure: A scanning electron microscopy study (uncoupling of unloaded structures) J Bone Miner Res. 1990;10:13–35. doi: 10.1016/0169-6009(90)90046-i. [DOI] [PubMed] [Google Scholar]
- Odgaard A, Andersen K, Melsen F, Gundersen HJG. A direct method for fast three-dimensional serial reconstruction. J Microsc. 1990;159:335–342. doi: 10.1111/j.1365-2818.1990.tb03038.x. [DOI] [PubMed] [Google Scholar]
- Parfitt AM, Drezner MK, Glorieux FH, Kanis JA, Malluche H, Meunier PJ, Ott SM, Recker RR. Bone histomorphometry: Standardization of nomenclature, symbols, and units. Report of the asbmr histomorphometry nomenclature committee. J Bone Miner Res. 1987;2:595–610. doi: 10.1002/jbmr.5650020617. [DOI] [PubMed] [Google Scholar]
- Rao DS. Practical approach to bone biopsy. In: Recker R, editor. Bone histomorphometry: Techniques and interpretation. CRC Press; Boca Raton: 1983. [Google Scholar]
- Recker R. Introduction to bone histomorphometry. In: Recker R, editor. Bone histomorphometry: Techniques and interpretation. CRC Press; Boca Raton: 1983. [Google Scholar]
- Russ JC. The image processing handbook. CRC Press; Boca Raton: 2006. [Google Scholar]
- Tomazevic D, Likar B, Pernus F. Comparative evaluation of retrospective shading correction methods. J Microsc. 2002;208:212–223. doi: 10.1046/j.1365-2818.2002.01079.x. [DOI] [PubMed] [Google Scholar]
- Vesterby A. Unbiased stereological estimation of osteoid and resorption fractional surfaces in trabecular bone using vertical sections: sampling efficiency and biological variation. Bone. 1987;8:333–337. doi: 10.1016/8756-3282(87)90063-9. [DOI] [PubMed] [Google Scholar]
- Waarsing J, Day J, Weinans H. An improved segmentation method for in vivo uct imaging. J Bone Miner Res. 2004;19:1640–1650. doi: 10.1359/JBMR.040705. [DOI] [PubMed] [Google Scholar]
- Weibel ER. Stereological methods: Practical methods for biological morphometry. Academic Press; London: 1979. [Google Scholar]
- Wright CDP, Vedi S, Garrahan NJ, Stanton M, Duffy SW, Compston JE. Combined inter-observer and inter-method variation in bone histomorphometry. Bone. 1992;13:205–208. doi: 10.1016/8756-3282(92)90198-6. [DOI] [PubMed] [Google Scholar]
- Wu HS, Barba J, Gil J. Iterative thresholding for segmentation of cells from noisy images. J Microscopy. 2001;197:296–304. doi: 10.1046/j.1365-2818.2000.00653.x. [DOI] [PubMed] [Google Scholar]
- Zack GW, Rogers WE, Latt SA. Automatic measurement of sister chromatid exchange frequency. J Histochem Cytochem. 1977;25:741–753. doi: 10.1177/25.7.70454. [DOI] [PubMed] [Google Scholar]


