

Abstract
Purpose
The in vivo evaluation of three modified polyethylene glycol (PEG)-anilinoquinazoline derivatives labeled with 124I, 18F, and 11C as potential positron emission tomography (PET) bioprobes for visualizing epidermal growth factor receptor (EGFR) in cancer using small animal PET.
Procedures
Xenograft mice with the human glioblastoma cell lines U138MG (lacking EGFR expression) and U87MG.wtEGFR (transfected with an overexpressing human wild-type EGFR gene) were used. Static and dynamic PET imaging was conducted for all three PEGylated compounds. Tumor necrosis, microvessel density, and EGFR levels were evaluated by histopathology and enzyme-linked immunosorbent assay.
Results
Nineteen animal models were generated (two U138MG, three U87MG, 14 with both U138MG and U87MG bilateral masses). In static images, a slight increase in tracer uptake was observed in tumors, but in general, there was no retention of tracer uptake over time and no difference in uptake between U138MG and U87MG masses. In addition, no significant uptake was demonstrated in dynamic scans of the 18F-PEG tracer. No necrosis was present except in four animals. MVD was 9.6 and 48 microvessels/×400 field in the U138GM and U87GM masses, respectively (p = 0.00008). Similarly, the microvessel grades were generally higher in the U87GM group (p = 0.002). Total EGFR amount was higher in U87MG than U138MG masses (p = 0.001), but the ratio of activated (pY1068) to total EGFR did not differ (p = 0.95).
Conclusions
PEGylated tracers labeled with 11C, 124I, and 18F showed no significant difference in uptake between U138MG and U87MG glioblastoma xenograft mice. The tracer binding with EGFR could be influenced by activation of the tyrosine kinase portion of the receptor which was similar in U138MG and U87MG. Despite these results, these tracers should be investigated in animal models with mutant EGFR genes to determine whether aberrant receptor function plays a role in tumor uptake.
Key words: Epidermal growth factor receptor (EGFR), Small animal PET, Tyrosine kinase (TK) inhibitors
Introduction
The epidermal growth factor receptor tyrosine kinase (EGFR-TK) is currently considered one of the most interesting molecular targets for cancer therapy [1]. EGFR is differentially dysregulated, overexpressed, mutated, or amplified in many types of cancer, and this may be associated with more aggressive disease, therapy resistance, and shorter survival time [2–5]. Two major therapeutic strategies have been developed to inhibit EGFR pathways in cancer: monoclonal antibodies (Abs) that target the external binding domain (ligand binding domain) of the receptor or small molecular weight inhibitors that target the intracellular TK domain [6]. Some molecular markers for selecting patients who may benefit from these drugs and predict response to EGFR-targeted therapy are under investigation. Thus, an attempt to quantify EGFR in tumors in vivo has become one of the most pressing challenges in cancer research.
Different imaging approaches have been devised for EGFR detection, ranging from optical imaging modalities to single photon emission computed tomography and positron emission tomography (PET) technologies [7]. New PET probes, including labeled monoclonal Abs and small molecules such as TK inhibitors, have been developed and evaluated in the preclinical setting for EGFR visualization [8–25]. Although most of these TK inhibitor tracers showed promising and potential characteristics in vitro, none of them proved successful in the clinical setting. The main drawbacks of these EGFR PET agents stem from their rapid clearance from blood, moderate and nonspecific binding in tumors, and high accumulation in metabolic organs. To overcome these limitations, a newer generation of labeled irreversible EGFR inhibitors was developed [26, 27]. This group of compounds contains a polyethylene glycol (PEG) group at the 7-position of the quinazoline ring to increase solubility and decrease (logP) and a dimethylcrotonylamide at the 6-position to form covalent binding with the receptor. These compounds were labeled either with carbon-11 on the dimethylamine moiety (11C-1), fluorine-18 on the F-PEG moiety (18F-2), or iodine-124 at the anilino moiety (124I-3; Fig. 1). Herein, we report the micro-PET results of three of these compounds in tumor-bearing mice.
Fig. 1.
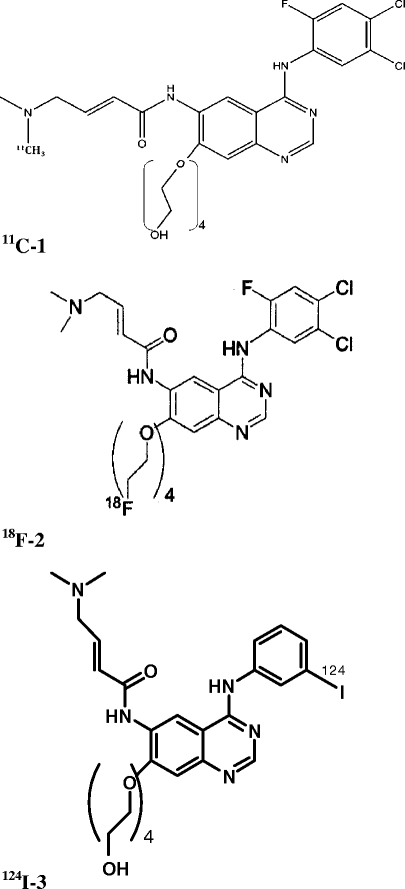
Chemical structure of the 11C-1, 18F-2, and 124I-3 compounds.
Materials and Methods
Cells
Two human glioblastoma cell lines were used: U138MG lacks EGFR (HER-1) expression, whereas U87MG.wtEGF-R (U87MG) was transfected with an overexpressing human wild-type EGFR gene [17]. Cells were routinely cultured in DMEM supplemented with 10% fetal bovine serum and were maintained at 37°C in a humidified 5% CO2 atmosphere. The U87MG cells were also routinely supplemented with G418 at a final concentration of 500 μg/ml. All medium constituents were purchased from Invitrogen, Milan, Italy.
Cytofluorometric Studies
Glioblastoma cell line phenotype was studied by means of indirect immunofluorescence and cytofluorometric analysis. The following primary mouse monoclonal antibodies were used: antihuman HER-1 (EGF-R) clone 528 (Oncogene Research Products, Uniondale, NY, USA), antihuman HER-2 clone MGR-3, and antihuman HER-3 clone SGP1 (NeoMarkers, Fremont, CA, USA). The secondary antibody was Alexa Fluor 488 F(ab’)2 fragment of goat antimouse IgG (Invitrogen, Milan, Italy). After the final washings, cells were resuspended in phosphate-buffered saline containing 1 μg/ml of ethidium bromide to gate out dead cells followed by cytofluorometric analysis with a FACScan (Becton Dickinson, St. Jose, CA, USA).
Mice
Athymic Crl:CD-1-Foxn1 nu/nu mice (here referred to as nude mice) were purchased from Charles River Italy and kept under sterile conditions. Experiments were authorized by the institutional review board of Bologna University and performed according to Italian and European guidelines.
U138MG and U87MG cells (3 × 10⁶ and 5 × 10⁶, respectively) were injected subcutaneously (s.c.) in the hind legs. Mice carrying a single tumor derived from a subcutaneous injection of each cell line or carrying both tumors (one on each side) were obtained. Tumor incidence and growth were evaluated weekly. Neoplastic masses were measured with calipers; tumor volume was calculated as π × [√(a × b)]3/6, where a = maximal tumor diameter and b = a tumor diameter perpendicular to a. Animals underwent PET imaging 5–6 or 10–15 days after cell injection. At sacrifice, tumor samples were mechanically and enzymatically dissociated using Trypsin–EDTA to obtain a single cell suspension for evaluation of EGFR expression by cytofluorometric analysis. Additional samples for histological determinations and biomolecular studies were fixed in 10% phosphate-buffered formalin or frozen in liquid nitrogen.
Chemistry
The labeled compounds were prepared according to recent publications [26, 27].
Imaging Protocol
The PET imaging procedure was as follows: Mice were anesthetized (Sevofluorane 3–5% and oxygen 1 l min−1) and injected with variable doses of tracers (ranging from 10 to 37 MBq according to the isotope half-life) with an insulin syringe via the tail vein. All animals were evaluated in a static mode. This approach was chosen since the primary aim of this work was to evaluate tracer uptake related to the EGFR expression. Two animals injected with 18F-2 underwent dynamic scans to evaluate whether an early tracer uptake and a later washout were present.
For static acquisitions (repeated several times after injection to monitor tracer distribution), animals were subsequently allowed to awaken and move freely for the uptake period. Finally, anesthesia was induced a second time before the animal was placed prone on the scanner bed of the small animal PET tomograph (GE, eXplore Vista DR). Imaging lasted at least 15 min per bed position.
For dynamic acquisitions, the animal was anesthetized, placed prone on the scanner bed, centered in the field of view, and then injected intravenously with the tracer. Simultaneously, the dynamic list mode acquisition was started. Image acquisition lasted for 30 min.
Since the axial field of view was only 4 cm, one bed position was not sufficient to cover the whole body. Therefore, a group of animals underwent at least one static whole body scan (two bed positions) to verify the whole body distribution of the tracer. For the remaining animals, images were acquired on tumor areas only. Once the scan had been completed, gas anesthesia was interrupted and the animal was placed in a warm recovery box.
The images were reconstructed with iterative reconstruction 2D OSEM, matrix 175 × 175. Due to the small size of the animals, we did not apply attenuation correction or scatter correction as they do not significantly influence semiquantitative PET analysis since the very high energy of the emitted photons (511 KeV) led to a very high rate of nonabsorbed photons. Using this system, the best attainable spatial resolution was 1.4 mm as described by Wang et al. in their performance evaluation [20]. According to this procedure, the image quality was satisfactory for all of the scans. Although the image quality could have been slightly improved especially by increasing the acquisition time, as in every nuclear medicine test, it was unnecessary since a prolonged acquisition time reduces the number of scanned animals per tracer synthesis.
For static acquisitions, a semiquantitative analysis was performed by calculating the tumor-to-background ratio (TBR) on the pelvic area of increased uptake. TBR was calculated as follows:
 |
The background ROI was drawn on the subcutaneous tissues. For dynamic acquisitions, a ROI was drawn on the tumor and a time/activity curve was generated. No correction for decay was applied.
124I-3
Eleven animals underwent PET imaging with 10 to 30 MBq of the iodinated tracer. Three animals also underwent a small animal CT whole body acquisition that was used for accurate localization of activity uptake detected by the micro-PET. Table 1 shows the animal population and the image acquisition features.
Table 1.
Image acquisition features for 124I-3
| Cell line | Uptake time | FOV | Static | Dynamic | Necrosis | |
|---|---|---|---|---|---|---|
| 1 | Control, no tumor | 60 min, 24 h, 48 h | WB | Yes | No | No |
| 2 | U138MG | 60 min, 4 h | WB | Yes | No | No |
| 3 | U138MG | 60 min, 5 h | WB | Yes | No | No |
| 4 | U87MG | 60 min, 24 h | WB | Yes | No | No |
| 5 | U87MG | 60 min, 5 h | WB | Yes | No | No |
| 6 | U87MG | 60 min, 4 h, 24 h, 48 h | WB | Yes | No | No |
| 7 | U87MG + U138MG | 20 min, 2 h, 5 h, 24 h, 48 h | WB | Yes | No | No |
| 8 | U87MG + U138MG | 60 min, 18 h, 39 h | Segm | Yes | No | No |
| 9 | U87MG + U138MG | 60 min, 18 h, 39 h | Segm | Yes | No | No |
| 10 | U87MG + U138MG | 24 h, 36 h | Segm | Yes | No | No |
| 11 | U87MG + U138MG | 60 min, 24 h, 36 h | Segm | Yes | No | No |
U138MG (EGFR−) cell line, U87MG (EGFR+) cell line, WB whole body acquisition, Segm segmental acquisition
18F-2
Six animals underwent PET imaging with approximately 37 MBq of the fluorinated tracers. Table 2 shows the animal population and the image acquisition features.
Table 2.
Image acquisition features for 18F-2
| Cell line | Uptake time ( min) | FOV | Static | Dynamic | Necrosis | |
|---|---|---|---|---|---|---|
| 1 | U87MG + U138MG | 5, 60, 150 | Segm | Yes | No | Yes |
| 2 | U87MG + U138MG | 5, 60, 150 | Segm | Yes | No | Yes |
| 3 | U87MG + U138MG | 5, 60, 150 | Segm | Yes | No | Yes |
| 4 | U87MG + U138MG | 5, 60, 150 | Segm | Yes | No | Yes |
| 5 | U87MG + U138MG | 60, 120 | Segm | Yes | Yes (30 min) | No |
| 6 | U87MG + U138MG | 60, 120 | Segm | Yes | Yes (30 min) | No |
U138MG (EGFR−) cell line, U87MG (EGFR+) cell line, WB whole body acquisition, Segm segmental acquisition
11C-1
Three animals underwent PET imaging with approximately 37 MBq of the carbon-11 tracer. Table 3 shows the animal population and the image acquisition features.
Table 3.
Image acquisition features for 11C-1
| Cell line | Uptake time (min) | FOV | Static | Dynamic | Necrosis | |
|---|---|---|---|---|---|---|
| 1 | U87MG + U138MG | 10 | Segm | Yes | No | No |
| 2 | U87MG + U138MG | 10 | Segm | Yes | No | No |
| 3 | U87MG + U138MG | 10 | Segm | Yes | No | No |
U138MG (EGFR−) cell line, U87MG (EGFR+) cell line, WB whole body acquisition, Segm segmental acquisition
Molecular and Pathological Analyses
After sacrifice, tumor necrosis, microvessel density (MVD) analysis, and total and activated (pY1068) EGFR quantification were evaluated. Immunostains were adopted to evaluate endothelial cells. Anti-CD31 antibody (Santa Cruz, CA, USA) at a 1:20 dilution was used. The sections underwent antigen retrieval in EDTA (pH = 6.0) in a microwave at 750 W (four cycles lasting 5 min each) and revealed by the alkaline phosphatase–anti-alkaline phosphatase technique. Two separate methods were used to estimate MVD. In the first method, visual microvessel grading, the slides were visually scanned at ×100, ×200, and × 400 magnification and semiquantitatively graded for the extent of CD31 staining. To ensure the accuracy of the grading method, each sample was reviewed by two observers. Morphologic analysis was performed carefully to ensure vessel specificity of the CD31-stained stroma considered for the analysis. Four different microvessel grades (MVG) were considered as previously described [28]: MVG 1, normal or slightly increased MVD; MVG 2, microvessels easy to detect and definitely increased in respect to normal; MVG 3, abundant microvessels; and MVG 4, strongly increased MVD. Nonneoplastic human nervous tissues were used as control reference. The second method, visual count, involved counting microvessels according to previously described methods [28, 29]. In performing this visual count, each of the slides was first scanned at ×100 magnification, and three areas with abundant microvessels were chosen and defined as “hot spots”. The number of microvessels in each of these hot spots was then determined at ×400 magnification. The final MVD number was determined by taking the average of the three separate visual counts. During counting, vessels in the tumor capsule were excluded. Areas of staining with no discrete breaks were counted as single vessels, and the presence of a lumen was not required.
The two-tailed Student T test was used to compare U87GM and U138GM mice. Differences were considered significant for p values < 0.05. Pearson’s correlation was used to compare MVD and MVG methods.
Total and activated (pY1068) EGFR quantification was performed using an enzyme-linked immunosorbent assay (ELISA). For protein extraction, frozen tissues were homogenized using lysis buffer (50 mM Tris, pH 7.4, 150 mM NaCl, 2 mM MgCl2, 1% Triton X-100, 10% glycerol, 2 mM EGTA, 1 mM DTT) containing protease inhibitors (10 mg ml−1 aprotinin and leupeptin, 5 mg ml−1 pepstatin, 1 mM phenylmethylsulfonyl fluoride) and phosphatase inhibitors (50 mM NaF, 10 mM Na4P2O7, 1 mM Na3VO4, 3 mM H2O2). Homogenates were centrifuged at 13,000×g for 15 min at 4°C, and supernatants were stored at −80°C until analysis. Total and activated EGFR concentrations were assessed using ELISA kits purchased from Biosource International Inc. (Camarillo, CA, USA). Relative activated (pY1068) EGFR was defined as pY1068/total EGFR.
Results
Animal Model Development
The human glioblastoma cell lines U138MG (lacking EGFR expression) and U87MG (transfected with an overexpressing human wild-type EGFR gene) were used to establish a subcutaneous xenograft tumor model in nude mice for the assessment of EGFR labeling with innovative PET bioprobes. Indirect immunofluorescence and cytofluorometric analyses were used to study the growth factor receptor expression profile of EGFR (HER-1) and HER/erbB family receptors HER-2 and HER-3 in U138MG and U87MG cells. As indicated by the cytofluorometric profile, U87MG cells in continuous culture showed EGFR overexpression on the cell surface, whereas U138MG cells were negative for EGFR membrane expression. Surface expression of HER-2 proteins was almost negative on both cell lines, while HER-3 was expressed only in the U138MG cell line. When the cell lines were grown as subcutaneous tumors in nude mice, the HER/erbB family receptor expression profile was similar to that seen when the cells were grown in continuous liquid culture. Most importantly, EGFR expression in U87MG xenografts remained very high, whereas U138MG xenografts remained completely negative for EGFR expression.
The xenograft tumor model was established by s.c. injection of 3 × 10⁶ U138MG or 5 × 10⁶ U87MG cells into the hind legs of nude mice. After subcutaneous injection, tumor growth became evident after a median latency time of 4 days for both cell lines. U138MG tumor growth was exponential whereas U87MG growth was very slow and sometimes indolent. However, no differences in tumor latency, incidence, or growth were seen in mice carrying one subcutaneous tumor or both (one on each hind leg). Tumor-bearing animals underwent PET analysis 5 to 6 days after cell injection when tumor dimensions were 0.161 ± 0.011 and 0.104 ± 0.004 cm3 for U138MG and U87MG, respectively (dimensions from one experiment representative of other similar experiments). PET analysis was also performed 10–15 days after cell injection when tumor dimensions were 3.368 ± 0.956 and 0.785 ± 0.309 cm3, respectively (dimensions from one experiment 14 days after cell injection representative of other similar experiments).
Tumor Uptake
The time elapsed between the injection of the tracers and image acquisition is listed in Tables 1, 2, 3, and 4. Table 4 shows the results of the static imaging procedures with the tumor-to-background ratio. Some tumors presented a slight increase in tracer uptake, but in general, there was no retention over time and no significant difference between U138MG and U87MG masses. Static acquisitions and dynamic scans with the tested tracers showed no statistically significant differences between tumor xenografts (Figs. 2, 3, and 4). Dynamic scans did not demonstrate any significant uptake of 18F-2 over time (Fig. 5).
Table 4.
Imaging results for all tested tracers
| Cell line | Tracer | Uptake time | TBR EGFr+ | TBR EGFr− | |
|---|---|---|---|---|---|
| 1 | Control | 124I-3 | 60 min, 24 h, 48 h | – | – |
| 2 | U138MG | 124I-3 | 60 min, 4 h | – | <1 |
| 3 | U138MG | 124I-3 | 60 min, 5 h | – | <1 |
| 4 | U87MG | 124I-3 | 60 min, 24 h | <1, <1 | – |
| 5 | U87MG | 124I-3 | 60 min, 5 h | <1, <1 | – |
| 6 | U87MG | 124I-3 | 60 min, 4 h, 24 h, 48 h | <1, <1, <1, <1 | – |
| 7 | U87MG + U138MG | 124I-3 | 20 min, 2 h, 5 h, 24 h, 48 h | <1, <1, <1, <1, <1 | <1, <1, <1, <1, <1 |
| 8 | U87MG + U138MG | 124I-3 | 60 min, 18 h, 39 h | <1, <1, <1 | <1, <1, <1 |
| 9 | U87MG + U138MG | 124I-3 | 60 min, 18 h, 39 h | <1, <1, <1 | <1, <1, <1 |
| 10 | U87MG + U138MG | 124I-3 | 24 h, 36 h | – | 2.1, 4 |
| 11 | U87MG + U138MG | 124I-3 | 60 min, 24 h, 36 h | –, 1.1, 4 | –, 2.7, 5.1 |
| 12 | U87MG + U138MG | 18F-2 | 5 min, 60 min, 150 min | <1, <1, 1.2 | <1, <1, 1 |
| 13 | U87MG + U138MG | 18F-2 | 5 min, 60 min, 150 min | <1, 1.5, 1.3 | <1, 1.5, 1.1 |
| 14 | U87MG + U138MG | 18F-2 | 5 min, 60 min, 150 min | 1.6, 1.6, <1 | 1.5, 1.5, <1 |
| 15 | U87MG + U138MG | 18F-2 | 5 min, 60 min, 150 min | 1.2, 1.6, 1 | <1, 1, 1.2 |
| 16 | U87MG + U138MG | 18F-2 | 60 min, 120 min | 1.1, 2.6 | 1.8, 2.4 |
| 17 | U87MG + U138MG | 18F-2 | 60 min, 120 min | 1.8, 1.4 | 2.8, 1.2 |
| 18 | U87MG + U138MG | 11C-1 | 10 min | 1.7 | 1.7 |
| 19 | U87MG + U138MG | 11C-1 | 10 min | 4.3 | 3.3 |
| 20 | U87MG + U138MG | 11C-1 | 10 min | 1.6 | 1.6 |
Ten out of 20 animals presented a tumor-to-background ratio of ≤1 in U138MG and U87MG masses (the tracer uptake was very limited and did not significantly differ from subcutaneous tissues). The remaining ten masses presented a tumor-to-background ratio ≥1 (some animals had an increasing uptake while others had a decreasing trend over time)
Fig. 2.
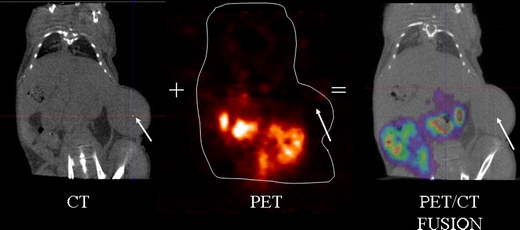
PET/CT images of an animal carrying a U87MG (EGFR+) tumor, 4 h after the tracer injection. The image fusion between the CT and the PET image shows no specific tracer uptake in the tumor of 18F-2.
Fig. 3.
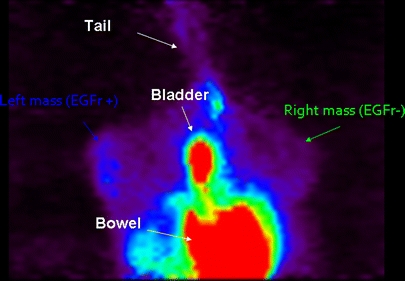
The segmental 11C-1 static acquisition image (10 min after the tracer injection) does not show any visual significant difference between U87MG (EGFR+) and U138MG (EGFR−) mass tracer uptake. TBR turned out to be 1.7 for both masses.
Fig. 4.
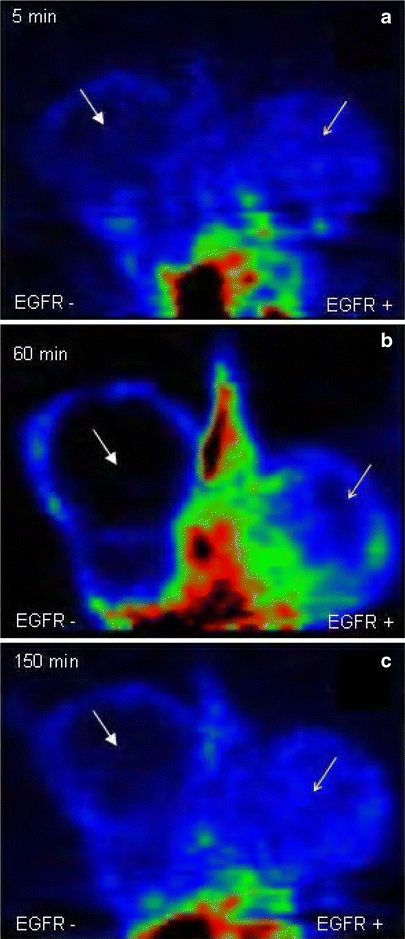
The segmental 18F-2 static acquisition image (5, 60, and 150 min after the tracer injection) does not show visual significant difference between U87MG (EGFR+) and U138MG (EGFR−) mass tracer uptake. The cold area indicated by the solid arrow in the U138MG EGFR− mass is related to necrosis.
Fig. 5.
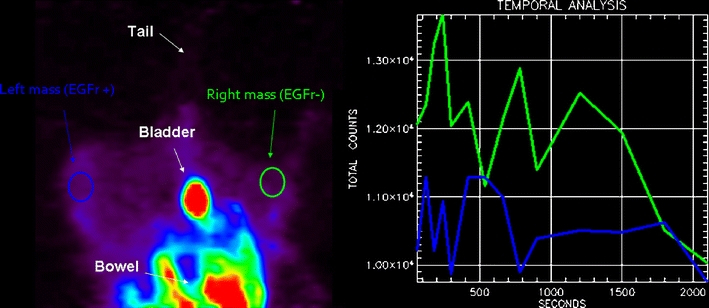
The segmental 18F-2 static acquisition image (60 min after the tracer injection) does not show any visual significant difference between U87MG (EGFR+) and U138MG (EGFR−) mass tracer uptake. TBR turned out to be <1 for both masses. The two time-activity curves do not reveal any specific uptake.
Molecular and Pathological Analyses
No necrosis was present except in four animals with bilateral tumors where it was found both in U87MG and U138MG masses because of high tumor size. Results from the two angiogenesis evaluation methods were absolutely comparable (Pearson correlation, r = 0.88). Moreover, there was a very high interobserver consensus with more than 95% agreement. Median MVD was 28.5 microvessels/×400 field (range 6–70.8) in tumor samples and six microvessels/×400 field (range, 4–6) in nonneoplastic tissues. When the two tumor xenografts were compared, mean MVD was 9.6 and 48 microvessels/×400 field in the U138GM and U87GM masses, respectively (p = 0.00008; Fig. 6). Similarly, the MVG scores were generally higher in the U87GM group (p = 0.002). Total EGFR amount was higher in U87MG than U138MG masses (p = 0.001), but the ratio of activated (pY1068) to total EGFR did not differ (p = 0.95; Fig. 7).
Fig. 6.
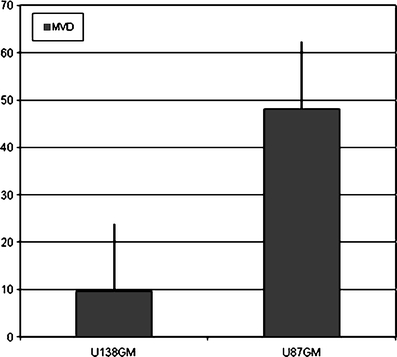
Micro vessel density evaluation in U87MG (EGFR+) and U138MG (EGFR−) masses.
Fig. 7.
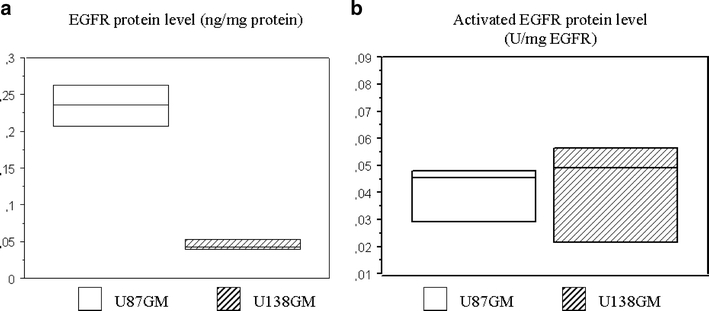
Total EGFR and ratio of activated (pY1068) EGFR protein level quantification by ELISA in U87MG (EGFR+) and U138MG (EGFR−) masses.
Discussion
The present study reports on the development of PEG-anilinoquinazoline derivatives labeled with 11C, 124I, and 18F as potential probes for in vivo imaging of EGFR in U138MG and U87MG glioblastoma xenograft mice using small animal PET. The most important chemical features of these PEGylated compounds were increased stability and solubility and decreased lipophilicity which together may increase specific tracer uptake in tumors. In vitro studies showed that these PEGylated derivative compounds had a high and irreversible potency to inhibit EGFR autophosphorylation [26, 27]. However, the in vivo imaging protocol of 11C-1, 18F-2, and 124I-3 showed only a slight increase in uptake in some tumors and no significant difference between U138MG and U87MG glioblastoma xenograft mice. The lack of specific tumor uptake of these tracers could be due to factors such as the target status in vivo, nonselective binding, and their metabolism in vivo.
The molecular quantification of total EGFR by ELISA differed between U138MG and U87MG tumor mass, but no significant differences were found when the ratio of activated/total EGFR was measured. Thus, tracer binding to EGFR could be influenced by the activation of the tyrosine kinase domain of the receptor which was similar in U138MG and U87MG.
Though nonselective binding of tracers to other proteins could reduce EGFR-specific uptake, this hypothesis is unlikely. A higher affinity and selectivity of 11C-1 and 18F-2 to EGFR compared to other tyrosine kinases (ERBB2, IGF1R, KIT, PDGFRA, PDFGRB, VEGFR1, VEGFR2, VEGFR3) has been described [26, 27]. The same results were obtained for 124I-3 (unpublished data; Table 5). However, these compounds may bind to targets other than tyrosine kinase receptors, thus influencing their uptake. Future genomic and proteomic studies of tumor masses and cell cultures could be designed to define the molecular background of these models. As U138MG and U87MG are known to have different proliferation and growth rates in mice, different molecular pathways may be up- and downregulated in vivo.
Table 5.
Affinity and selectivity studies of 124I-3 to EGFR
| EGF-R L858R | EGF-R T790M | EGF-R T790M/L858R | EGF-R wt | ERBB2 | IGF1-R | KIT | PDGFR-alpha | PDGFR-beta | TIE2 | VEGF-R1 | VEGF-R2 | VEGF-R3 | |||
|---|---|---|---|---|---|---|---|---|---|---|---|---|---|---|---|
| Compound ID | Plate ID | Well ID | IC50 (M) | IC50 (M) | IC50 (M) | IC50 (M) | IC50 (M) | IC50 (M) | IC50 (M) | IC50 (M) | IC50 (M) | IC50 (M) | IC50 (M) | IC50 (M) | IC50 (M) |
| Iodo-Peg(3) | 3854-HAD-02 | A2 | <3E−09 | 2.47E−08 | 4.66E−08 | <3E−09 | 8.28E−09 | >1E−04 | >1E−04 | 1.35E−05 | 6.34E−06 | 7.17E−06 | >1E−04 | 3.10E−06 | 1.07E−05 |
| Iodo-Peg(3) | 3854-HAD-02 | B2 | <3E−09 | 1.66E−08 | 4.24E−08 | <3E−09 | 3.42E−09 | >1E−04 | >1E−04 | 8.31E−06 | 5.29E−06 | 6.86E−06 | >1E−04 | 2.49E−06 | 6.96E−06 |
| Iodo-Peg(3) | 3854-HAD-02 | C2 | <3E−09 | 8.53E−09 | 1.92E−08 | <3E−09 | <3E−09 | >1E−04 | >1E−04 | 8.40E−06 | 4.58E−06 | 3.27E−06 | >1E−04 | 2.05E−06 | 5.18E−06 |
Tracer distribution in tumor masses should not have influenced the results since all animals had a small mass at the time of scan acquisition and no necrosis, except for four animals with large bilateral necrotic tumors. Moreover, MVD data showed that angiogenesis was more apparent in U87GM tumors, suggesting sufficient tracer access to tumor masses.
Although the results of the present study showed no specific tumor uptake in micro-PET images for 11C-1, 18F-2, and 124I-3, the promising in vitro characteristics of these compounds merit further investigation in other animal models. Cell lines characterized by both high receptor expression and activation are deemed ideal for in vivo imaging of EGFR tumors. Pal et al. reported the first in vitro and in vivo studies of a morpholino-124I-IPQA TK irreversible inhibitor with a chemical structure allowing covalent binding only to the ATP site of the phosphorylated EGFR-TK in xenograft mice with brain tumors expressing EGFRvIII mutant receptor [18]. Recently, Memon et al. reported a higher uptake of 11C-Iressa in HCC827 xenograft mice which overexpress a mutant EGFR harboring an in-frame deletion mutation in exon 19 that likely confers a constitutive activation to the receptor and erlotinib sensitivity compared with nonmutant A549 and NCI358 cell lines [24].
These new approaches are encouraging because they better reflect the current clinical scenario. In recent years, the importance of detecting EGFR “expression” as a predictive biomarker to discriminate between patients responding and not responding to anti-EGFR drugs has lost its significance for various reasons [30, 31]. It is well known that EGFR inhibitors have clinical activity irrespective of total EGFR quantity. For example, there is accumulating evidence of the value of EGFR mutations in lung cancer and of k-ras mutations in codons 12 and 13 in colorectal cancer as predictive markers of sensitivity to anti-EGFR treatment [31–33].
Thus, this approach should also be considered in molecular imaging research, with more attention paid to imaging receptor “function” which is influenced by mutations or an aberrant downstream signaling pathway [34]. A recent study identified distinct biological features underlying the various EGFR mutations in nonsmall-cell lung cancer (NSCLC) that may confer different transforming potential or TK activity and consequently different sensitivity to EGFR inhibitors [35]. Specific chemical structures of the tracers and animal models should be developed to improve the imaging of EGFR status in cancer. Developing PET probes for imaging membrane receptors may have more rationale in cases of receptor amplification, such as HER-2 in breast cancer.
A remaining question is: if molecular predictive markers are available in everyday practice, why still study EGFR imaging? In vivo detection of EGFR may overcome several limitations of tissue specimen analysis [36]. Firstly, the information yielded by analysis of small tissue specimens may not be representative of the whole tumor or all metastases. Secondly, biological changes may occur during the natural history of metastatic disease especially in long survival or heavily pretreated patients. Lastly, invasive, nonrepeatable, and time-consuming procedures are required for both patients and physicians. As a consequence, the in vivo and noninvasive detection of EGFR function with a repeatable approach during disease progression may still represent a major potential tool for many oncologists.
Conclusions
PEG-anilinoquinazoline tracers should be investigated in animal models with an aberrant receptor function such as EGFRvIII mutants and HCC827 NSCLC models. Moreover, novel chemical modifications are warranted to further improve binding with the ATP pocket of the mutated kinase domain underlying receptor activity. Lastly, it would also be interesting to use an imaging approach to identify changes related to the downstream signaling pathway of EGFR.
Acknowledgments
This work was funded by the Italian Ministry of University and Scientific Research (FIRB 2003 Project), Fondazione Cassa di Risparmio of Bologna (CARISBO), and the Italian Ministry of Health (Programma Integrato Oncologia).
Conflict of interest
The authors declare no conflict of interest.
Open Access
This article is distributed under the terms of the Creative Commons Attribution Noncommercial License which permits any noncommercial use, distribution, and reproduction in any medium, provided the original author(s) and source are credited.
References
- 1.Yarden Y. The EGFR family and its ligands in human cancer. Signalling mechanisms and therapeutic opportunities. Eur J Cancer. 2001;37(Suppl 4):S3–S8. doi: 10.1016/S0959-8049(01)00230-1. [DOI] [PubMed] [Google Scholar]
- 2.Baselga J. The EGFR as a target for anticancer therapy—focus on cetuximab. Eur J Cancer. 2001;37(Suppl 4):S16–S22. doi: 10.1016/S0959-8049(01)00233-7. [DOI] [PubMed] [Google Scholar]
- 3.Salomon DS, Brandt R, Ciardiello F, Normanno N. Epidermal growth factor-related peptides and their receptors in human malignancies. Critical Rev Oncol Hematol. 1995;19:183–232. doi: 10.1016/1040-8428(94)00144-I. [DOI] [PubMed] [Google Scholar]
- 4.Sharma SV, Bell DW, Settleman J, Haber DA. Epidermal growth factor receptor mutations in lung cancer. Nat Rev Cancer. 2007;7:169–181. doi: 10.1038/nrc2088. [DOI] [PubMed] [Google Scholar]
- 5.Nicholson RI, Gee JM, Harper ME. EGFR and cancer prognosis. Eur J Cancer. 2001;37(Suppl 4):S9–S15. doi: 10.1016/S0959-8049(01)00231-3. [DOI] [PubMed] [Google Scholar]
- 6.Ciardiello F, Tortora G. EGFR antagonists in cancer treatment. N Engl J Med. 2008;358:1160–1174. doi: 10.1056/NEJMra0707704. [DOI] [PubMed] [Google Scholar]
- 7.Cai W, Niu G, Chen X. Multimodality imaging of the HER-kinase axis in cancer. Eur J Nucl Med Mol Imaging. 2008;35:186–208. doi: 10.1007/s00259-007-0560-9. [DOI] [PubMed] [Google Scholar]
- 8.Mishani E, Abourbeh G. Cancer molecular imaging: radionuclide-based biomarkers of the epidermal growth factor receptor (EGFr) Curr Top Med Chem. 2007;7:1755–1772. doi: 10.2174/156802607782507457. [DOI] [PubMed] [Google Scholar]
- 9.Pantaleo MA, Nannini M, Maleddu A, et al. Experimental results and related clinical implications of PET detection of epidermal growth factor receptor (EGFr) in cancer. Ann Oncol. 2009;20:213–226. doi: 10.1093/annonc/mdn625. [DOI] [PubMed] [Google Scholar]
- 10.Fredriksson A, Johnström P, Thorell JO, et al. In vivo evaluation of the biodistribution of 11C-labeled PD153035 in rats without and with neuroblastoma implants. Life Sci. 1999;65:165–174. doi: 10.1016/S0024-3205(99)00233-7. [DOI] [PubMed] [Google Scholar]
- 11.Bonasera TA, Ortu G, Rozen Y, et al. Potential (18)F-labeled biomarkers for epidermal growth factor receptor tyrosine kinase. Nucl Med Biol. 2001;28:359–374. doi: 10.1016/S0969-8051(01)00200-1. [DOI] [PubMed] [Google Scholar]
- 12.Ben-David I, Rozen Y, Ortu G, Mishani E. Radiosynthesis of ML03, a novel positron emission tomography biomarker for targeting epidermal growth factor receptor via the labeling synthon: [11C]acryloyl chloride. Appl Radiat Isot. 2003;58:209–217. doi: 10.1016/S0969-8043(02)00301-9. [DOI] [PubMed] [Google Scholar]
- 13.Ortu G, Ben-David I, Rozen Y, et al. Labeled EGFr-TK irreversible inhibitor (ML03): in vitro and in vivo properties, potential as PET biomarker for cancer and feasibility as anticancer drug. Int J Cancer. 2002;101:360–370. doi: 10.1002/ijc.10619. [DOI] [PubMed] [Google Scholar]
- 14.Shaul M, Abourbeh G, Jacobson O, et al. Novel iodine-124 labeled EGFR inhibitors as potential PET agents for molecular imaging in cancer. Bioorg Med Chem. 2004;12:3421–3429. doi: 10.1016/j.bmc.2004.04.044. [DOI] [PubMed] [Google Scholar]
- 15.Mishani E, Abourbeh G, Rozen Y, et al. Novel carbon-11 labeled 4-dimethylamino-but-2-enoic acid [4-(phenylamino)-quinazoline-6-yl]-amides: potential PET bioprobes for molecular imaging of EGFR-positive tumors. Nucl Med Biol. 2004;31:469–476. doi: 10.1016/j.nucmedbio.2003.12.005. [DOI] [PubMed] [Google Scholar]
- 16.Mishani E, Abourbeh G, Jacobson O, et al. High-affinity epidermal growth factor receptor (EGFR) irreversible inhibitors with diminished chemical reactivities as positron emission tomography (PET)-imaging agent candidates of EGFR overexpressing tumors. J Med Chem. 2005;48:5337–5348. doi: 10.1021/jm0580196. [DOI] [PubMed] [Google Scholar]
- 17.Abourbeh G, Dissoki S, Jacobson O, et al. Evaluation of radiolabeled ML04, a putative irreversible inhibitor of epidermal growth factor receptor, as a bioprobe for PET imaging of EGFR-overexpressing tumors. Nucl Med Biol. 2007;34:55–70. doi: 10.1016/j.nucmedbio.2006.10.012. [DOI] [PubMed] [Google Scholar]
- 18.Pal A, Glekas A, Doubrovin M, et al. Molecular imaging of EGFR kinase activity in tumors with 124I-labeled small molecular tracer and positron emission tomography. Mol Imaging Biol. 2006;8:262–277. doi: 10.1007/s11307-006-0049-0. [DOI] [PubMed] [Google Scholar]
- 19.Wang JQ, Gao M, Miller KD, Sledge GW, Zheng QH (2006) Synthesis of 11C-Iressa as a new potential PET cancer imaging agent for epidermal growth factor receptor tyrosine kinase. Bioorg Med Chem 4102–4106 [DOI] [PubMed]
- 20.Wang M, Gao M, Mock BH, et al. Synthesis of carbon-11 labeled fluorinated 2-arylbenzothiazoles as novel potential PET cancer imaging agents. Bioorg Med Chem. 2006;14:8599–8607. doi: 10.1016/j.bmc.2006.08.026. [DOI] [PubMed] [Google Scholar]
- 21.Wang H, Yu J, Yang G, et al. Assessment of 11C-labeled-4-N-(3-bromoanilino)-6, 7-dimethoxyquinazoline as a positron emission tomography agent to monitor epidermal growth factor receptor expression. Cancer Sci. 2007;98:1413–1416. doi: 10.1111/j.1349-7006.2007.00562.x. [DOI] [PMC free article] [PubMed] [Google Scholar]
- 22.Wang H, Yu JM, Yang GR, et al. Further characterization of the epidermal growth factor receptor ligand 11C-PD153035. Chin Med J. 2007;120:960–964. [PubMed] [Google Scholar]
- 23.Su H, Seimbille Y, Ferl GZ, et al. Evaluation of [(18)F]gefitinib as a molecular imaging probe for the assessment of the epidermal growth factor receptor status in malignant tumors. Eur J Nucl Med Mol Imaging. 2008;35:1089–1099. doi: 10.1007/s00259-007-0636-6. [DOI] [PubMed] [Google Scholar]
- 24.Memon AA, Jakobsen S, Dagnaes-Hansen F, Sorensen BS, Keiding S, Nexo E. Positron emission tomography (PET) imaging with 11C-labeled erlotinib: a micro-PET study on mice with lung tumor xenografts. Cancer Res. 2009;69:873–878. doi: 10.1158/0008-5472.CAN-08-3118. [DOI] [PubMed] [Google Scholar]
- 25.Liu N, Li M, Li X, et al. PET-based biodistribution and radiation dosimetry of epidermal growth factor receptor- selective tracer 11C-labeled PD153035 in humans. J Nucl Med. 2009;50:303–308. doi: 10.2967/jnumed.108.056556. [DOI] [PubMed] [Google Scholar]
- 26.Dissoki S, Aviv Y, Laky D, Abourbeh G, Levitzki A, Mishani E. The effect of the [18F]-PEG group on tracer qualification of [4-(phenylamino)-quinazoline-6-YL]-amide moiety—an EGFR putative irreversible inhibitor. Appl Radiat Isot. 2007;65:1140–1151. doi: 10.1016/j.apradiso.2007.04.014. [DOI] [PubMed] [Google Scholar]
- 27.Dissoki S, Eshet R, Billauer H, Mishani E. Modified PEG-anilinoquinazoline derivatives as potential EGFR PET agents. J Label Compd Radiopharm. 2009;52:41–52. doi: 10.1002/jlcr.1569. [DOI] [Google Scholar]
- 28.Piccaluga PP, Visani G, Pileri SA, et al. Clinical efficacy and antiangiogenic activity of thalidomide in myelofibrosis with myeloid metaplasia. A pilot study. Leukemia. 2002;16:1609–1614. doi: 10.1038/sj.leu.2402596. [DOI] [PubMed] [Google Scholar]
- 29.Weidner N, Semple JP, Welch WR, Folkman J. Tumor angiogenesis and metastasis—correlation in invasive breast carcinoma. N Engl J Med. 1991;324:1–8. doi: 10.1056/NEJM199101033240101. [DOI] [PubMed] [Google Scholar]
- 30.Dei Tos AP. The biology of epidermal growth factor receptor and its value as a prognostic/predictive factor. Int J Biol Biomarkers. 2007;22:S3–S9. [PubMed] [Google Scholar]
- 31.Lynch TJ, Bell DW, Sordella R, et al. Activating mutations in the epidermal growth factor receptor underlying responsiveness of non-small-cell lung cancer to gefitinib. N Engl J Med. 2004;350:2129–2139. doi: 10.1056/NEJMoa040938. [DOI] [PubMed] [Google Scholar]
- 32.Paez JG, Jänne PA, Lee JC, et al. EGFR mutations in lung cancer: correlation with clinical response to gefitinib therapy. Science. 2004;304:1497–1500. doi: 10.1126/science.1099314. [DOI] [PubMed] [Google Scholar]
- 33.Allegra CJ, Jessup JM, Somerfield MR, et al. American Society of Clinical Oncology provisional clinical opinion: testing for KRAS gene mutations in patients with metastatic colorectal carcinoma to predict response to anti-epidermal growth factor receptor monoclonal antibody therapy. J Clin Oncol. 2009;27:2091–2096. doi: 10.1200/JCO.2009.21.9170. [DOI] [PubMed] [Google Scholar]
- 34.Pantaleo MA, Nannini M, Fanti S, Boschi S, Lollini P, Biasco G. Molecular imaging of EGFr: it’s time to go beyond the receptor expression. J Nucl Med. 2009;50:1195–1196. doi: 10.2967/jnumed.109.063909. [DOI] [PubMed] [Google Scholar]
- 35.Kancha RK, von Bubnoff N, Peschel C, Duyster J. Functional analysis of epidermal growth factor receptor (EGFR) mutations and potential implications for EGFR targeted therapy. Clin Cancer Res. 2009;15:460–467. doi: 10.1158/1078-0432.CCR-08-1757. [DOI] [PubMed] [Google Scholar]
- 36.Pantaleo MA, Fanti S, Nannini M, et al. What oncologists need and require from nuclear medicine. Eur J Nucl Med Mol Imaging. 2008;35:1761–1765. doi: 10.1007/s00259-008-0825-y. [DOI] [PubMed] [Google Scholar]