

Abstract
The study of inherited retinal diseases has advanced our knowledge of the cellular and molecular mechanisms involved in sensory neural signaling. Dysfunction of two specific sensory modalities, vision and proprioception, characterizes the phenotype of the rare, autosomal-recessive disorder posterior column ataxia and retinitis pigmentosa (PCARP). Using targeted DNA capture and high-throughput sequencing, we analyzed the entire 4.2 Mb candidate sequence on chromosome 1q32 to find the gene mutated in PCARP in a single family. Employing comprehensive bioinformatic analysis and filtering, we identified a single-nucleotide coding variant in the feline leukemia virus subgroup C cellular receptor 1 (FLVCR1), a gene encoding a heme-transporter protein. Sanger sequencing confirmed the FLVCR1 mutation in this family and identified different homozygous missense mutations located within the protein's transmembrane channel segment in two other unrelated families with PCARP. To determine whether the selective pathologic features of PCARP correlated with FLVCR1 expression, we examined wild-type mouse Flvcr1 mRNA levels in the posterior column of the spinal cord and the retina via quantitative real-time reverse-transcriptase PCR. The Flvcr1 mRNA levels were most abundant in the retina, followed by the posterior column of the spinal cord and other brain regions. These results suggest that aberrant FLVCR1 causes a selective degeneration of a subpopulation of neurons in the retina and the posterior columns of the spinal cord via dysregulation of heme or iron homeostasis. This finding broadens the molecular basis of sensory neural signaling to include common mechanisms that involve proprioception and vision.
Introduction
In 1997, Higgins et al.1 described a childhood-onset, autosomal-recessive, neurodegenerative syndrome with the clinical features of sensory ataxia and retinitis pigmentosa (posterior column ataxia and retinitis pigmentosa [PCARP]) (associated with the AXPC1 locus [MIM 609033]). PCARP begins in infancy with areflexia and retinitis pigmentosa (RP). Nyctalopia (night blindness) and peripheral visual-field loss is usually evident during late childhood or teenage years, with subsequent progressive constriction of the visual fields and loss of central retinal function over time. A sensory ataxia caused by degeneration of the posterior columns of the spinal cord results in a loss of proprioceptive sensation that is clinically evident in the second decade of life and gradually progresses. Scoliosis, camptodactyly, achalasia, gastrointestinal dysmotility, and a sensory peripheral neuropathy are variable features of the disease. Affected individuals have no clinical or radiological evidence of cerebral or cerebellar involvement but may demonstrate hyperintense signals in the posterior aspect of the spinal cord on inversion recovery MRI.1,2 Neurophysiologic and histological evidence defines PCARP as a sensory ganglionopathy causing a harmonious degeneration of central and peripheral axons without evidence of primary demyelination.1,3–5
Isolated, inherited, posterior column ataxia (MIM 176250) has been described in three families, but RP6 was not a clinical feature.7,8 The index family was identified in 1939 by Mollaret and reported in 1951 by Biemond.7 The cardinal clinical features were areflexia, proprioceptive loss, and postmortem evidence of posterior column degeneration. Later, Singh et al.8 described another family with posterior column ataxia but reported the additional features of scoliosis and a peripheral demyelinating neuropathy. Recently, an autosomal-dominant form of sensory ataxia (MIM 608984) was described in a third family of Anglo-Saxon ancestry living in Eastern Canada.9 The phenotype, linked to chromosome 8p12-8q12, begins with a mild sensory ataxia with moderate to severe pyramidal weakness. Neuroimaging of the brain and spinal cord and nerve conduction velocities were normal. In contrast to PCARP, the disorder affects the preganglion sensory nerve fibers and corticospinal tracts rather than the posterior columns of the spinal cord. Some of the recessively inherited spinocerebellar ataxias are associated with RP,10 but the presence of cerebellar signs, sensorineural hearing loss, and involvement of pain and temperature sensory modalities distinguish these individuals from those with PCARP.
Screening for gene mutations at the AXPC1 locus on the basis of the known or putative function of their proteins (candidate gene approach) failed to identify genes mutated in PCARP. In the current study, we performed targeted DNA capture and high-throughput sequencing of the entire 4.2 Mb AXPC1 locus and found a mutation in the feline leukemia virus subgroup C cellular receptor 1 gene (FLVCR1 [MIM 609144]). Subsequent Sanger-sequencing analyses identified FLVCR1 mutations in unrelated Spanish and French Canadian families with PCARP. The study illustrates an approach that capitalizes on the power and the broad applicability of resequencing technology to find the causes of rare Mendelian disorders such as PCARP.
Subjects and Methods
Human- and Animal-Research Approvals
Subjects were enrolled into research protocols approved by the National Institute of Neurological Disorders and Stroke of the US National Institutes of Health, the New York State Department of Health, the Centre de Recherche du Centre Hospitalier de l'Université de Montréal, and the Oregon Health & Science University institutional review boards. Informed consent was obtained from all human research subjects. The Weill Cornell Medical College Institutional Animal Care and Use Committees approved the mouse work.
Clinical Evaluations
Detailed neurological and ophthalmic examinations were performed in individuals belonging to families with PCARP. For some individuals, additional clinical tests included brain and spinal cord MRI, electromyography, nerve conduction velocities, sural nerve biopsies, fundus photography, electroretinograms, and visual-field measurements.
Linkage Analysis
Linkage analysis was reported previously for the American (Figure 1) and Spanish (Figure 2) families.2,3 Samples from the French Canadian family (Figure 3) were genotyped with the Human 50K SNP Array (Affymetrix, CA, USA) via methods described by the manufacturer. A microsatellite genome-wide scan (deCODE Genetics, Iceland) was performed with the use of 500 polymorphic loci spaced at an average of 8 cM intervals. The PCARP phenotype was analyzed as an autosomal-recessive trait with 100% penetrance, a disease-gene frequency of 0.001, and no phenocopies. Haplotypes were reconstructed in a single section via the maximum-probability method of Genehunter v.2.1
Figure 1.
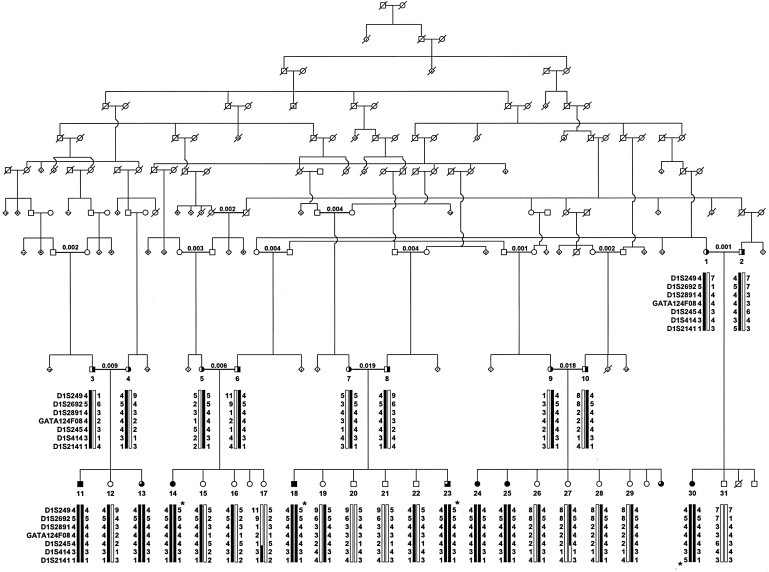
An Abridged Pedigree of an American Family with Recessively Inherited PCARP
A genome scan established linkage between PCARP and loci on chromosome 1q (AXPC1). To the left of each individual in each generation are seven chromosome 1q loci. Below each individual are reconstructed haplotypes for these loci. A star indicates a lack of homozygosity in affected individuals 14, 18, and 23 for locus D1S249 and in individual 30 for locus D1S2141. Consanguineous marriages have calculated inbreeding coefficients over the bar uniting individuals. Black circles (females) and squares represent affected individuals with PCARP (n = 6). Three-quarters shading represents infants with areflexia and early retinal dystrophy (n = 3). Obligate heterozygotes are represented by symbols that are half shaded (n = 10). Dark bars show parental haplotypes that segregate with PCARP. The figure is reprinted with permission from Lippincott Williams & Wilkins.2
Figure 2.
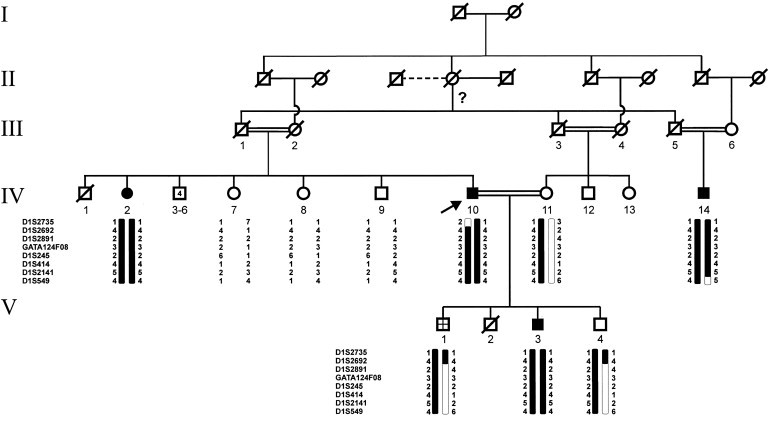
Pedigree of a Spanish Family with PCARP
Fine mapping of the AXPC1 candidate interval in a Spanish family with PCARP refined the candidate region to 8.1 Mb by a recombination at D1S2735 in individual IV-10. The symbols are the same as in Figure 1 except that the crosshatched symbol represents an unknown affection status and consanguineous marriages have double bars uniting individuals. An arrow points to the proband. The question mark indicates that paternity could not be determined. The figure is reprinted with permission from John Wiley and Sons.3
Figure 3.
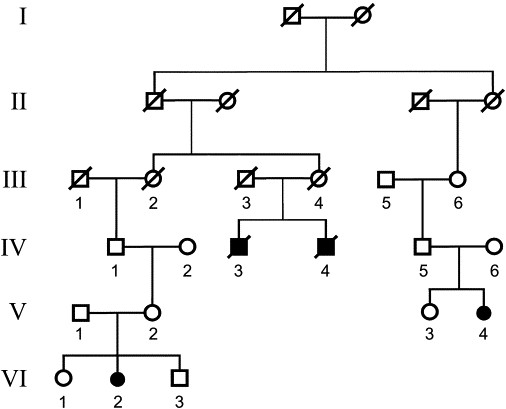
Pedigree of a French Canadian Family with PCARP
The pedigree is from a family with four members affected with PCARP, whose founders emigrated from a region near Bidart, France in the late 18th century to the Gaspésie region of eastern Quebec, Canada. Affected individuals IV-3, V-4, and VI-2 shared a common homozygous SNP haplotype in the AXPC1 region between rs643930 and rs1434889. The haplotype is different from the American and Spanish families. The symbols are the same as those in Figure 2.
DNA Capture Assay Design
Genomic coordinates 500 bp upstream and downstream of the SNP recombinants, rs10494961 and rs9308430, on chromosome 1 (corresponding to nucleotides [nt] 207,321,732-211,485,431 of the March 2006 National Center for Biotechnology Information [NCBI] build 36.1 of the Human Genome Assembly 18 [hg18]) were uploaded to the Agilent eArray website (Agilent Technologies, CA, USA). The following parameters were chosen: capture-probe length = 120 bp, capture-probe tiling frequency = 2×, avoid overlap regions = 20 bp, and avoid standard repeat masked regions. Probes for both forward and reverse strands were included. In total, 57,628 probes were designed, covering 92% of the nucleotides in RefSeq exons. Probe sequences were synthesized, amplified, and conjugated with biotin as previously described.11
Genomic DNA-Fragment Library
Genomic DNA was extracted from human peripheral-blood lymphocytes via the Puregene DNA Purification Kit (Gentra Systems, MN, USA). Genomic DNA-fragment libraries were prepared as described by the manufacturer (Illumina, CA, USA). Five micrograms of each genomic DNA sample were fragmented to less than 800 bp via nebulization. The overhangs resulting from fragmentation were converted into blunt ends with the use of T4 DNA polymerase and E. coli DNA polymerase I Klenow fragment. Illumina single-end adapters were ligated to the ends of the DNA fragments. Ligation products were purified on a 2% agarose gel. Ten PCR cycles were performed with primers that anneal to the ends of the adapters. The purified PCR-amplified fragment libraries were quantified with the use of the PicoGreen dsDNA Quantitation Assay with the Qubit Fluorometer (Invitrogen, CA, USA). The size range was validated on the Agilent Technologies 2100 Bioanalyzer with the DNA 1000 Kit.
Target Enrichment System Capture Process
Size-selected libraries were denatured at 95°C for 5 min and then incubated with SureSelect (Agilent Technologies) Biotinylated RNA library (“baits”) for 24 hr at 65°C. RNA bait-DNA hybrids were incubated with streptavidin-labeled Dynal (Invitrogen) magnetic beads and captured onto a strong magnet. After the beads were washed, the RNA bait was digested until the remaining nucleotide was the targeted DNA of interest. The PCR product was purified by the Qiaquick PCR Purification Kit after 14 cycles of PCR amplification. The targeted sample was quantified by the PicoGreen assay in preparation for sequencing.
High-Throughput Sequencing
The protocols for the Illumina Single-Read Cluster Generation Kit were used for cluster generation on the Cluster Station. With the exception of preparing reagents and template DNA, all cluster-generation steps were performed on the Cluster Station. The targeted samples were diluted to 10 nmol and denatured with sodium hydroxide. Ten picomoles of each target-enriched sample and Phix control were loaded into separate lanes of the same flow cell, hybridized onto the flow cell, and isothermally amplified. After linearization, blocking, and primer hybridization, sequencing was performed for 40 cycles on the Illumina 36 Cycle Sequencing Kit version 4 with version 7.0 sequencing recipes. Raw image data were converted into base calls via the Illumina pipeline version 1.6 with default parameters. Rigorous quality control was performed with the use of data from reports generated by the Illumina pipeline.
Mapping, Coverage Uniformity, and SNV and Indel Detection
All 40-bp-long reads were mapped to the reference human genome sequence, hg18. Only reads mapping to a single location in the genome were retained. Clonal reads (i.e., reads mapping at the same genomic position and on the same strand) were collapsed into a single read as described previously.12 Single-nucleotide variant (SNV) detection was performed via the following approach: For each nucleotide in the 4.2 Mb region, we calculated the number of overlapping reads and determined which of these reads showed a mismatch at that position compared to hg18. Only positions with at least four overlapping reads were further considered. Assuming that the large majority of mismatches between the reads and hg18 are due to sequencing errors, we determined the probability of observing a given number of mismatches at a given genomic position by chance, given the overall error rate of the experiment. Assuming that mismatch counts follow a binomial distribution, this probability is calculated by:
where n represents the total number of reads overlapping with the considered position, k represents the number of these reads that contain a mismatch at that genomic position, and p is the overall mismatch rate in the entire set of aligned reads. These probabilities were adjusted for multiple-hypotheses testing via the Benjamini-Hochberg approach, and a false discovery rate of 1% was used for SNV calling. Short insertions and deletions (indels) were detected with a similar approach: For each nucleotide in the 4.2 Mb region, we calculated the number of overlapping reads and determined which of these reads showed a deletion or an insertion of the same bp length at that position, compared to hg18 (insertions and deletions were detected separately). The error model we used to calculate p values and the correction for multiple testing were the same as those used for SNVs. Variant calls were compared between samples with homozygous affected (HA), heterozygous (HET), and homozygous unaffected (HU) haplotypes. Specifically, we searched for SNVs and indels that met the following criteria: (1) present in both HA individuals in ≥ 70% of the reads (consistent with homozygous genetic variants); (2) present in both HET individuals at a lower abundance, between 30% and 70% of the reads (consistent with heterozygous genetic variants); and 3) not statistically detectable in both HU individuals with the use of the error model described above. All SNVs and indels present in the dbSNP (release 130) and in the 1000 Genomes SNP database (March 2010 release; no indels were present in that release) were filtered out. Custom computer programs and RefSeq annotation downloaded from the UCSC Genome Browser database were used to classify the remaining SNVs as missense, nonsense, 5′-untranslated region (UTR), 3′-UTR, promoter, or intronic. Indels were similarly annotated as placental mammal PhastCons conservation scores for the hg18 nucleotides corresponding to each variant in the UCSC Genome Browser annotation database.
Sanger Sequencing
Intronic oligonucleotide primers that flanked the splice sites of each FLVCR1 (NM_014053.2) coding region were used to amplify its ten exons. The primer sequences and their positions on chromosome 1 (NC_000001.10) are listed in Table S1, available online. The PCR reactions contained 100 ng of genomic DNA in a total volume of 25 μl with a final concentration of 0.8 μmol of each primer, 0.25 mM of each dNTP, 10 mM Tris HCl (pH = 9.0), 50 mM KCl, 1.5 mM MgCl2, and 0.1 U of Taq polymerase (New England Biolabs, MA, USA). The reactions were performed in a 96-well microtiter plate on a Genius thermocycler (Techne, NJ, USA). Amplification was carried out with an initial denaturation step of 3 min at 96°C followed by 35 cycles of denaturation for 30 s at 96°C, 15 s of annealing at 60°C, and 30 s of extension at 72°C. Samples were purified with ExoSAP-IT (USB, OH, USA) and Sanger sequenced by standard methods (Genewiz, NJ, USA).
qPCR in Selected Mouse Brain Regions, Spinal Cord, and Retina
Five C57BL/6 mice (Jackson Laboratories, ME, USA) were euthanized at postnatal day 60. Deep-tissue punches of coronal brain sections were processed by methods described previously.13 Eyes were removed, and the retina was dissected immediately and frozen on dry ice before RNA extraction. Mice were skinned, eviscerated, and further dissected in 1.0 molar PBS at room temperature in a SLYGARD-coated dissection dish (Dow Corning, MI, USA). After ventral laminectomy, the spinal cord was isolated and segmented in 4 mm slices for the inclusion of coronal segments from the thoracic and lumbar regions. Segments were embedded in 4% low-melting agarose, and the dorsal horns, including the dorsal columns, were isolated with a 22.5° stab knife. Total RNA was extracted from all samples with the RNeasy Lipid Tissue Mini Kit (QIAGEN, Germany). Two micrograms of RNA were reverse transcribed to cDNA with the high-capacity RNA-to-cDNA kit (Applied Biosystems, CA, USA). Quantitative real-time reverse-transcriptase PCR (qPCR) experiments were performed on an ABI PRISM 7000 Sequence Detection System with the use of SYBR Green PCR Master Mix (Applied Biosystems) as described previously.13,14 Flvcr1 (also known as Mfsd7b)-specific primers (QIAGEN), amplifying a 115 bp product spanning exons 7 and 8 (NM_001081259.1), were used in the reactions. Primer-amplification efficiency and product specificity were confirmed by methods described previously.15 Flvcr1 mRNA amplification was performed for 50 cycles (95°C for 15 s, 60°C for 30 s, 72°C for 30 s, extension time 72°C for 10 min). The housekeeping gene, β-actin (NM_007393.3) (forward primer 5′-GAAATCGTGCGTGACATCAAAG-3′, nt 698–719; reverse primer 5′-TGTAGTTTCATGGATGCCACAG-3′, nt 892–913), was used for normalization. The ΔCT method was used to assess the relative expression levels of Flvcr1 as described previously.15 The differences in the mean mRNA levels (n = 5) for each anatomical region were compared by the Student's t test.
Results
Homozygosity Mapping and Linkage Analyses
The availability of extensive, accurate genealogical information from an isolated, inbred, sectarian population of Swiss German descent within the continental United States permitted genetic analyses on a complex American pedigree with nine affected individuals with PCARP (Figure 1).1,2 Through a genome-wide scan of polymorphic markers, the PCARP disease locus (AXPC1) in this American family was mapped to a 9.0 Mb region on chromosome 1q31-q32.2 Genetic-linkage studies in an unrelated Spanish family with PCARP refined the AXPC1 candidate region to 8.1 Mb (Figure 2).3 Further genetic mapping in these two families with the use of the Human 50K SNP Array (Affymetrix) delimited AXPC1 to a 4.2 Mb interval between SNPs rs10494961 and rs9308430. A genome-wide scan linked the French Canadian family (Figure 3) to the AXPC1 locus with a LOD score of 3.0 on chromosome 1q32.2-q41. A recombinant present in individual VI-2 delimited a candidate interval of 6.7 Mb between loci D1S2692 and D1S237. SNP homozygosity mapping delimited an interval of 5.3 Mb between SNPs rs643930 and rs1434889 on chromosome 1q32.2-q32.3 (data not shown) but did not refine the minimal critical region (MCR). Sanger sequencing of 25 of the 53 transcripts or genes in the 4.2 Mb MCR, selected on the basis of known or putative gene function in this candidate region, failed to reveal disease-causing mutations.
High-Throughput Resequencing
Recognizing that a more comprehensive, unbiased approach to identifying the genes mutated in PCARP was needed, we used targeted DNA capture and high-throughput sequencing to resequence the 4.2 Mb AXPC1 interval in six individuals from the aforementioned American family (Figure 1). The subjects included were two affected individuals with an HA haplotype (individuals 11 and 25), two unaffected patients with an HET haplotype (individuals 3 and 9), and two unaffected subjects with an HU haplotype (individuals 21 and 31). Lymphocyte genomic DNA from these individuals was captured via a commercial hybridization-based approach (see Subjects and Methods), and the captured products were sequenced by Ilumina GAIIx single-end sequencing with the use of one GAIIx lane per sample. The resulting 40-bp-long reads were aligned to hg18 via BWA.16 Only unambiguously mappable reads were retained. The total number of these reads ranged from 26 to 29 million per sample. The capture efficiency was high; between 44% and 87% of all mapped reads mapped to the captured AXPC1 region. The average sequencing coverage in the captured region was high for all samples, ranging from 112× to 231× (before clonal read collapse). SNVs were then detected as described in Subjects and Methods. The SNVs present in both HA samples with a high allelic abundance (i.e., consistent with a homozygous variant) were first identified and matched with lower-abundance variants present in both HET samples (i.e., consistent with a heterozygous variant). The subset of these variants that were absent or present at a nonsignificant level in both HU samples was then determined. This resulted in the identification of 540 SNVs. Only 48 of these variants were not common, known polymorphisms in dbSNP release 130. Further filtering with the use of the 1000 Genome database left nine of these 48 variants within the AXPC1 locus (Table 1). Only one variant, located at chromosome 1 position 211,098,778 (hg18), overlapped with a known exon (Figure S1). The SNV, an A-to-G transition at position 361 (c.361A>G) of the coding sequence of FLVCR1, predicted an asparagine-to-aspartic-acid substitution (p.Asn121Asp). Alignment of the human FLVCR1 sequence with its orthologs showed that this asparagine residue is highly conserved (Figure 4). The other eight variants were within intergenic or intronic regions, more than 2 kb away from known exons, and had low PhastCons conservation scores, indicating that they were unlikely to disrupt functional regulatory elements. We performed a similar analysis for short indels and detected three candidate short indels; however, all three indels were in intergenic regions or in long introns (Table S2).
Table 1.
Identification of a Gene Mutated in PCARP by Resequencing of the 4.2 Mb AXPC1 Locus
|
Samplesb |
|||||||||
|---|---|---|---|---|---|---|---|---|---|
|
25 HA |
11 HA |
3 HET |
9 HET |
31 HU |
21 HU |
||||
| Nucleotidea | Reads with Variant / Total Reads | SNV | Location | Conservationc | |||||
| 207,488,200 | 35/35 | 11/11 | 4/8 | 8/25 | 1/16 | 1/22 | C>T | intergenic | −0.989 |
| 210,852,233 | 69/69 | 25/25 | 5/12 | 20/49 | 1/30 | 0/28 | G>T | intron 1, ATF3 | 0.962 |
| 210,466,429 | 66/66 | 31/31 | 14/22 | 24/62 | 3/44 | 0/36 | C>T | intergenic | 0.517 |
| 208,525,955 | 17/17 | 15/15 | 8/13 | 9/15 | 1/12 | 0/16 | T>G | intergenic | −2.731 |
| 210,458,101 | 39/39 | 19/19 | 6/10 | 19/39 | 2/30 | 0/27 | C>A | intergenic | 0.875 |
| 209,124,254 | 47/47 | 24/24 | 8/20 | 18/44 | 1/35 | 0/40 | C>G | intron 7, KCNH1 | −0.536 |
| 211,098,778 | 47/47 | 18/18 | 6/13 | 18/51 | 1/35 | 0/40 | A>Gd | CDS, FLVCR1 | 0.373 |
| 208,426,496 | 65/65 | 31/31 | 7/14 | 20/42 | 0/33 | 0/42 | A>G | intergenic | −0.628 |
| 209,113,813 | 55/55 | 32/32 | 4/10 | 16/40 | 0/23 | 0/29 | C>G | intron 7, KCNH1 | −0.377 |
Abbreviations are as follows: CDS, coding sequence; HA, homozygous affected; HET, heterozygous; HU, homozygous unaffected; SNV, single nucleotide variant.
The nucleotide position is according to the chromosome 1 NCBI36/hg18 assembly. Genomic coordinates are 0-based.
Sample numbers correspond to individuals shown in Figure 1. The haplotype and affection status are as follows: Samples 25 and 11, homozygous affected; samples 3 and 9, heterozygous; samples 31 and 21, homozygous unaffected.
Conservation score based on multiple genome alignment data calculated by the PhastCons program.
The SNV read-stack raw data is found in Figure S5.
Figure 4.
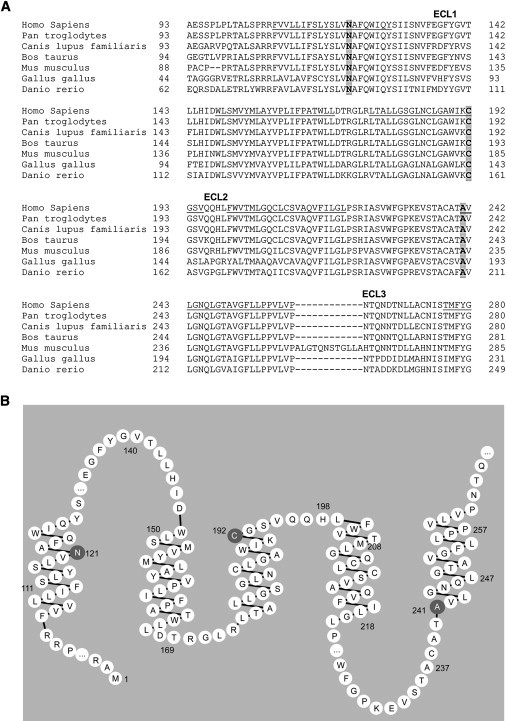
Mutated FLVCR1 Amino Acid Residues in PCARP
(A) Evolutionary conservation of FLVCR1 mutated residues and surrounding amino acids. FLVCR1 encodes a cell-surface protein predicted to contain 555 amino acids, 12 transmembrane-spanning segments (TM1–TM5 and part of TM6 are underlined), and six extracellular loops (ECL 1–3 are shown). The amino acid residues mutated in PCARP (p.Asn121Asp, p.Cys192Arg, and p.Ala241Thr), shown in gray and bold, are all are located in transmembrane segments. Homo sapiens, man; Pan troglodytes, chimpanzee; Canis lupus familiaris, dog; Bos taurus, domestic cow; Mus musculus, house mouse; Gallus gallus, chicken; Danio rerio, zebrafish.
(B) Partial FLVCR structure based on UniProt Knowledgebase predictions showing the location of the mutated residues within the transmembrane segments.
Sanger Sequencing
Sanger sequencing validated the FLVCR1 c.361A>G homozygous mutation, which was found to segregate uniquely in all affected individuals of the American family with PCARP (Figures 5A and 5B). Sanger sequencing of FLVCR1 in affected individuals in the Spanish family with PCARP (Figure 2) identified a homozygous base pair substitution in exon 1 (c.721G>A) causing an alanine-to-threonine amino acid change in a highly conserved region (p.Ala241Thr) (Figures 5C and 5D). Affected individuals in a French Canadian family (Figure 3) also harbored a homozygous sequence variant in exon 1 (c.574T>C) resulting in a cysteine-to-arginine substitution in a highly conserved region (p.Cys192Arg) (Figures 5E and 5F). The sequence variants were found to segregate with disease in both the Spanish and French Canadian families. All three identified mutations occurred within the transmembrane-spanning (TMS) segments 1, 3, and 5 of the FLVCR1 transporter channel (Figure 4).17,18 Sanger sequencing of FLVCR1 in two families from Western Europe (Figure 6) with a phenotype in keeping with PCARP failed to identify any mutations, suggesting that PCARP may be genetically heterogeneous, as is the case in the vast majority of inherited retinal disorders. All mutations identified by Sanger sequencing were not found in the dbSNP release 130, 1000 Genomes, or HapMap databases as known polymorphisms.
Figure 5.
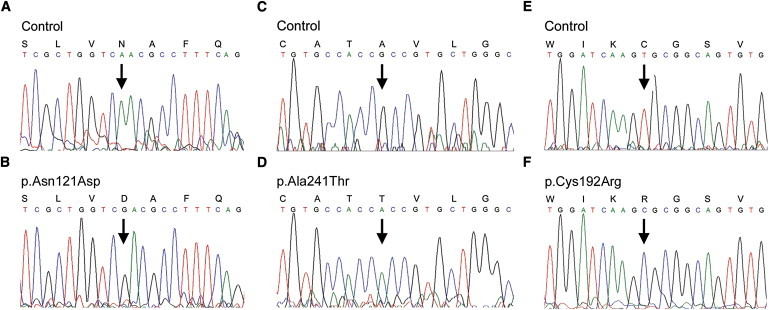
Electropherograms of the three FLVCR1 missense mutations in families with PCARP
(A and B) Sanger sequencing confirms the homozygous c.361A>G (p.Asn121Asp) mutation in the American family.
(C–F) Sanger sequencing of FLVCR1 shows a homozygous c.721G>A (p.Ala241Thr) mutation in a Spanish family (C and D) and a homozygous c.574T>C (p.Cys192Arg) mutation in a French Canadian family (E and F). The arrows indicate the base pair substitution. The amino acid symbols are above the codon.
Figure 6.
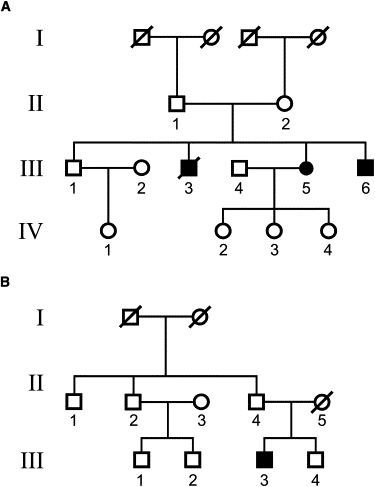
Two Unrelated Western European Pedigrees with a PCARP-like Phenotype and a Lack of FLVCR1 Mutations
(A) Three affected siblings (two males and one female) and (B) a single affected male in two families from Western Europe with PCARP. The symbols are the same as those in Figure 2.
Clinical Evaluations of Families with PCARP
A summary of the clinical features in the American, Spanish, and French Canadian families with PCARP and FLVCR1 mutations is found in Table 2. Several privately published genealogy books were analyzed to reconstruct the American pedigree with the FLVCR1 homozygous missense mutation, c.361A>G (p.Asn121Asp), that segregates with the PCARP phenotype (Figure 1). The founder was born in Switzerland in 1681 and moved to the Netherlands when he was 17 years old. He immigrated to colonial America in 1708. The large kindred spans ten generations and has 3338 family members in the unabridged genealogical tree. Affected individuals had the childhood onset of RP accompanied by a ring scotoma, a progressive loss of vision, proprioception, and generalized areflexia. The cardinal feature of the movement disorder was a sensory ataxia characterized by a loss of position sensation, apallesthesia, and a lack of cerebellar signs. Cognitive deficits or other significant motor or sensory signs were absent in affected individuals. Two infants, at ages 6 months and 1 year (Figure 1; individuals 13 and 23), had increased pigmentation in the periphery of the retina and absent deep tendon reflexes at the ankle and knee. The ophthalmoscopic examination, deep tendon reflexes, and other neurological signs were normal in all of the unaffected individuals. Peripheral “bone spicula” pigmentation with macular sparing characterized the fundoscopic pattern of the retinal dystrophy in affected individuals (Figure 7A). An MRI scan of the spinal cord showed evidence of posterior column degeneration in an affected individual (individual 30; Figure 1) at age 39 (Figure 7B).
Table 2.
Clinical Characteristics of Patients with Mutations in FLCVR1
| Individual (Pedigree) (FLVCR1 Mutation) | Age (yr) | Initial Eye Findings (Age) | Initial Neurological Signs (Age) | RP | Proprioceptive Loss | DTRs | Other | EMG/NCV | Biopsies |
|---|---|---|---|---|---|---|---|---|---|
| 11 (Figure 1) (p.Asn121Asp) |
9 | night blindness (4) | ataxia (3) | yes | yes | absent | GI dysmotility | EMG: WNL; sensory nerve conduction: absent | |
| 14 (Figure 1) (p.Asn121Asp) |
11 | night blindness (early childhood) | ataxia (childhood) | yes | yes | absent | |||
| 18 (Figure 1) (p.Asn121Asp) |
8 | night blindness (3-4) | ataxia (3-4) | yes | yes | absent | |||
| 24 (Figure 1) (p.Asn121Asp) |
19 | night blindness (early childhood) | ataxia (childhood) | yes | yes | absent | |||
| 25 (Figure 1) (p.Asn121Asp) |
17 | night blindness (early childhood) | ataxia (childhood) | yes | yes | absent | |||
| 30 (Figure 1) (p.Asn121Asp) |
39 | night blindness (early childhood) | ataxia (childhood) | yes | yes | absent | camptodactyly, scoliosis | EMG: WNL; sensory nerve conduction: absent | sural nerve: atrophy, normal myelination, axonal degeneration (age 39); muscle: normal. |
| 13 (Figure 1) (p.Asn121Asp) |
6 mo | pigmentary retinopathy (6 mo.) | areflexia | yes | absent | ||||
| 23 (Figure 1) (p.Asn121Asp) |
1 | pigmentary retinopathy (1) | areflexia | yes | absent | ||||
| IV-2 (Figure 2) (p.Ala241Thr) |
60 | night blindness (infancy) | ataxia (childhood) | yes | yes | absent | cataracts | ||
| IV-10 (Figure 2) (p.Ala241Thr) |
48 | visual loss (12) | ataxia (1–2) | yes | yes | absent | cataracts | ||
| IV-14 (Figure 2) (p.Ala241Thr) |
18 | visual loss (18) | ataxia (14) | yes | yes | absent | dorsal kyphosis | sural nerve: atrophy, loss of large myelinated fibers (age 35) (Figure 7C) | |
| V-3 (Figure 2) (p.Ala241Thr) |
6 | visual loss (6) | ataxia (6) | yes | yes | absent | dorsal kyphosis | ||
| V-4 (Figure 3) (p.Cys192Arg) |
14 | pigmentary retinopathy (1.5) | delayed walking (4) | yes | yes | absent | neonatal seizures, osteomyelitis, scoliosis, finger contractures | sural nerve: atrophy, normal myelination, axonal degeneration (age 1); muscle: normal. | |
| VI-2 (Figure 3) (p.Cys192Arg) |
13 | pigmentary retinopathy (9 mo) | ataxia (1) | yes | yes | absent | occasional fecal incontinence |
Abbreviations are as follows:; DTRs, deep tendon reflexes; EMG, electromyography; GI, gastrointestinal; NCV, nerve conduction velocities; RP, retinitis pigmentosa; WNL, within normal limits.
Figure 7.
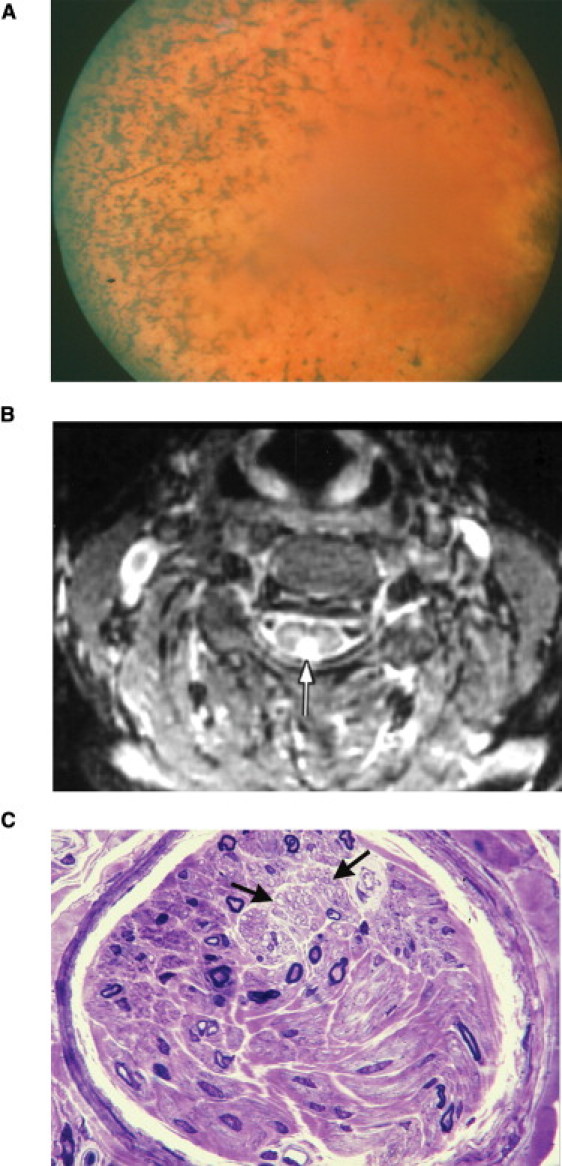
Phenotypic Features of Individuals with PCARP and FLVCR1 Mutations
(A) Fundus photograph of individual 30 from the American family (Figure 1) at age 39, showing typical bone-spicule pigmentation and retinal vessel attenuation seen in RP.
(B) Axial MRI scan (TR-3000, TE-30, T1-150) with a white arrow pointing toward an abnormal hyperintense signal in the posterior aspect of the spinal cord of individual 30 (Figure 1) at age 39.
(C) A semithin cross-section of a sural nerve fascicle showing severe loss of large myelinated fibers in individual IV-14 (Figure 2) at age 35. The density of myelinated fibers was 850 per mm2, with a complete loss of myelinated fibers having diameters larger than 8 μm. The two black arrows point to an area with preserved unmyelinated fibers (toluidine blue, 63× objective). Scale bar represents 10 μm.
Affected members of a Spanish gypsy family (Figure 2) were originally classified with a recessively inherited cerebellar ataxia and RP5 and were later reassessed for PCARP.3,4 All affected individuals with the homozygous FLVCR1 missense mutation, c.721G>A (p.Ala241Thr), had visual disturbances caused by RP during the first decade of life. Gait abnormalities were noticeable by the second decade and slowly progressed over the life of the affected individuals. Individual IV-14 exhibited a progressive gait and limb ataxia beginning at age 14. A sural nerve biopsy at age 35 showed a loss of large myelinated fibers (Figure 7C).
All affected individuals from a French Canadian family (Figure 3) with a homozygous FLVCR1 missense mutation, c.574T>C (p.Cys192Arg), had a childhood-onset hereditary sensory neuropathy with RP and ataxia. The two males and two females were 16 to 51 years old. They presented initially with delayed walking, orthopedic deformities, scoliosis, and mild distal weakness of intrinsic hand and foot muscles. All affected individuals had decreased fine touch and vibration with proprioceptive loss in the feet. Deep tendon reflexes were absent. Walking became impossible in all cases. The upper limb ataxia was present but mild. Recurrent urinary tract infections and incontinence were other features.
Two families from Western Europe had a PCARP-like phenotype without mutations in FLVCR1 (Figure 6). Siblings (two males and one female) (Figure 6A) and a single affected male patient from a second family of patients (Figure 6B) had early-onset night blindness, RP, unsteady gait, loss of position sense, and evidence of sensory ataxia. In contrast to the other three families with PCARP, all of the affected individuals had decreased pain sensation in the hands and feet. These signs, noted during the first or second decade, progressed over time. An MRI scan of the head and thoracic spine was normal for individual III-3 (Figure 6B). Other systemic findings were scoliosis, gastrointestinal dysmotility, and camptodactyly. Sanger sequencing of FLVCR1 in individuals III-5 (Figure 6A) and III-3 (Figure 6B) failed to reveal mutations.
qPCR
To determine whether the selective pathologic features of PCARP correlate with Flvcr1 expression, we examined wild-type mouse Flvcr1 mRNA levels in the brain (neocortex, striatum, hippocampus, and cerebellum), posterior column of the spinal cord, and retina by qPCR. As predicted, the Flvcr1 mRNA levels were most abundant in the retina, followed by the posterior column of the spinal cord and the cerebellum, as compared to the neocortex, striatum, and hippocampus (Figure 8).
Figure 8.
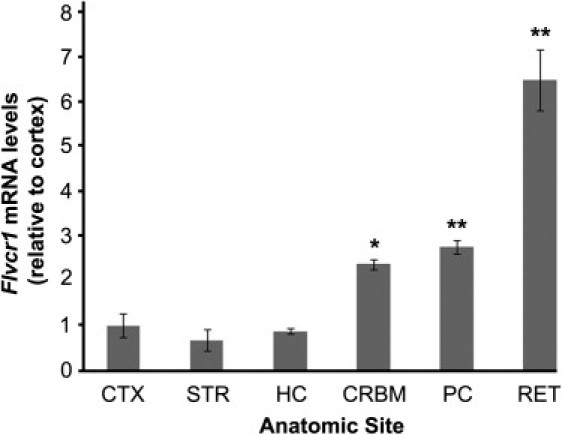
Regional qPCR Studies of Flvcr1 mRNA Expression in Mouse Neocortex, Striatum, Hippocampus, Cerebellum, Posterior Column of the Spinal Cord, and Retina
Neocortex, CTX; striatum, STR; hippocampus, HC; cerebellum, CRBM; posterior column of the spinal cord, PC; retina, RET. Flvcr1 mRNA levels in the RET are more than 3-fold higher than those in the PC and five-fold higher than those in the CTX. Levels in the PC are almost 3-fold higher than those in the CTX. Error bars are represented by ± SEM; ∗∗p < 0.001, ∗p < 0.01 as compared to CTX.
Discussion
Proprioceptive impulses are relayed through ascending large, fast-conducting, and medium-size myelinated nerve fibers of the posterior columns of the spinal cord. Like the retina, these fibers are somatotopically organized and composed primarily of the central branches of dorsal root ganglion cells (primary afferent fibers). The relationship between vision and proprioception is poorly understood, but vision can compensate for the loss of proprioception through feed-forward and feedback mechanisms.19 Clinically, this is illustrated in disorders such as PCARP, in which injury to proprioceptive fibers results in ataxia that appears, or is worsened, when the eyes are closed (Romberg sign). At the molecular level, the nature of the similarities between the posterior columns of the spinal cord and the retina are uncharacterized. The presence of interneurons and ganglion cells in both sensory systems suggests that a gene mutated in PCARP is involved in an age-related, developmental mechanism such as programmed cell death or apoptosis. To date, PCARP is the sole human neurological disorder that is associated with FLVCR1 mutations. Before this report, FLVCR1 was thought to be exclusively associated with hematological disorders such as Diamond-Blackfan syndrome (MIM 105650).20,21 Defective erythropoiesis and craniofacial and limb deformities similar to this human hematological disorder are present in Flvcr1 (also known as Mfsd7b) null mice.21 The retinal phenotype of this knockout mouse has not been reported to date. Although FLVCR1 is expressed in the human and mouse brain,20 to our knowledge its expression in the retina was unknown until we showed its abundant expression by qPCR (Figure 8). Previous in situ hybridization studies in wild-type mice showed Flvcr1 mRNA expression in the cerebellum, hippocampus, and spinal cord (Figure S2). Our findings of high levels in the retina and spinal cord suggest a correlation between the regional specificity of FLVCR1 mRNA expression and the selective degenerative pathology of PCARP. Mutations in FLVCR1 most likely cause different phenotypes based on the effect of mutations on its protein domains. For example, mutations in the transmembrane segments (Figure 4) lead to the PCARP phenotype, whereas mutations in the extracellular loops affect the binding of the feline leukemia virus.18 The lack of FLVCR1 mutations in the Western European families with PCARP that we studied suggests genetic heterogeneity. A phenotypic feature that may distinguish individuals with and without FLVCR1 mutations is impaired sensation in the distal extremities. The presence of this stocking-and-glove polyneuropathy in PCARP families without FLVCR1 mutations suggests a more generalized disturbance in multiple sensory neurons.
Mutations in the FLVCR1 paralog, FLVCR2 (MIM 610865), cause an autosomal-recessive prenatal lethal disorder characterized by hydranencephaly and diffuse ischemic injury to the brain and retina (Fowler syndrome [MIM 225790]).22 Both FLVCR1 and FLVCR2 belong to a large and diverse group of transporters called the major facilitator superfamily (MFS).23 MFS transporters are single-polypeptide secondary carriers capable of transporting small solutes in response to chemiosmotic ion gradients. MFS proteins contain 12 transmembrane alpha helices connected by hydrophilic loops. FLVCR1 functions as an exporter of cytoplasmic heme in erythrocyte precursors,17 but its function in neurons is unknown. Heme, a cyclic tetrapyrole containing a centrally chelated iron, serves as the prosthetic group for hemoproteins such as neuroglobin (NGB [MIM 605304]) and hemoglobin. NGB is a neuroprotective protein15 specific to neurons of the central and peripheral nervous systems24–26 and the retina.27 NGB mRNA expression is 100-fold higher in the retina compared to the nervous system and is restricted to the plexiform layers and the inner segments of the photoreceptors.27 In general, the apoptotic changes in RP occur initially in retinal photoreceptor cells, followed by changes in ganglion cells.28 Inhibition of FLVCR1 cell-surface expression induces apoptosis by the release of cytochrome c and the activation of caspase 3.29 Consistent with these observations, we hypothesize that the FLVCR1 missense mutations in PCARP perturb neuronal heme transmembrane export, thereby abrogating the neuroprotective effects of NGB and initiating an apoptotic cascade that results in the selective degeneration of photoreceptors in the neurosensory retina and sensory neurons in the posterior spinal cord.
This study describes a powerful and efficient resequencing approach that uses a few individuals from a single family with a rare disorder to identify a gene that would not have otherwise been selected as a plausible candidate for a neurological disorder on the basis of its role in erythropoiesis. Identifying the underlying genetic causes of rare disorders has profound implications in shedding light on the molecular basis of fundamental developmental and disease processes, improving genetic counseling and advice regarding prognosis, and potentially leading to future therapeutic interventions such as gene replacement therapy. The progressive dysfunction over time of two specific sensory modalities, vision and proprioception, in PCARP illustrates the importance of such research in unraveling the molecular mechanism of neuronal networks. Studying the function of FLVCR1 in heme and iron metabolism and its relationship to sensory ataxia may unravel fundamental neurodegenerative processes involved in Friedreich ataxia and other disorders in which a disturbance of iron homeostasis plays a central role in pathogenesis.
Acknowledgments
We thank the families for their participation in this study. This research was supported by intramural funding from the National Institute of Neurological Disorders and Stroke (NINDS), of the US National Institutes of Health, and the New York State Department of Health (to J.J.H.) and by funds from The Hartwell Foundation (to A.M.R. and J.J.H.). The Association de la Neuropathie Sensorielle et Autonomique Héréditaire de Type 2 supported the recruitment and genetic mapping of the French Canadian family by C.P. and B.B. The Foundation Fighting Blindness (Columbia, MD, USA) and an unrestricted grant from Research to Prevent Blindness (New York, NY, USA) supported R.G.W. in the evaluation of the Western European families. M.M. was supported by grants from Moorfields Special Trustees and the National Institute for Health Research UK to the Biomedical Research Centre for Ophthalmology, based at Moorfields Eye Hospital NHS Foundation Trust and the University College London Institute of Ophthalmology, UK. We thank B.E. Kosofsky, Chief, Division of Pediatric Neurology, Department of Pediatrics, Weill Cornell Medical College, New York, New York, USA, for securing funding for resequencing; D.H. Morton and the staff at the Clinic for Special Children in Strasburg, PA, USA for financially supporting the sequencing of candidate genes in the American family; S. Ra and A.L. Tal from the Laboratory of Molecular and Developmental Neurobiology, Weill Cornell Medical College, New York, NY, USA for their technical assistance; and N.B. Stover from the Oregon Retinal Degeneration Center, Casey Eye Institute, Portland, OR, USA, S.J. Hayflick and P. Hogarth from the Departments of Neurology and Medical & Molecular Genetics, and S.K. Westaway from the Departments of Neurology and Cardiology, Oregon Health & Science University, Portland, OR, USA for characterizing the two Western European families with a PCARP-like phenotype.
Supplemental Data
Web Resources
The URLs for data provided herein are as follows:
1000 Genomes, http://browser.1000genomes.org/index.html
Agilent eArray, https://earray.chem.agilent.com/earray
Allen Brain Atlas, http://www.alleninstitute.org/
Entrez Gene, http://www.ncbi.nlm.nih.gov/gene/
ModBAse, http://modbase.compbio.ucsf.edu/modbase-cgi/index.cgi
Online Mendelian Inheritance in Man (OMIM), http://www.ncbi.nlm.nih.gov/omim/
PhastCons, http://compgen.bscb.cornell.edu/phast/
PolyPhen, http://genetics.bwh.harvard.edu/pph/
UniProt Knowledgebase, http://www.uniprot.org/
References
- 1.Higgins J.J., Morton D.H., Patronas N., Nee L.E. An autosomal recessive disorder with posterior column ataxia and retinitis pigmentosa. Neurology. 1997;49:1717–1720. doi: 10.1212/wnl.49.6.1717. [DOI] [PubMed] [Google Scholar]
- 2.Higgins J.J., Morton D.H., Loveless J.M. Posterior column ataxia with retinitis pigmentosa (AXPC1) maps to chromosome 1q31-q32. Neurology. 1999;52:146–150. doi: 10.1212/wnl.52.1.146. [DOI] [PubMed] [Google Scholar]
- 3.Higgins J.J., Kluetzman K., Berciano J., Combarros O., Loveless J.M. Posterior column ataxia and retinitis pigmentosa: a distinct clinical and genetic disorder. Mov. Disord. 2000;15:575–578. doi: 10.1002/1531-8257(200005)15:3<575::AID-MDS1023>3.0.CO;2-7. [DOI] [PubMed] [Google Scholar]
- 4.Berciano J., Polo J.M. Autosomal recessive posterior column ataxia and retinitis pigmentosa. Neurology. 1998;51:1772–1773. doi: 10.1212/wnl.51.6.1772-a. [DOI] [PubMed] [Google Scholar]
- 5.Polo J.M., Calleja J., Combarros O., Berciano J. Hereditary ataxias and paraplegias in Cantabria, Spain. An epidemiological and clinical study. Brain. 1991;114:855–866. doi: 10.1093/brain/114.2.855. [DOI] [PubMed] [Google Scholar]
- 6.van Soest S., te Nijenhuis S., van den Born L.I., Bleeker-Wagemakers E.M., Sharp E., Sandkuijl L.A., Westerveld A., Bergen A.A. Fine mapping of the autosomal recessive retinitis pigmentosa locus (RP12) on chromosome 1q; exclusion of the phosducin gene (PDC) Cytogenet. Cell Genet. 1996;73:81–85. doi: 10.1159/000134313. [DOI] [PubMed] [Google Scholar]
- 7.Biemond A. Les degenerations spino-cerebelleuses. Folia Psychiatr Neurol Neurochir Neerl. 1951;54:216–223. [PubMed] [Google Scholar]
- 8.Singh N., Mehta M., Roy S. Familial posterior column ataxia (Biemond's) with scoliosis. Eur. Neurol. 1973;10:160–167. doi: 10.1159/000114272. [DOI] [PubMed] [Google Scholar]
- 9.Valdmanis P.N., Simões Lopes A.A., Gros-Louis F., Stewart J.D., Rouleau G.A., Dupré N. A novel neurodegenerative disease characterised by posterior column ataxia and pyramidal tract involvement maps to chromosome 8p12-8q12.1. J. Med. Genet. 2004;41:634–639. doi: 10.1136/jmg.2004.019711. [DOI] [PMC free article] [PubMed] [Google Scholar]
- 10.Tuck R.R., McLeod J.G. Retinitis pigmentosa, ataxia, and peripheral neuropathy. J. Neurol. Neurosurg. Psychiatry. 1983;46:206–213. doi: 10.1136/jnnp.46.3.206. [DOI] [PMC free article] [PubMed] [Google Scholar]
- 11.Gnirke A., Melnikov A., Maguire J., Rogov P., LeProust E.M., Brockman W., Fennell T., Giannoukos G., Fisher S., Russ C. Solution hybrid selection with ultra-long oligonucleotides for massively parallel targeted sequencing. Nat. Biotechnol. 2009;27:182–189. doi: 10.1038/nbt.1523. [DOI] [PMC free article] [PubMed] [Google Scholar]
- 12.Chepelev I., Wei G., Tang Q., Zhao K. Detection of single nucleotide variations in expressed exons of the human genome using RNA-Seq. Nucleic Acids Res. 2009;37:e106. doi: 10.1093/nar/gkp507. [DOI] [PMC free article] [PubMed] [Google Scholar]
- 13.Higgins J.J., Tal A.L., Sun X., Hauck S.C., Hao J., Kosofosky B.E., Rajadhyaksha A.M. Temporal and spatial mouse brain expression of cereblon, an ionic channel regulator involved in human intelligence. J. Neurogenet. 2010;24:18–26. doi: 10.3109/01677060903567849. [DOI] [PubMed] [Google Scholar]
- 14.Higgins J.J., Hao J., Kosofsky B.E., Rajadhyaksha A.M. Dysregulation of large-conductance Ca2+-activated K+ channel expression in nonsyndromal mental retardation due to a cereblon p.R419X mutation. Neurogenetics. 2008;9:219–223. doi: 10.1007/s10048-008-0128-2. [DOI] [PubMed] [Google Scholar]
- 15.Raychaudhuri S., Skommer J., Henty K., Birch N., Brittain T. Neuroglobin protects nerve cells from apoptosis by inhibiting the intrinsic pathway of cell death. Apoptosis. 2010;15:401–411. doi: 10.1007/s10495-009-0436-5. [DOI] [PMC free article] [PubMed] [Google Scholar]
- 16.Li H., Durbin R. Fast and accurate short read alignment with Burrows-Wheeler transform. Bioinformatics. 2009;25:1754–1760. doi: 10.1093/bioinformatics/btp324. [DOI] [PMC free article] [PubMed] [Google Scholar]
- 17.Quigley J.G., Yang Z., Worthington M.T., Phillips J.D., Sabo K.M., Sabath D.E., Berg C.L., Sassa S., Wood B.L., Abkowitz J.L. Identification of a human heme exporter that is essential for erythropoiesis. Cell. 2004;118:757–766. doi: 10.1016/j.cell.2004.08.014. [DOI] [PubMed] [Google Scholar]
- 18.Brown J.K., Fung C., Tailor C.S. Comprehensive mapping of receptor-functioning domains in feline leukemia virus subgroup C receptor FLVCR1. J. Virol. 2006;80:1742–1751. doi: 10.1128/JVI.80.4.1742-1751.2006. [DOI] [PMC free article] [PubMed] [Google Scholar]
- 19.Ghez C. The control of movement. In: Kandel E., Schwartz J., Jessel T., editors. Principles of Neural Science. Appleton & Lange; East Norwalk, Connecticut: 1991. pp. 530–547. [Google Scholar]
- 20.Keel S.B., Doty R.T., Yang Z., Quigley J.G., Chen J., Knoblaugh S., Kingsley P.D., De Domenico I., Vaughn M.B., Kaplan J. A heme export protein is required for red blood cell differentiation and iron homeostasis. Science. 2008;319:825–828. doi: 10.1126/science.1151133. [DOI] [PubMed] [Google Scholar]
- 21.Rey M.A., Duffy S.P., Brown J.K., Kennedy J.A., Dick J.E., Dror Y., Tailor C.S. Enhanced alternative splicing of the FLVCR1 gene in Diamond Blackfan anemia disrupts FLVCR1 expression and function that are critical for erythropoiesis. Haematologica. 2008;93:1617–1626. doi: 10.3324/haematol.13359. [DOI] [PubMed] [Google Scholar]
- 22.Meyer E., Ricketts C., Morgan N.V., Morris M.R., Pasha S., Tee L.J., Rahman F., Bazin A., Bessières B., Déchelotte P. Mutations in FLVCR2 are associated with proliferative vasculopathy and hydranencephaly-hydrocephaly syndrome (Fowler syndrome) Am. J. Hum. Genet. 2010;86:471–478. doi: 10.1016/j.ajhg.2010.02.004. [DOI] [PMC free article] [PubMed] [Google Scholar]
- 23.Pao S.S., Paulsen I.T., Saier M.H., Jr. Major facilitator superfamily. Microbiol. Mol. Biol. Rev. 1998;62:1–34. doi: 10.1128/mmbr.62.1.1-34.1998. [DOI] [PMC free article] [PubMed] [Google Scholar]
- 24.Burmester T., Weich B., Reinhardt S., Hankeln T. A vertebrate globin expressed in the brain. Nature. 2000;407:520–523. doi: 10.1038/35035093. [DOI] [PubMed] [Google Scholar]
- 25.Reuss S., Saaler-Reinhardt S., Weich B., Wystub S., Reuss M.H., Burmester T., Hankeln T. Expression analysis of neuroglobin mRNA in rodent tissues. Neuroscience. 2002;115:645–656. doi: 10.1016/s0306-4522(02)00536-5. [DOI] [PubMed] [Google Scholar]
- 26.Laufs T.L., Wystub S., Reuss S., Burmester T., Saaler-Reinhardt S., Hankeln T. Neuron-specific expression of neuroglobin in mammals. Neurosci. Lett. 2004;362:83–86. doi: 10.1016/j.neulet.2004.02.072. [DOI] [PubMed] [Google Scholar]
- 27.Schmidt M., Giessl A., Laufs T., Hankeln T., Wolfrum U., Burmester T. How does the eye breathe? Evidence for neuroglobin-mediated oxygen supply in the mammalian retina. J. Biol. Chem. 2003;278:1932–1935. doi: 10.1074/jbc.M209909200. [DOI] [PubMed] [Google Scholar]
- 28.Milam A.H., Li Z.Y., Fariss R.N. Histopathology of the human retina in retinitis pigmentosa. Prog. Retin. Eye Res. 1998;17:175–205. doi: 10.1016/s1350-9462(97)00012-8. [DOI] [PubMed] [Google Scholar]
- 29.Ye W., Zhang L. Heme deficiency causes apoptosis but does not increase ROS generation in HeLa cells. Biochem. Biophys. Res. Commun. 2004;319:1065–1071. doi: 10.1016/j.bbrc.2004.05.089. [DOI] [PubMed] [Google Scholar]
Associated Data
This section collects any data citations, data availability statements, or supplementary materials included in this article.