Abstract
The Database of Interacting Proteins (DIP; http://dip.doe-mbi.ucla.edu) is a database that documents experimentally determined protein–protein interactions. Since January 2000 the number of protein–protein interactions in DIP has nearly tripled to 3472 and the number of proteins to 2659. New interactive tools have been developed to aid in the visualization, navigation and study of networks of protein interactions.
INTRODUCTION
The Database of Interacting Proteins (DIP) is a database that documents experimentally determined protein–protein interactions. During the last year, an effort has been underway to increase the number of interactions described by DIP and to link DIP to major sequence and knowledge databases. Tools have been developed that enable the user to traverse the interaction networks and to visualize the various networks of protein complexes and biochemical pathways.
The past year has brought an increased interest in databases presenting knowledge about proteins in the context of the entire cell. This is in part due to the explosion of genome sequence data and to the development of DNA chip methods that rapidly produce large sets of gene expression data. Knowledge databases such as DIP can be used to interpret whole cell expression data (1) and should substantially improve these analyses in the future.
GROWTH OF THE DATABASE
The core of the DIP database structure is composed of three linked tables: one of protein information, one of protein–protein interactions and one describing details of experiments (2). During this year, a table linking DIP to the YPD database provided by Proteome, Inc. has been added (3). DIP was expanded significantly by the addition of data from large-scale yeast two-hybrid experiments (4,5). Although many of these interactions are yet to be confirmed by other methods, the yeast two-hybrid studies offer a wealth of potential interactions. DIP can also be used to compare differences in yeast two-hybrid data from various sources.
Since January 2000, the number of articles in DIP reporting interaction experiments has increased from 500 to 1020. Correspondingly, DIP has increased in size from 1500 to 2659 proteins, and the number of interactions has nearly tripled, rising to 3472.
STATE OF THE DATABASE
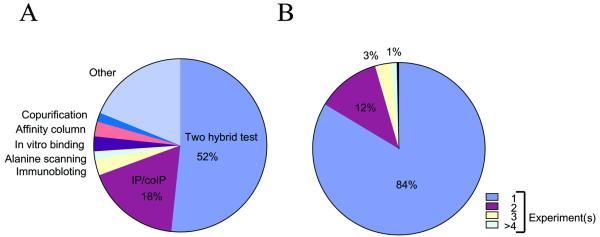
The methods detecting interactions reported in DIP are summarized in Figure 1A. The majority of interactions in DIP have been detected by the yeast two-hybrid method, but a significant fraction by co-immunoprecipitation (coIP). Our hypothesis is that many protein–protein interactions are first observed by the two-hybrid method, and then later confirmed by other methods. This type of hypothesis can be evaluated as DIP grows.
Figure 1.
(A) The distribution of experimental methods for detecting the protein–protein interactions documented in DIP. The most popular methods are shown in the pie chart. For a complete list of techniques see http://dip.doe-mbi.ucla.edu. (B) Crossvalidation of protein–protein interactions: 84% of the interactions are observed in only a single experiment, but a growing fraction is observed by multiple experiments.
Some 16% of interactions have been detected by more than one method. In Figure 1B, we show the fraction of interactions detected by more than one method. The majority of interactions (84%) are detected by only a single experiment; of these 25% were determined by genome-wide yeast two-hybrid method (4,5). As new methods detect interactions already documented in DIP, we will add these confirmations. Although proteins from 79 organisms are present in DIP, some 65% of interactions documented at present are between yeast proteins (65%).
CLUSTERS OF PROTEINS
The DIP offers a large-scale picture of protein interaction networks. Perhaps not surprisingly given the homeostatic characteristics of cells, many of the proteins in DIP form a single connected network of interactions, accompanied by several smaller networks.
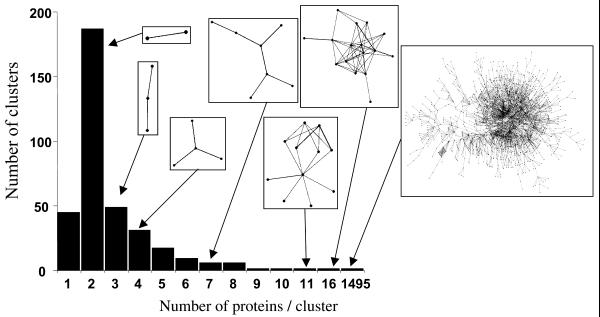
In total, 350 connected interaction networks are found in DIP; their size distribution is shown in Figure 2. The majority of interaction networks correspond to heterodimers (185) or homodimers (47), but larger networks range from 4 to 16 proteins in size, and the principal cluster contains 1495 proteins. A year ago, only 1089 proteins were contained in this network, and we suspect that as we increase the number of interactions in DIP, the smaller networks will merge with the principal network. The principal cluster of 1495 proteins is examined further in Figure 3B, where we show all interactions that are within three interaction steps from yeast actin.
Figure 2.
The distribution of protein cluster sizes is plotted along with representative network topology (in boxes). Circles represent proteins and lines represent interactions. The largest connected interaction network currently contains 1495 proteins.
Figure 3.
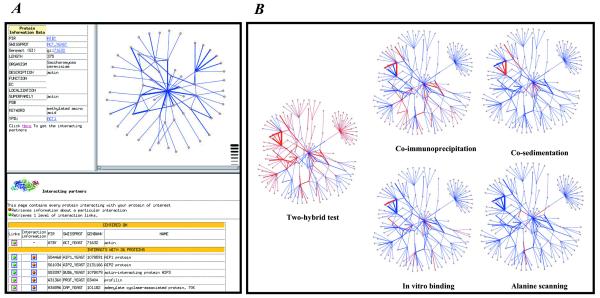
(A) An example of a DIP web page centered on the yeast actin shows how users can graphically navigate interaction networks. The upper left frame contains information about the selected protein (i.e. yeast actin). The upper right frame contains a graphical representation of the network within two interactions from yeast actin. The lower panel lists interacting partners of the selected protein (only partly shown here). (B) Graphical representation of the protein interaction network within three interactions from yeast actin. Circles represent proteins and lines represent interactions. The line thickness represents the number of experiments detecting a given interaction. Specific methods are highlighted to illustrate their distribution in the network. Blue lines represent any type of methods; red lines depict the selected method.
VISUALIZATION OF PROTEIN NETWORKS AND THEIR SUPPORTING EXPERIMENTAL METHODS
DIP now includes an interactive web page that enables the user to traverse the network of interactions from any protein in the database. As shown in Figure 3A, the page is composed of three different frames: the upper right frame contains the graphical representation of the network, the upper left frame contains the protein information and the bottom frame lists the proteins that interact with the selected protein. Each frame is interactive. For example, clicking on a protein in the graphical map changes the protein information display.
As illustrated in Figure 3B for yeast actin, the detecting experimental methods can be superimposed over the network of protein interactions. Here, one can see that the most popular experiments is the two-hybrid test, and next most popular is co-immunoprecipitation, as already described in Figure 1A.
The goal of this new graphical representation is to allow users to grasp more easily the connection of their protein of interest with other proteins.
FUTURE DIRECTIONS
Several approaches have been proposed for automatic extraction of information for known protein–protein interactions from MEDLINE (National Library of Medicine, MD).
We have used the abstracts of articles present in DIP to train a Bayesian classifier (6) to extract abstracts from MEDLINE that potentially describe protein interactions. Aided by this automated approach, a curator then checks the articles and enters the interactions into DIP. We expect to extract information on thousands of protein interactions from the literature using this approach.
Another planned improvement will be to allow users to submit protein sequences and to search for interactions by homologous proteins, as well as linking the DIP to predictions of interactions from the Rosetta Stone and Phylogenetic Profile methods (7).
Another planned improvement to DIP is to include protein modification states. This should allow users to examine interaction networks according to protein status (e.g. phosphorylation). We anticipate that this type of data will be useful for more complex modeling of the ‘circuitry’ of interaction networks.
DATA SUBMISSION AND CURATION
We seek expert curators to screen entries into the DIP. Scientists are invited to contribute to this database, by submitting interactions directly over the World Wide Web after obtaining a user account. To obtain an account, please contact us at dip@mbi.ucla.edu. Help for editing and submission is available online; questions can also be directed to dip@mbi.ucla.edu or at the fax number and address listed. Please feel free to send email containing published protein–protein interactions, and a curator will enter this information in the DIP.
Acknowledgments
ACKNOWLEDGEMENTS
The authors thank Thomas Graeber and Ken Goodwill for discussion and critical reading of the manuscript. We thank DOE and NIH for support of DIP. I.X. is a fellow of the Swiss National Fund.
References
- 1.Zien A., Kueffner,R., Zimmer,R. and Lengauer,T. (2000) Analysis of Gene Expression Data with Pathway Scores. Ismb, 407–417. [PubMed] [Google Scholar]
- 2.Xenarios I., Rice,D.W., Salwinski,L., Baron,M.K., Marcotte,E.M. and Eisenberg,D. (2000) DIP: the database of interacting proteins. Nucleic Acids Res., 28, 289–291. [DOI] [PMC free article] [PubMed] [Google Scholar]
- 3.Costanzo M.C., Hogan,J.D., Cusick,M.E., Davis,B.P., Fancher,A.M., Hodges,P.E., Kondu,P., Lengieza,C., Lew-Smith,J.E., Lingner,C., Roberg-Perez,K.J., Tillberg,M., Brooks,J.E. and Garrels,J.I. (2000) The yeast proteome database (YPD) and Caenorhabditis elegans proteome database (WormPD): comprehensive resources for the organization and comparison of model organism protein information. Nucleic Acids Res., 28, 73–76. [DOI] [PMC free article] [PubMed] [Google Scholar]
- 4.Ito T., Tashiro,K., Muta,S., Ozawa,R., Chiba,T., Nishizawa,M., Yamamoto,K., Kuhara,S. and Sakaki,Y. (2000) Toward a protein-protein interaction map of the budding yeast: A comprehensive system to examine two-hybrid interactions in all possible combinations between the yeast proteins. Proc. Natl Acad. Sci. USA, 97, 1143–1147. [DOI] [PMC free article] [PubMed] [Google Scholar]
- 5.Uetz P., Giot,L., Cagney,G., Mansfield,T.A., Judson,R.S., Knight,J.R., Lockshon,D., Narayan,V., Srinivasan,M., Pochart,P., Qureshi-Emili,A., Li,Y., Godwin,B., Conover,D., Kalbfleisch,T., Vijayadamodar,G., Yang,M., Johnston,M., Fields,S. and Rothberg,J.M. (2000) A comprehensive analysis of protein-protein interactions in Saccharomyces cerevisiae. Nature, 403, 623–627. [DOI] [PubMed] [Google Scholar]
- 6.Marcotte E.M., Xenarios,I. and Eisenberg,D. (2001) Mining literature for protein-protein interaction. Bioinformatics, in press. [DOI] [PubMed] [Google Scholar]
- 7.Eisenberg D., Marcotte,E.M., Xenarios,I. and Yeates,T.O. (2000) Protein function in the post-genomic era. Nature, 405, 823–826. [DOI] [PubMed] [Google Scholar]


