Abstract
Fluorescence molecular imaging/tomography may play an important future role in preclinical research and clinical diagnostics. Time- and frequency-domain fluorescence imaging can acquire more measurement information than the continuous wave (CW) counterpart, improving the image quality of fluorescence molecular tomography. Although diffusion approximation (DA) theory has been extensively applied in optical molecular imaging, high-order photon migration models need to be further investigated to match quantitation provided by nuclear imaging. In this paper, a frequency-domain parallel adaptive finite element solver is developed with simplified spherical harmonics (SPN) approximations. To fully evaluate the performance of the SPN approximations, a fast time-resolved tetrahedron-based Monte Carlo fluorescence simulator suitable for complex heterogeneous geometries is developed using a convolution strategy to realize the simulation of the fluorescence excitation and emission. The validation results show that high-order SPN can effectively correct the modeling errors of the diffusion equation, especially when the tissues have high absorption characteristics or when high modulation frequency measurements are used. Furthermore, the parallel adaptive mesh evolution strategy improves the modeling precision and the simulation speed significantly on a realistic digital mouse phantom. This solver is a promising platform for fluorescence molecular tomography using high-order approximations to the radiative transfer equation.
1. Introduction
Imaging of the biological actions of therapeutics in vivo is paramount for the advancing field of molecular medicine (Weissleder 1999, Massoud and Gambhir 2003, Herschman 2003, Cherry 2004). Currently, nuclear imaging techniques of positron emission tomography (PET), single photon emission computed tomography (SPECT), or gamma scintigraphy are the clinical ‘gold-standards’ of molecular imaging. These techniques depend upon the collection of high energy photons that emanate from the relaxation of a radionuclide that is targeted to a specific disease marker in order to generate either a planar image (gamma scintigraphy) or a tomographic image (PET and SPECT). Preclinical small animal studies using these techniques are commonplace in the drug discovery field.
Optical molecular imaging is akin to nuclear imaging in that it also involves the collection of photons, albeit low energy photons that have significant attenuation due to scatter and absorption. In contrast to bioluminescence (Contag and Bachmann 2002, Wang et al 2004, Alexandrakis et al 2005, Chaudhari et al 2005, Cong et al 2005, Lv et al 2006, Dehghani et al 2006, Kuo et al 2007, Lu et al 2009a, Klose et al 2010) or emerging Cherenkov imaging (Cho et al 2009, Robertson et al 2009) approaches, fluorescence imaging has the capability for higher photon count rate for both planar and tomographic imaging as the fluorescent gene product or fluorescent exogenous agent can be repeatedly excited by tissue surface illumination (Sevick-Muraca et al 2002). Although most gene reporters are excited and emit in the visible regime where limited tissue penetration and autofluorescence can confound signals, new fluorescent gene reporters such as IFP1.4 (Shu et al 2009) are excited in the red range (>690 nm) with reduced autofluorescence and greater tissue penetration, opening up interesting possibilities for quantitative tomography for preclinical drug discovery. Exogenous agents with near-infrared (NIR) excitation (>780 nm) have minimal tissue autofluorescence thereby offering the lowest background for fluorescence planar and tomography techniques. Indeed, using indocyanine green (ICG), a dim and poor fluorophore with a low quantum efficiency of 0.016, planar human imaging has been conducted even at microdosages of <100 μg and millisecond data acquisition rates (Sevick-Muraca et al 2008, Rasmussen et al, 2009) to image structures in shallow tissues as well as tissue at depths up to 4–5 cm (Sevick-Muraca et al 2008).
Given the high photon count rates of planar fluorescence imaging for both fluorescent gene products and exogenous agents, tomographic reconstruction for quantification of expression/deposition should be possible given an accurate forward model for propagation of light in tissues. For quantification, the forward model must be suitable for visible and red wavelength-excitable gene products in preclinical studies, as well as NIR excitable exogenous agents in preclinical as well as clinical studies. While significant work has been accomplished using the diffusion approximation to the radiative transport equation (RTE) to model light transport in biological tissues (Gibson et al 2005), the high tissue absorption associated with visible and red-excited wavelengths, the small tissue volumes of preclinical models, or the shallow depths of human imaging studies obviate its use. A direct solution of the RTE is an alternative (Lewis and Warren 1984, Klose et al 2005, Rasmussen et al 2006, Joshi et al 2008), but with an expense of solving N (N + 2) and (N + 1)2-coupled partial differential equations corresponding to discrete ordinates (SN) and spherical harmonics (PN) methods, where N depicts the approximation degree. High-order approximations have been recently attempted to obtain sufficient performance for model-based iterative image reconstructions with less memory requirement and time cost compared with direct RTE solvers (Klose and Larsen 2006, Cong et al 2007, Yuan et al 2009, Chu et al 2009). However, in order to realize quantitative tomographic reconstruction in complex heterogeneous geometries, such as a mouse, we need to fully evaluate and validate the performance of those high-order approximations.
In addition, time-dependent measurements, i.e. time- or frequency-domain measurements involving pulsed or modulated illumination of excitation light, have been shown to improve reconstructions of embedded fluorescent tissues by providing more information than continuous wave or time-independent methods (Godavarty et al 2003), but few, if any, studies validate higher order approximation model predictions of both excitation and fluorescence measurements in both time and 3D space. Owing to the complex and curvilinear geometries associated with biological tissues, finite element methods (FEM) become necessary for accurate quantification especially in small volumes where gradients of excitation and emission fluence distribution contribute substantially to discretization errors. The adaptive finite element method uses local mesh evolution strategy not only to accelerate the simulation with fewer discretized points but also to improve upon the discretization errors, forward solution accuracy and therefore reconstruction quality (Joshi et al 2004, Lv et al 2006). When the simulation region is decomposed into several subdomains, parallel simulation implementation can effectively accelerate the adaptive FEM simulation (Gu et al 2009, Lu and Chatziioannou 2009), enabling fully parallel adaptive finite element photon migration simulation with high-order RTE approximations that are suitable for use within inverse image reconstruction algorithms (Lu et al 2009b).
Herein, the forward solution for frequency domain, fluorescent photon migration in biological tissues, is realized with fully parallel adaptive finite element methods. The simplified spherical harmonics (SPN) approximations are validated using a unique time-domain tetrahedron-based Monte Carlo (MC) fluorescence simulator utilizing the convolution method (Swartling et al 2003) for improvement in computational time. Compared with diffusion approximation, computational validation shows the preferable performance of the SPN approximations especially in cases of high absorption and high modulation frequency. Simulation performance is then evaluated using a whole-body digital mouse to document improvement arising from parallel adaptive finite element strategies for fluorescence molecular imaging.
In the following section, the proposed simulation framework that incorporates parallel adaptive strategy and SPN approximations for frequency-domain fluorescence molecular imaging is introduced. The validation and comparative simulation results of the SPN approximations and MC methods are demonstrated in section 3. The performance and simulation improvements from parallel adaptive mesh evolution are represented in section 4. The conclusion and relevant discussions are provided in section 5. The forward simulation model presented herein represents a platform pertinent to time-dependent and -independent measurements, excitation and emission measurements, as well as emission measurements employing bioluminescence and Cherenkov emission tomography in small animals for drug discovery purposes.
2. Methods
2.1. The simplified spherical harmonics (SPN) approximations for frequency domain fluorescence molecular imaging
The frequency domain RTE for fluorescence molecular imaging in 3D are (Rasmussen et al 2006)
| (1a) (1b) |
where the modulation frequency is ω; ψx,m are the excitation and emission radiances; cb(r) is the light speed in the domain Ω; and are the scattering and absorption coefficients, respectively; is the absorption coefficient of the fluorophore; Q and τ are the quantum efficiency and lifetime of the fluorophore, respectively; p (ŝ, ŝ′) is the scattering phase function giving the probability of a photon anisotropically scattering from the direction ŝ′ to direction ŝ. Generally, the Henyey–Greenstein (HG) phase function is often used to characterize this probability (Ishimaru 1997):
| (2) |
where g is the anisotropy parameter; cos θ denotes the scattering angle that is equal to ŝ · ŝ′. The HG phase function is easily expanded by the Legendre polynomial and is therefore convenient for numerical computation. The angle-independent fluence φx,m is further defined as
| (3) |
At the tissue surface, r ∈ ∂Ω, we assume that some photons are internally reflected and do not escape from the domain because of the mismatch between the refractive indices nb of the domain Ω and nm of the surrounding external medium. Therefore, the partially reflecting boundary condition for ψx,m is described by (Klose and Larsen 2006)
| (4a) (4b) |
where v is the unit outer normal vector; the incidence angle θb from the volume is not beyond the critical angle θc (θc = arcsin(nm/nb) based on Snell’s law), and where the reflectivity R(cos θb) is given by (Haskell et al 1994)
| (5) |
where θm is the transmission angle. The exiting partial current J+(r) at each point r on the volume surface (where the illumination S(r, ŝ, ω) is not considered) is given as (Klose and Larsen 2006)
| (6) |
After a series of deductions with the PN method, the excitation SPN approximations are obtained similar to that described by Klose and Larsen (2006)
| (7) |
where (Chu et al 2009); when ψx is expanded by the PN approximation, are the Legendre moments of ψx (2 ≤ n ≤ N, N is an odd positive integer). The (N + 1)/2 boundary conditions for equation (7) can be obtained (Klose and Larsen 2006). When we define as the composite moments of ,
| (8) |
the general equations of the SPN approximations and its boundary conditions for excitation wavelength can be subsequently written as
| (9a) (9b) |
where and can be calculated for SP1 to SP7 (Klose and Larsen 2006). The corresponding approximation and boundary conditions for emission wavelength can be similarly defined as
| (10a) (10b) |
2.2. The parallel adaptive finite element methods for the SPN approximations
For the finite element analysis, a general weak formulation for the SPN approximations can be written as (Rao 1999)
| (11a) (11b) |
To avoid the processing of in boundary integration, we assume that are unknown variables in the boundary equations ((9b) and (10b)). We obtain and fSi (·)by solving a set of first-order equations to obtain the boundary conditions.
After the simulation domain Ω is discretized into the volumetric mesh  , the mesh is next partitioned into Nc mesh subdomains
  (1 ≤
(1 ≤  ≤ Nc), where Nc is the number of the utilized CPUs. For the finite element implementation, the space of linear finite elements
  is introduced on
  .
are approximated as
| (12) |
where
are the discretized values at a discretized point p at the lth adaptive mesh for excitation and emission wavelengths when using the basis function υp (r);  is the total number of the discretized points over the whole domain. Upon combining equations (11a),(11b), and (12), one obtains
| (13) |
where  is the number of the total discretized elements in subdomain
  ,
,
and
τe and ∂τe are the basic volumetric and surface elements of the mesh and belong to the respective subdomain in parallel implementation. After assembling all the submatrices on element τe, we obtain
| (14) |
In contrast to fixed or uniformly refined meshes, adaptively refined meshes require an a posteriori error estimation and the processing of hanging nodes. A posteriori error estimators decide which element should be refined or coarsened based upon the current solution. In parallel mode, the local error indicators are suitable because they reduce communications between processors. In this application, the gradient-jump error indicator is applied (Kelly et al 1983). For the SPN, the local jump indicator for element τe is defined as (Kirk 2007)
| (15) |
where wi is a weighted factor corresponding to ϕi, and Ri, τe is the local residual for ϕi, which is defined by
| (16) |
vτe is the outward unit normal for element τep and hτe is the diameter of τep. Using , a statistical strategy is used to decide the proportion of refined and coarsened elements (Carey 1997) by computing the mean (m) and standard deviation (σ) of the distribution as an indictor for adaptive refinement or coarsening. The refinement and coarsening ratios (γr and γc) are set to select elements. By judging whether the log-error of one element is higher than (m + γr σ), or lower than (m − γcσ), the element is either refined or coarsened. When coarsening an element, only the refined elements are operated upon.
Since the hanging node constraint needs to consider specific elements in geometric method processing, the algebraic constraint method is selected to deal with hanging nodes (Carey 1997). Adaptive mesh evolution brings new challenges for balancing computational burden across partitioned domains. Imbalance deteriorates parallel performance and dynamic repartitioning of the mesh is indispensable for balancing computational burden. A k-way partitioning method is used to perform the partitioning after mesh refinement (Karypis and Kumar 1998). The reader is referred to Lu and Chatziioannou (2009) for details.
2.3. Time-resolved tetrahedron-based Monte Carlo fluorescence simulation
MC methods provide ground truth to evaluate and validate photon migration simulations. The need to simulate illumination patterns that have been demonstrated to improve reconstructions (Joshi et al 2006) and incorporate time dependence (Sevick-Muraca et al 1997, Li et al 1998, Godavarty et al 2004, Patwardhan et al 2005) while providing comparable domains for validating FEM solutions of complex geometries requires new MC solvers. To fully validate the SPN approximations for our parallel FEM solver, we develop a time-resolved MC fluorescence simulator (TR-TIM-OS) based on a tetrahedron-based inhomogeneous MC optical simulator (TIM-OS) (Shen and Wang 2010).
2.3.1. Arbitrary shaped source settings and photon sampling
Triangular and tetrahedral elements have become popular in numerical computation, especially in numerical computation, because of their ability to describe complex geometries. Tetrahedron-based MC photon simulation facilitates validation of complex geometries and patterned illumination sources that require triangular and tetrahedral elements (Shen and Wang 2010). In fluorescent photon MC, there are two manners to initiate photon trajectories: (i) through external illumination of excitation photons and (ii) through internal generation of emission photons.
On the boundary of a domain, a triangle is the basic element describing the surface. In order to set arbitrary-shaped area illumination Eai, a group of triangles ( ) at any position of the surface can be selected. In order to simulate the spatially uniform photon illumination when the area of the selected triangles is calculated, a uniform random number generator can be used to randomly select one from all the triangles depending on their areas. In a selected triangle, the position of the sampled point obeying the uniform random distribution is given by (Turk 1990)
| (17) |
where rd1 and rd2 are the random number obeying a uniform distribution. If the sum of rd1 and rd2 is greater than ‘1.0’, two new random numbers for them are regenerated. Conversely, rd3 = 1 − rd1 − rd2. The emitting direction of the photon can be uniformly sampled.
Since the volumetric domain is discretized using tetrahedral elements, a group of tetrahedra ( ) can be selected as volumes containing fluorophores of uniform distribution that can be sites for generation of fluorescent photons. Similar to the method for simulating excitation area illumination, any can be selected randomly. The position of the generated emission photon can be obtained randomly and quickly using the algorithm in Rocchini and Cignoni (2000). The emitting direction of the emission photon can then be uniformly sampled over the whole solid angle.
2.3.2. Photon tracking
Once the initial excitation or emission photon generation is simulated as described above, trajectories are simulated using conventional MC techniques (Wang et al 1995, Boas et al 2002) where the weight of each photon is set to ‘1.0’ and attenuated depending upon the length of a step; each step length is sampled from
| (18) |
where rds is a uniform random number in [0, 1]. The corresponding time traveled is calculated from
| (19) |
When an emission photon is generated, the photon travel time is increased by (− ln(rdl )τ) due to the fluorescence lifetime, where rdl is similar to rds. At each step, the position, weight and accumulated travel time are recorded. In MC simulation using tetrahedron-based discretized domains, a data structure is designed to record the element adjacent information. When the photon trajectory occurs over two or even several tetrahedra, the photon trajectory can also be quickly localized through the established element adjacent information. Preliminary tests have shown that tetrahedron- and analytic geometry-based MC simulation have comparable simulation time (Shen and Wang 2010), although for validation work, simulation time is not as critical as is for FEM simulation. After setting the time step ΔtMC and the total photon traveling time and for excitation and emission procedures, respectively, the absorbed photon weight over time can be recorded before it is terminated.
2.3.3. Convolution-based emission simulation
In the MC simulation employed, simulation of excitation and emission photon distributions are performed separately. After simulating the temporal excitation, the fluence distribution over time is obtained within the whole simulation domain. is used to describe the fluence in the tetrahedral element . If describes a group of triangles for the surface measurement domain, then to each and , the time-resolved emission surface fluence is obtained in the emission simulation. The final emission fluence on the surface triangle can be computed from
| (20) |
With and , the corresponding amplitude and phase shift can be determined from the discrete Fourier transform of when the specific modulated frequency ω is selected (Pan et al 2007). The convolution approach dramatically speeds upon time-dependent MC simulation of emission.
3. Simulations
In order to demonstrate the performance of the SPN approximations, the in-house code was evaluated (SP1(i.e. the diffusion approximation), SP3 and SP7) for performance and compared to MC for validation. Currently, many open-source, high-quality software packages have been developed to meet the need of FEM-based simulation. In our application, libMesh was selected as the basis development environment (Kirk et al 2006). LibMesh provides almost all of the components used in parallel PDE-based simulation with unstructured discretization. We used PETSc developed by Argonne National Laboratory (ANL) to solve the linear systems in parallel mode (Balay et al 2001) and METIS (Karypis and Kumar 1998) to dynamically partition the whole domain in libMesh using the k-way partitioning algorithm. The time-resolved tetrahedron-based MC program, that is TR-TIM-OS, was written in C/C++ (Intel MKL 2009). All the simulations were performed on a cluster of eight nodes (eight CPU cores of 3.0 GHz and 16 GB RAM at each node).
3.1. Validation of SPN approximations with Monte Carlo simulation
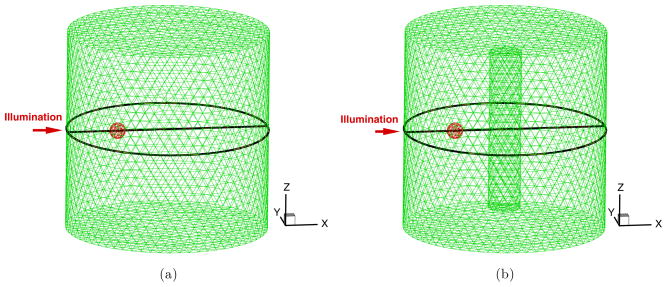
The validation studies were performed using a simulated cylindrical phantom of 12.5 mm radius and 25.0 mm height. The phantom was simulated to contain a single spherical fluorescent heterogeneity and a second non-fluorescent inclusion (figures 1(a) and (b)). The center of the phantom is located at the origin of the Cartesian coordinate. The phantom was discretized into a tetrahedron-based volumetric mesh with approximately 5900 nodes and the average element diameter of 1.2 mm. This mesh was used in the SPN- and MC-based simulations. The range of the launched photon numbers was from 107 to 108. With the increase of the absorption coefficient, the number of launched photons was increased to reduce simulated Poisson noise. A fluorescent spherical volume with 1.0 mm radius was simulated at the half-radius position (the center: (− 6.25, 0.0, 0.0)) as the single fluorescent domain. An area located at the height of 4.0 mm along the Z-axis subtending a circumferential angle of 11.2° was used as the uniform illumination area with its center along the negative x-axis. The absorption and scattering coefficients of the phantom were set to 0.005 mm−1 and 5.0 mm−1, respectively. The anisotropic factor and refractive index were 0.9 and 1.33, respectively. The absorption coefficient, lifetime and quantum efficient (QE) of the fluorophore were set to 0.0147 mm−1, 1.0 ns, and 0.016 consistent with available near-infrared fluorophores. The goal of fluorescence molecular imaging/tomography is to acquire the quantitative information of the fluorophores in the in vivo animal and human body; the two parameters collected were the excitation photon fluence distribution (φx(r), r ∈ Ω) in the body and the outgoing emission photon fluence ( , r ∈ ∂Ω).
Figure 1.
The discretized meshes of the used phantoms. The black circles and lines are for comparisons of the exiting partial current and the fluence φx. The red solid spheres represent fluorescent heterogeneities and the cylindrical inclusion is also represented.
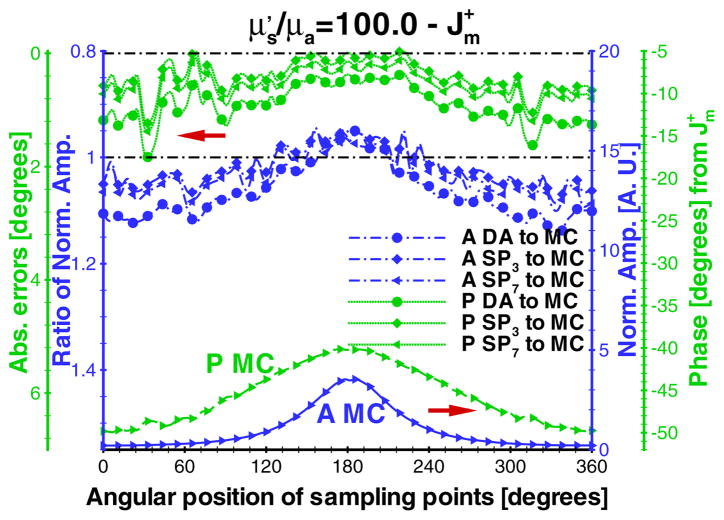
The comparison results of are shown in figure 2 for a modulation frequency of 100 MHz. The amplitudes obtained from SPN approximations and MC simulation were normalized with the average values of SP7 and MC methods, respectively. The absolute phase shift was used for the comparison. In order to demonstrate the difference between SPN approximations and MC simulation, their amplitude ratios and phase shift errors were calculated using ( ) and (PSPN − PMC), respectively. and are the normalized SPN and MC amplitude; PSPN and PMC are the corresponding absolute phase shift. Due to the effect of the Poisson noise of the MC simulation in , the values of the points far from the fluorophore have somewhat larger errors than those close to the fluorophore. However, the amplitude ratios and phase errors between several SPN approximations and MC are close, showing the accuracy of the in-house codes.
Figure 2.
Emission comparisons between the diffusion equation, Monte Carlo method and SPN approximations in the phantom (figure 1(a)) where μa = 0.005 mm−1, μs = 5.0 mm−1, g = 0.9 and nb = 1.33. The modulation frequency is 100 MHz. ‘A * to MC’ and ‘P * to MC’ denote the normalized amplitude ratios and the errors of the absolute phase shift between SPN and MC. Two dash-dot lines are 0 degree (top) and the ratio of ‘1’ (bottom).
3.2. Performance of SPN approximations
3.2.1. With varying ratios of to μa
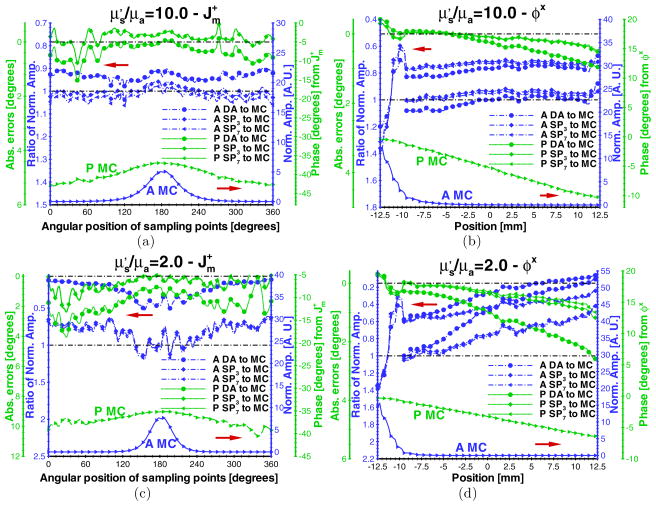
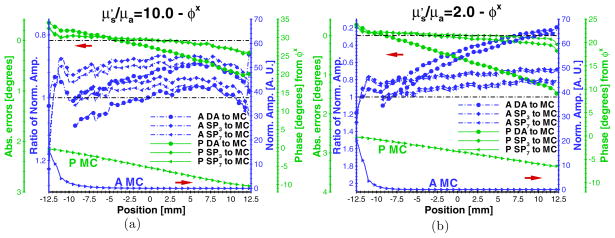
The performance evaluation of the SPN approximations in fluorescence molecular imaging was first performed with different ratios of to μa. When the absorption coefficient of the phantom was adjusted to 0.05 mm−1 with other parameters unchanged from those used in the accuracy validation, the comparison of and φx between several SPN approximations and MC was computed as shown in figures 3(a) and (b), respectively. At the ratio of to μa of 10, the difference of the amplitude ratios and phase errors between SP1, SP3 and SP7 becomes distinct as compared to when the ratio was set to 100 (figure 2). With the increase of the distance from the illumination area, the phase errors of φx gradually become large (~1.0°). Note that the simulated amplitudes near the source domain from all SPN approximations are inaccurate, resulting in the inaccuracy of the normalized amplitude ratios. The distance from the illumination area where this inaccuracy predominates extends about 3.0 mm in this case. When the amplitudes were re-normalized using the average values of φx that did not include values within this distance from the source, better accuracy of the SPN-based amplitudes occurs (figure 3(b)). In these simulations, the errors arise from both model mismatch and discretization. To further confirm the performance of SPN approximation in the near-source domain, a fine mesh consisting of approximately 46 000 nodes and having an average element length of 0.55 mm was used. Upon setting the ratios of to μa to 10.0 and 2.0 and launching 108 and 3 × 10⁸ photons, respectively, we observe that the errors are reduced as shown in figures 4(a) and (b). Although the phase shift errors are reduced and the amplitude ratio ranges are closer to ‘1.0’, the error and ratio trends are consistent with those using the coarse mesh. Furthermore, the inaccuracy of SPN approximation in the near-source domain remains.
Figure 3.
Comparisons of ((a) and (c)) and φx ((b) and (d)) between the diffusion equation, Monte Carlo method and SPN approximations in the homogeneous phantom when μs = 5.0 mm−1, g = 0.9 and nb = 1.33. The ratios of ((a) and (b)) and ((c) and (d)) are 10.0 and 2.0, respectively. The display settings are the same as those in figure 2.
Figure 4.
Comparisons of φx between the diffusion equation, Monte Carlo method and SPN approximations on the fine mesh of the homogeneous phantom when μs = 5.0 mm−1, g = 0.9 and nb = 1.33. The ratios of (a) and (b) are 10.0 and 2.0, respectively. The modulation frequency is 100 MHz. The display settings are the same as those in figure 2.
When the absorption coefficient of the phantom was set to 0.25 mm−1 (and the ratio of to μa is 2.0), the advantages of the high-order SPN approximations become more distinct as shown in figures 3(c) and (d). In this case, the amplitude and phase shift of and φx, computed from SP3 and SP7, contain the maximal amplitude ratio and phase errors that differ from MC by a factor of 0.4 and 2.0°, respectively. The comparable errors between SP1 and MC are 0.9 and 4.0°. The corresponding differences of φx between DA and high-order SPN approximations are also distinct as shown in figure 3(d). The inaccuracy becomes worse regarding SPN approximations with the increased distances from the fluorophore and illumination area. Note that near the source, the distance in which φx inaccuracy occurred did not change when the absorption coefficient of the phantom was adjusted from 0.05 mm−1 to 0.25 mm−1.
3.2.2. With varying modulation frequencies
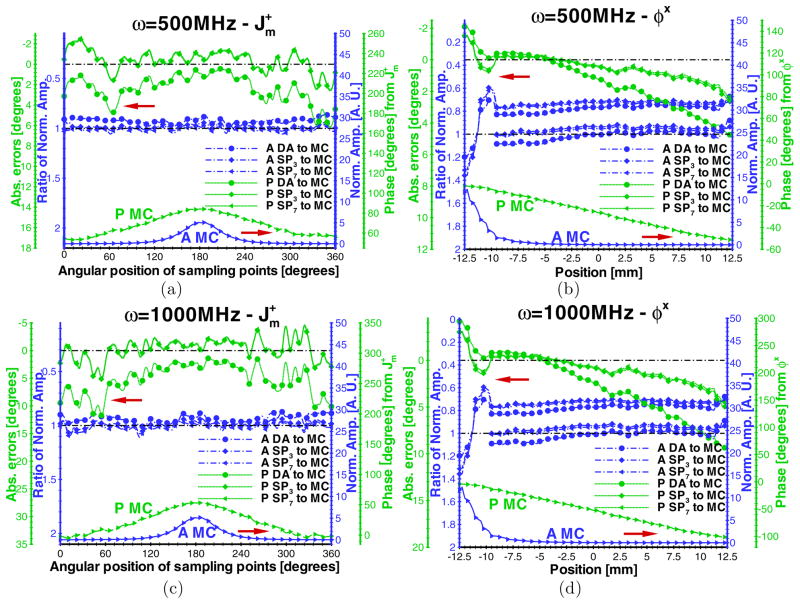
Although 100 MHz is the optimal modulation frequency for experimental measurements (Thompson and Sevick-Muraca 2003), higher modulation frequencies of 500 and 1000 MHz were considered to evaluate the performance of high-order SPN approximations. Figure 5 shows the comparison of SPN approximations and MC simulations when the absorption and scattering coefficients of the phantom were fixed to 0.05 and 5.0 mm−1, respectively. Similar accuracies of the excitation and emission amplitude at 100 MHz cases were obtained. However, the diffusion equation has inaccurate excitation and emission phase when compared with high-order SPN approximations. With the increase of the modulation frequency, the diffusion inaccuracy becomes worse. For , the maximal phase errors of SP3 and SP7 relative to MC are 2.0 and 4.0° at 500 and 1000 MHz, respectively. However, the counterparts of the diffusion equation reach 6.0 and 12.0°.
Figure 5.
Comparisons of ((a) and (c)) and φx ((b) and (d)) between the diffusion equation, Monte Carlo method and SPN approximations in the homogeneous phantom when μa = 0.05 mm−1, μs = 5.0 mm−1, g = 0.9 and nb = 1.33. The modulation frequencies are 500 MHz for (a) and (b) and 1000 MHz for (c) and (d). The display settings are the same as those in figure 2.
3.2.3. With inclusions of high absorption and void-like optical characteristics
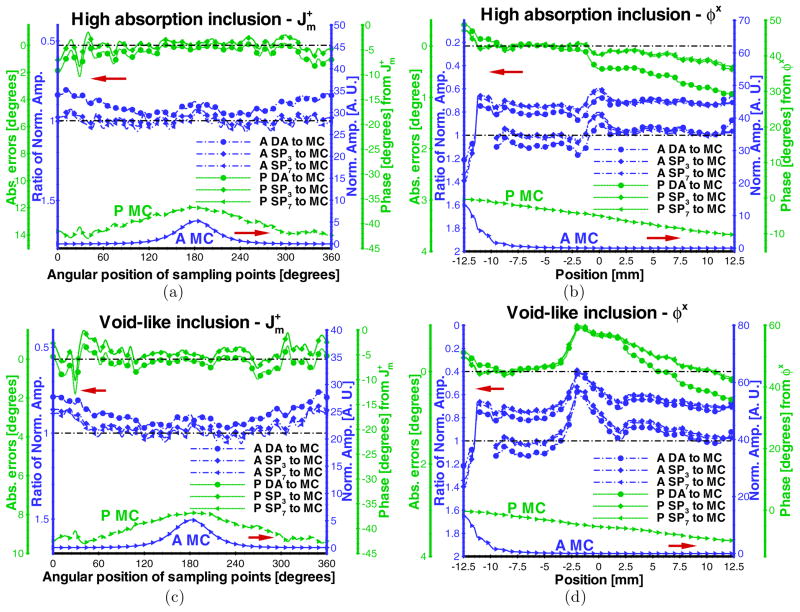
In practice, small animal fluorescence molecular imaging encounters organs of varying optical properties. The performance evaluation in heterogeneous domains is important. A cylindrical phantom with 2.0 mm radius and 20.0 mm height was simulated within the cylindrical homogeneous phantom. Its center was co-located with that of the homogeneous phantom. The discretized volumetric mesh is shown in figure 1(b), consisting of 6162 nodes. The same fluorophore properties with the validated homogeneous phantom case were used in this evaluation. The optical properties of the surrounding continuous volume were set to 0.05 (μa) and 5.0 mm−1 (μs), respectively. The optical properties of the inclusion were set to 0.25 (μa) and 5.0 mm−1 (μs), to simulate the high-absorption domain. As shown in figures 6(a) and (b), there is little effect of the high-absorption domain in values of computed from the SPN approximations. However, φx of several SPN approximations are inaccurate in the simulated phantom containing the high-absorption region, significantly affecting the quantitative information acquisition of the fluorophore. Note that there is little effect in the phase shift compared with the emission amplitude.
Figure 6.
Comparisons of ((a) and (c)) and φx ((b) and (d)) between the Monte Carlo method and SPN approximations in phantoms containing high absorption and void-like inclusions. μa, μs, g, and nb of the surrounding continuous volume of the phantom are fixed to 0.05 mm−1, 5.0 mm−1, 0.9, and 1.33, respectively. μa and μs of the small cylindrical inclusion are set to 0.25 mm−1 and 5.0 mm−1 (high absorption), and 0.005 mm−1 and 0.1 mm−1 (void-like), respectively. The modulation frequency is 100.0 MHz. The display settings are the same as those in figure 2.
For the void-like case, the simulated inclusion was set as a low-scattering domain with a scattering coefficient of 0.1 mm−1 and the high ratio of and μa equal to 20.0. The comparison of MC and SPN approximations of and φx is shown in figures 6(c) and (d). Similar to the high-absorption inclusion, low-scattering inclusions appreciably impact even though φx is inaccurate compared to MC simulation.
4. Evaluation of the parallel adaptive finite element strategy on a simulated mouse
As the final evaluation of the proposed algorithm, the microMRI-based mouse volume (MOBY) (Segars et al 2004) was investigated for accuracy and computational performance. Amira 5.2 (Visage Imaging, Inc., San Diego, CA) was used to obtain the discretized mesh of MOBY. The coarse and fine meshes, consisting of approximately 21 000 and 230 000 discretized points, respectively, were generated for adaptive mesh evolution and the acquisition of the precise solution. Most organs were depicted in the discretized mesh as described along with assigned optical properties in table 1, reproduced from Alexandrakis et al (2005). To represent a fluorescent heterogeneity, a cubic domain with volume of 15.6 mm3 was simulated within the liver. The optical parameters of the fluorophore were the same with those used in the cylindrical phantom. The illumination area was simulated as a triangular element near the x-axis on the mouse surface. In order to observe the performance of the adaptive mesh evolution as a function of SPN, the solutions were obtained from the SP3 and SP7 approximations of the excitation light only. Because emission and excitation solutions are solved on independently adapted meshed and require accurate interpolation schemes (for example see Lee et al (2008)), we focus only on the effect of SPN approximation order on adaptive meshes in the simulation precision. Future work will address independently adapted meshing.
Table 1.
Optical properties of organs of the MOBY mouse phantom at 700 nm.
| μa (mm−1) | μs (mm−1) | g | n | |
|---|---|---|---|---|
| Heart | 0.038 | 9.05 | 0.9 | 1.33 |
| Liver | 0.23 | 6.48 | 0.9 | 1.33 |
| Lung | 0.13 | 21.24 | 0.9 | 1.33 |
| Stomach | 0.0077 | 13.77 | 0.9 | 1.33 |
| Pancreas | 0.043 | 21.09 | 0.9 | 1.33 |
| Kidney | 0.043 | 21.09 | 0.9 | 1.33 |
| Spleen | 0.23 | 6.48 | 0.9 | 1.33 |
| Intestine | 0.0078 | 10.88 | 0.9 | 1.33 |
| Bone | 0.039 | 23.40 | 0.9 | 1.33 |
| Brain | 0.0027 | 11.80 | 0.9 | 1.33 |
| Bladder | 0.0027 | 11.80 | 0.9 | 1.33 |
| Muscle | 0.0027 | 11.80 | 0.9 | 1.33 |
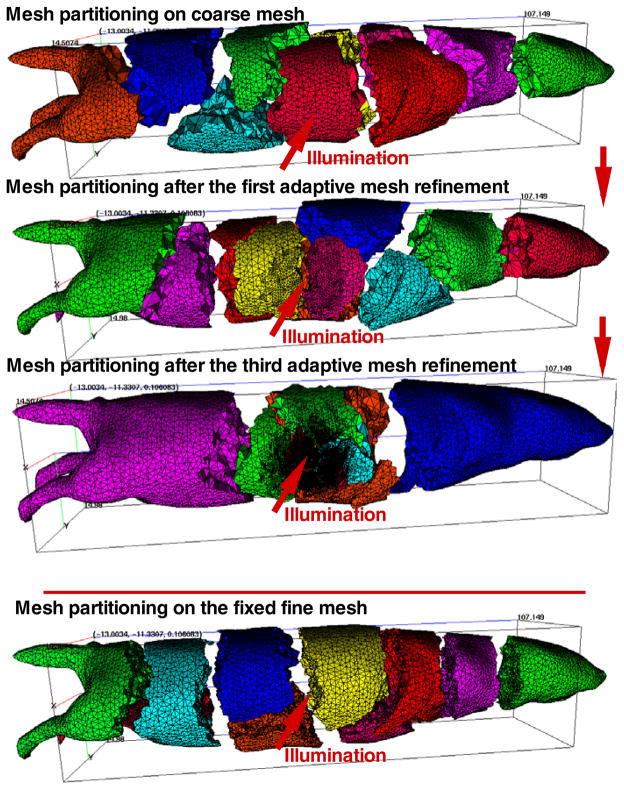
The dynamic mesh partitioning and adaptive mesh evolution are shown in figure 7 when ten domains and ten CPUs were used in the parallel adaptive simulation. To guarantee the same number of the final discretized points in SP3- and SP7-based simulation, the refinement ratio γr was set to 99.9% and 99.91%, respectively, and both of the coarsening ratios γc were set to 0.0%. Upon comparing the initial partitioned mesh and the counterparts after the first and third adaptive mesh refinements (figure 7), one finds that the subdomains for CPUs were almost totally different due to the adaptive mesh evolution. If the initial partitioning mesh was used for the entire simulation, the load imbalance would significantly impair the simulation performance. It is noteworthy that because the larger errors exist in the proximity of the illumination area, mesh refinements were performed primarily in the vicinity of the triangular surface element.
Figure 7.
Dynamic mesh partitioning and evolution and the fine mesh partitioning.
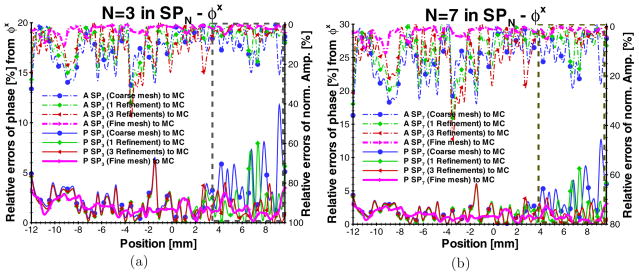
After the SP3-, SP7- and MC-based simulation results were acquired on the fine mesh of the MOBY, the amplitude and phase shift profiles of φx along the X-axis transecting the fluorophore domain were obtained by the interpolation. The relative errors of the normalized amplitude and phase shift were calculated using and |P SPN − PMC |/|PMC | as shown in figure 8. To remove the effect of the inaccuracy of SP3 and SP7 in the near-source domain, the φx values within the range of 3.0 mm far from the illumination were not considered in the comparisons. Compared to the solution on the fine mesh, the solutions of the excitation amplitude and phase shift of SP3 and SP7 close to the illumination are significantly improved due to the adaptive mesh evolution. Note that there are several spikes in the comparisons. We believe the spikes are from the poor discretization and element quality since they are not observed from the solution on the fine mesh.
Figure 8.
Comparisons of φx between SP3, SP7 and the Monte Carlo method in the digital mouse phantom (MOBY). The modulation frequency is 100 MHz. ‘A SP3,7 (*) to MC’ and ‘P SP3,7 (*) to MC’ denote the relative errors of the excitation amplitude and phase shift on different fixed and adaptively refined meshes. The dash-dot rectangles are used to show the part of the significant error reduction due to the adaptive mesh evolution.
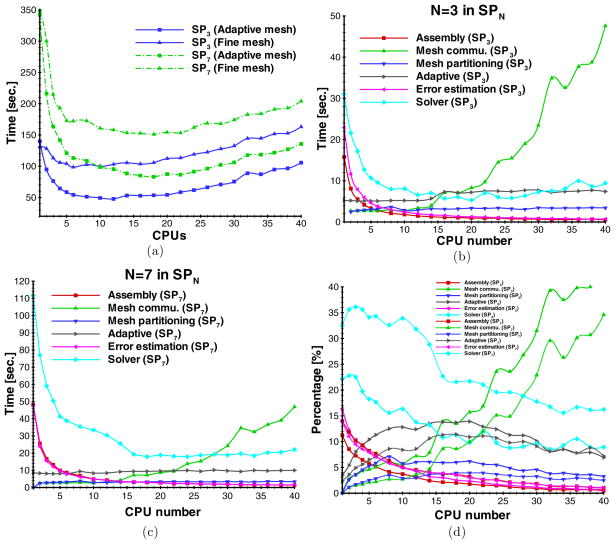
To further observe the performance of the proposed algorithm, the computational time as a function of CPUs is shown in figure 9. For the SP3- and SP7-based simulations on the adaptive and fixed fine meshes, the parallel implementation significantly improves the simulation speed although the simulation is not always accelerated with the increasing CPU number. The maximal acceleration ratios for fixed fine meshes were 1.27 and 2.31 for SP3 and SP7, respectively. The maximal acceleration ratios for adaptively refined meshes were 2.93 and 4.13 for SP3 and SP7, respectively. These results show that the acceleration ratio is more positively impacted by adaptive mesh evolution for SP7 than SP3. However, higher order approximations take more CPUs (10 and 18 CPUs for SP3 and SP7, respectively).
Figure 9.
Time analysis of SP3- and SP7-based simulation using the MOBY phantom. (a) The total cost time of the SP3 and SP7 approximations. (b) (SP3) and (c) (SP7) denote the cost time of the submodules of the parallel adaptive finite element simulation. (d) The time percentage of the submodules in the total cost time for SP3 and SP7.
The computational time of several modules that perform specific computational tasks, matrix assembly, mesh communication, mesh partitioning, mesh adaptive, error estimation and solver, were considered to analyze performance bottleneck. Figures 9(b) and (c) illustrate the computational time as a function of number of CPUs for SP3 and SP7, respectively. Although the time costs of several modules (matrix assembly, error estimation and solver) are quickly reduced at the beginning, the improvement of the time cost decreases after an optimal CPU number. In contrast, mesh communication becomes worse with the increased number of CPU due to the more frequent communication between CPUs. Furthermore, figure 9(d) shows the percentage of several modules in the total simulation time. Mesh communication and solver are the major time-consuming modules especially with the increase of the approximation degree. Significant improvement can be obtained by the acceleration of solver.
5. Summary and conclusion
Herein, a parallel adaptive finite element simulation algorithm is developed with the radiative-transfer-based model for frequency domain fluorescence molecular imaging. To demonstrate the performance of high-order SPN approximations, the time-resolved tetrahedron-based Monte Carlo fluorescence simulator is developed, suitable for complex heterogeneous geometries and arbitrary-shaped illumination. The comparison results show that high-order SPN approximations may obtain more precise simulation in the high-absorption and high-frequency cases compared with the popular diffusion approximation. The strategy of the parallel adaptive mesh evolution further accelerates the simulation and improves the simulation precision especially when higher order SPN approximations are applied. The proposed simulation algorithm provides a possible solution for fast and quantitative fluorophore reconstruction for fluorescence molecular tomography at the whole-body small animal level.
Although the radiative transfer equation can provide more accurate solutions, the cost may prevent its use within iterative inverse solutions. For accurate quantitation in drug discovery, suitable high-order approximations may be necessary. As a consequence, optimizing performance of higher order approximations become necessary in order to realize reconstruction accuracy. This paper systematically demonstrates accuracy improvements compared with the diffusion equation and developed Monte Carlo methods. The time cost of SP7 approximation makes the SP3 approximation an optimal choice for conditions in which small animal imaging is conducted. However, the poor performance of SPN approximations in near-source and void-like regions makes the development and investigation of more advanced high-order approximations necessary.
Precise and fast simulation can be obtained using a fully parallel adaptive mesh evolution strategy. The performance evaluation shows that the time improvement of higher order SPN approximations obtained from the proposed algorithm becomes more distinct compared with sequential implementation, providing a powerful computational platform for radiative-transfer-based simulation. However, the distributed memory-based parallel simulation exhibits a performance bottleneck especially when a great number of CPUs are used. With the increase of the approximation degree of radiative-transfer-based model, it is necessary to obtain optical simulation performance by increasing the CPU number. The development of current multi-core techniques makes the hybrid threaded-MPI parallel mode possible, potentially improving the simulation performance for the high-order radiative-transfer-based model. Module solver becomes a time-consuming phase especially for higher order approximation. Note that the acceleration becomes slow when the CPUs reach a certain number. To improve the parallel simulation performance, more advanced preconditioners and iterative techniques need to be investigated.
In conclusion, we have developed a fully parallel adaptive finite element algorithm for fluorescent photon propagation simulation using high-order radiative-transfer-based models. The fully performance evaluations show the advantages and limits of SPN approximations and the developed parallel simulation framework. Optimal improvements can be further investigated in future research. Currently, using dual-labeled near-infrared fluorescence and PET traces, we are developing methods to assess the quantitative algorithm by comparing it to established PET.
Acknowledgments
We thank Dr Tianshu Pan for the significant discussion on the frequency-domain problem and Robert Haacke for his assistance in the Cluster. We are grateful to the development teams of libMesh and PETSc for discussions. This work is supported by NIH R01CA135673 and U54CA136404 (Sevick), and NIH R01HL098912 (Wang).
Nomenclature
- Ω, ∂Ω
domain and its boundary
- r
position vector
- ŝ, ŝ′
outgoing and incoming directions of photons
- ω
modulation frequency
- ψx,m
excitation (x) and emission (m) radiances
- , g
absorption and scattering coefficients, and anisotropy factor of the domain at excitation and emission wavelengths
absorption coefficient of the fluorophore
- cb
light speed in the domain Ω
- p(·)
scattering phase function
- Q,τ
quantum efficiency and lifetime of the fluorophore
- cos θ
scattering angle
- φx,m
excitation and emission fluence
- nb, nm
refractive indices of the domain Ω and the medium
- S
illumination source
- R(·)
reflectivity ratio
- θb, θm, θc
incidence, transmission and critical angle
exiting partial current at excitation and emission wavelengths
- γn,ϕn
Legendre moments of ψ and composite moments of γn
coefficients of SPN approximations at excitation and emission wavelengths
coefficients of illumination source of SPN approximations
coefficients of boundary conditions at excitation and emission wavelengths
-
 ,
, 
volumetric mesh and its subdomain
-
Nc,
 ,
, 
number of CPUs, nodes of the mesh, elements in

- τe,∂τe
volumetric and surface elements
value at node p at the l-th mesh
basis function in FEM
submatrix and subvector at τe
submatrix and subvector at

error indicator
- wi,
weighted factor and local residual
- γr, γc
refinement and coarsening ratios
group of triangles for illumination and emission measurements, group of tetrahedra for fluorephore
- rdi
uniformly random number
sampled point on the surface for excitation
- sx,m
step size of photon trajectory
- Δtx,m
traveling time corresponding to sx,m
simulation time for excitation and emission wavelengths
- ΔtMC
Δtx,m, time step and travel time of photons
time-resolved excitation and emission fluences
time-resolved artificial emission fluence
References
- Alexandrakis G, Rannou FR, Chatziioannou AF. Tomographic bioluminescence imaging by use of a combined optical-PET (OPET) system: a computer simulation feasibility study. Phys Med Biol. 2005;50:4225–41. doi: 10.1088/0031-9155/50/17/021. [DOI] [PMC free article] [PubMed] [Google Scholar]
- Balay S, Buschelman K, Gropp WD, Kaushik D, Knepley MG, McInnes LC, Smith BF, Zhang H. PETSc web page. 2001 http://www.mcs.anl.gov/petsc.
- Boas D, Culver J, Stott J, Dunn A. Three dimensional Monte Carlo code for photon migration through complex heterogeneous media including the adult human head. Opt Express. 2002;10:159–70. doi: 10.1364/oe.10.000159. [DOI] [PubMed] [Google Scholar]
- Carey GF. Computational Grids: Generation, Adaptation, and Solution Strategies. London: Taylor and Francis; 1997. [Google Scholar]
- Chaudhari AJ, Darvas F, Bading JR, Moats RA, Conti PS, Smith DJ, Cherry SR, Leahy RM. Hyperspectral and multispectral bioluminescence optical tomography for small animal imaging. Phys Med Biol. 2005;50:5421–41. doi: 10.1088/0031-9155/50/23/001. [DOI] [PubMed] [Google Scholar]
- Cherry SR. In vivo molecular and genomic imaging: new challenges for imaging physics. Phys Med Biol. 2004;49:R13–48. doi: 10.1088/0031-9155/49/3/r01. [DOI] [PubMed] [Google Scholar]
- Cho J, Taschereau R, Olma S, Liu K, Chen Y, Shen C, van Dam R, Chatziioannou A. Cerenkov radiation imaging as a method for quantitative measurements of beta particles in a microfluidic chip. Phys Med Biol. 2009;54:6757–71. doi: 10.1088/0031-9155/54/22/001. [DOI] [PMC free article] [PubMed] [Google Scholar]
- Chu M, Vishwanath K, Klose AD, Dehghani H. Light transport in biological tissue using three-dimensional frequency-domain simplified spherical harmonics equations. Phys Med Biol. 2009;54:2493–509. doi: 10.1088/0031-9155/54/8/016. [DOI] [PubMed] [Google Scholar]
- Cong W, Cong A, Shen H, Liu Y, Wang G. Flux vector formulation for photon propagation in the biological tissue. Opt Lett. 2007;32:2837–9. doi: 10.1364/ol.32.002837. [DOI] [PubMed] [Google Scholar]
- Cong W, et al. Practical reconstruction method for bioluminescence tomography. Opt Express. 2005;13:6756–71. doi: 10.1364/opex.13.006756. [DOI] [PubMed] [Google Scholar]
- Contag CH, Bachmann MH. Advances in bioluminescence imaging of gene expression. Annu Rev Biomed Eng. 2002;4:235–60. doi: 10.1146/annurev.bioeng.4.111901.093336. [DOI] [PubMed] [Google Scholar]
- Dehghani H, Davis SC, Jiang S, Pogue BW, Paulsen KD, Patterson MS. Spectrally resolved bioluminescence optical tomography. Opt Lett. 2006;31:365–7. doi: 10.1364/ol.31.000365. [DOI] [PubMed] [Google Scholar]
- Gibson AP, Hebden JC, Arridge SR. Recent advances in diffuse optical imaging. Phys Med Biol. 2005;50:R1–R43. doi: 10.1088/0031-9155/50/4/r01. [DOI] [PubMed] [Google Scholar]
- Godavarty A, Eppstein M, Zhang C, Theru S, Thompson A, Gurfinkel M, Sevick-Muraca E. Fluorescence-enhanced optical imaging in large tissue volumes using a gain-modulated ICCD camera. Phys Med Biol. 2003;48:1701–20. doi: 10.1088/0031-9155/48/12/303. [DOI] [PubMed] [Google Scholar]
- Godavarty A, Thompson A, Roy R, Gurfinkel M, Eppstein M, Zhang C, Sevick-Muraca E. Diagnostic imaging of breast cancer using fluorescence-enhanced optical tomography: phantom studies. J Biomed Opt. 2004;9:488. doi: 10.1117/1.1691027. [DOI] [PubMed] [Google Scholar]
- Gu X, Kim H, Masciotti J, Hielscher A. A parallel reduced-space sequential-quadratic programming algorithm for frequency-domain small animal optical tomography. Proc SPIE. 2009;7174:717406. [Google Scholar]
- Haskell RC, Svaasand LO, Tsay T-T, Feng T-C, McAdams MS, Tromberg BJ. Boundary conditions for the diffusion equation in radiative transfer. J Opt Soc Am A. 1994;11:2727. doi: 10.1364/josaa.11.002727. [DOI] [PubMed] [Google Scholar]
- Herschman HR. Molecular imaging: looking at problems, seeing solutions. Science. 2003;302:605–8. doi: 10.1126/science.1090585. [DOI] [PubMed] [Google Scholar]
- Intel Math Kernel Library Reference Manual. 2009 http://software.intel.com/en-us/articles/intel-math-kernellibrary-documentation/
- Ishimaru A. Wave Propagation and Scattering in Random Media. Piscataway, NJ: IEEE Press; 1997. [Google Scholar]
- Joshi A, Bangerth W, Sevick-Muraca EM. Adaptive finite element based tomography for fluorescence optical imaging in tissue. Opt Express. 2004;12:5402–17. doi: 10.1364/opex.12.005402. [DOI] [PubMed] [Google Scholar]
- Joshi A, Bangerth W, Sevick-Muraca EM. Non-contact fluorescence optical tomography with scanning patterned illumination. Opt Express. 2006;14:6516–34. doi: 10.1364/oe.14.006516. [DOI] [PubMed] [Google Scholar]
- Joshi A, Rasmussen J, Sevick-Muraca E, Wareing T, McGhee J. Radiative transport-based frequency-domain fluorescence tomography. Phys Med Biol. 2008;53:2069–88. doi: 10.1088/0031-9155/53/8/005. [DOI] [PMC free article] [PubMed] [Google Scholar]
- Karypis G, Kumar V. Multilevel k-way partitioning scheme for irregular graphs. J Parallel Distrib Comput. 1998;48:96–129. [Google Scholar]
- Kelly DWR, Gago JPDS, Zienkiewicz OC, Babuska I. A posteriori error analysis and adaptive processes in the finite element method: part i. Error analysis. Int J Numer Methods Eng. 1983;19:1593–619. [Google Scholar]
- Kirk B, Peterson JW, Stogner RH, Carey GF. libMesh: a C++ library for parallel adaptive mesh refinement/coarsening simulations. Eng Comput. 2006;22:237–54. [Google Scholar]
- Kirk BS. PhD thesis. The University of Texas; Austin: 2007. Adaptive finite element simulation of flow and transport applications on parallel computers. [Google Scholar]
- Klose A, Beattie B, Dehghani H, Vider L, Le C, Ponomarev V, Blasberg R. In vivo bioluminescence tomography with a blocking-off finite-difference SP3 method and MRI/CT coregistration. Med Phys. 2010;37:329. doi: 10.1118/1.3273034. [DOI] [PMC free article] [PubMed] [Google Scholar]
- Klose AD, Larsen EW. Light transport in biological tissue based on the simplified spherical harmonics equations. J Comput Phys. 2006;220:441–70. [Google Scholar]
- Klose AD, Ntziachristos V, Hielscher AH. The inverse source problem based on the radiative transfer equation in optical molecular imaging. J Comput Phys. 2005;202:323–45. [Google Scholar]
- Kuo C, Coquoz O, Troy TL, Xu H, Rice BW. Three-dimensional reconstruction of in vivo bioluminescent sources based on multispectral imaging. J Biomed Opt. 2007;12:024007. doi: 10.1117/1.2717898. [DOI] [PubMed] [Google Scholar]
- Lee J, Joshi A, Sevick-Muraca E. Fast intersections on nested tetrahedrons (FINT): an algorithm for adaptive finite element based distributed parameter estimation. J Comput Phys. 2008;227:5778–98. doi: 10.1016/j.jcp.2008.02.008. [DOI] [PMC free article] [PubMed] [Google Scholar]
- Lewis EE, Warren F, Miller J. Computational Methods of Neutron Transport. New York: Wiley; 1984. [Google Scholar]
- Li X, Chance B, Yodh A. Fluorescent heterogeneities in turbid media: limits for detection, characterization, and comparison with absorption. Appl Opt. 1998;37:6833–44. doi: 10.1364/ao.37.006833. [DOI] [PubMed] [Google Scholar]
- Lu Y, Chatziioannou A. A parallel adaptive finite element method for the simulation of photon migration with the radiative-transfer-based model. Commun Numer Methods Eng. 2009;25:751–770. doi: 10.1002/cnm.1167. [DOI] [PMC free article] [PubMed] [Google Scholar]
- Lu Y, Douraghy A, Machado H, Stout D, Tian J, Herschman H, Chatziioannou A. Spectrally resolved bioluminescence tomography with the third-order simplified spherical harmonics approximation. Phys Med Biol. 2009a;54:6477–93. doi: 10.1088/0031-9155/54/21/003. [DOI] [PMC free article] [PubMed] [Google Scholar]
- Lu Y, Machado HB, Douraghy A, Stout D, Herschman H, Chatziioannou AF. Experimental bioluminescence tomography with fully parallel radiative-transfer-based reconstruction framework. Opt Express. 2009b;17:16681–95. doi: 10.1364/OE.17.016681. [DOI] [PMC free article] [PubMed] [Google Scholar]
- Lv Y, Tian J, Cong W, Wang G, Luo J, Yang W, Li H. A multilevel adaptive finite element algorithm for bioluminescence tomography. Opt Express. 2006;14:8211–23. doi: 10.1364/oe.14.008211. [DOI] [PubMed] [Google Scholar]
- Massoud TF, Gambhir SS. Molecular imaging in living subjects: seeing fundamental biological processes in a new light. Genes Dev. 2003;17:545–80. doi: 10.1101/gad.1047403. [DOI] [PubMed] [Google Scholar]
- Pan T, Rasmussen J, Lee J, Sevick-Muraca E. Monte Carlo simulation of time-dependent, transport-limited fluorescent boundary measurements in frequency domain. Med Phys. 2007;34:1298. doi: 10.1118/1.2710549. [DOI] [PubMed] [Google Scholar]
- Patwardhan S, Bloch S, Achilefu S, Culver J. Time-dependent whole-body fluorescence tomography of probe bio-distributions in mice. Opt Express. 2005;13:2564–77. doi: 10.1364/opex.13.002564. [DOI] [PubMed] [Google Scholar]
- Rao SS. The Finite Element Method in Engineering. Boston, MA: Butterworth-Heinemann; 1999. [Google Scholar]
- Rasmussen J, Joshi A, Pan T, Wareing T, McGhee J, Sevick-Muraca E. Radiative transport in fluorescence-enhanced frequency domain photon migration. Med Phys. 2006;33:4685. doi: 10.1118/1.2388572. [DOI] [PubMed] [Google Scholar]
- Rasmussen J, Tan I, Marshall M, Fife C, Sevick-Muraca E. Lymphatic imaging in humans with near-infrared fluorescence. Curr Opin Biotechnol. 2009;20:74–82. doi: 10.1016/j.copbio.2009.01.009. [DOI] [PMC free article] [PubMed] [Google Scholar]
- Robertson R, Germanos M, Li C, Mitchell G, Cherry S, Silva M. Optical imaging of Cerenkov light generation from positron-emitting radiotracers. Phys Med Biol. 2009;54:N355–65. doi: 10.1088/0031-9155/54/16/N01. [DOI] [PMC free article] [PubMed] [Google Scholar]
- Rocchini C, Cignoni P. Generating random points in a tetrahedron. J Graph Tools. 2000;5:9–12. [Google Scholar]
- Segars WP, Tsui BMW, Frey EC, Johnson GA, Berr SS. Development of a 4D digital mouse phantom for molecular imaging research. Mol Imaging Biol. 2004;6:149–59. doi: 10.1016/j.mibio.2004.03.002. [DOI] [PubMed] [Google Scholar]
- Sevick-Muraca E, Houston J, Gurfinkel M. Fluorescence-enhanced, near infrared diagnostic imaging with contrast agents. Curr Opin Chem Biol. 2002;6:642–50. doi: 10.1016/s1367-5931(02)00356-3. [DOI] [PubMed] [Google Scholar]
- Sevick-Muraca E, Lopez G, Reynolds J, Troy T, Hutchinson C. Fluorescence and absorption contrast mechanisms for biomedical optical imaging using frequency-domain techniques. Photochem Photobiol. 1997;66:55. doi: 10.1111/j.1751-1097.1997.tb03138.x. [DOI] [PubMed] [Google Scholar]
- Sevick-Muraca E, et al. Imaging of lymph flow in breast cancer patients after microdose administration of a near-infrared fluorophore: feasibility study. Radiology. 2008;246:734. doi: 10.1148/radiol.2463070962. [DOI] [PMC free article] [PubMed] [Google Scholar]
- Shen H, Wang G. A tetrahedron-based inhomogeneous Monte Carlo optical simulator. Phys Med Biol. 2010;55:947–62. doi: 10.1088/0031-9155/55/4/003. [DOI] [PMC free article] [PubMed] [Google Scholar]
- Shu X, Royant A, Lin M, Aguilera T, Lev-Ram V, Steinbach P, Tsien R. Mammalian expression of infrared fluorescent proteins engineered from a bacterial phytochrome. Science. 2009;324:804. doi: 10.1126/science.1168683. [DOI] [PMC free article] [PubMed] [Google Scholar]
- Swartling J, Pifferi A, Enejder A, Andersson-Engels S. Accelerated Monte Carlo models to simulate fluorescence spectra from layered tissues. J Opt Soc Am A. 2003;20:714–27. doi: 10.1364/josaa.20.000714. [DOI] [PubMed] [Google Scholar]
- Thompson A, Sevick-Muraca E. Near-infrared fluorescence contrast-enhanced imaging with intensified charge-coupled device homodyne detection: measurement precision and accuracy. J Biomed Opt. 2003;8:111. doi: 10.1117/1.1528205. [DOI] [PubMed] [Google Scholar]
- Turk G. Graphics Gems. New York: Academic; 1990. Generating random points in triangles; p. 28. [Google Scholar]
- Wang G, Li Y, Jiang M. Uniqueness theorems in bioluminescence tomography. Med Phys. 2004;31:2289–99. doi: 10.1118/1.1766420. [DOI] [PubMed] [Google Scholar]
- Wang L, Jacques SL, Zheng L. —Monte Carlo modeling of photon transport in multi-layered tissues. Comput Methods Prog Biomed. 1995;47:131–46. doi: 10.1016/0169-2607(95)01640-f. [DOI] [PubMed] [Google Scholar]
- Weissleder R. Molecular imaging: exploring the next frontier. Radiology. 1999;212:609–14. doi: 10.1148/radiology.212.3.r99se18609. [DOI] [PubMed] [Google Scholar]
- Yuan Z, Hu X, Jiang H. A higher order diffusion model for three-dimensional photon migration. Phys Med Biol. 2009;54:65–88. doi: 10.1088/0031-9155/54/1/005. [DOI] [PubMed] [Google Scholar]


