Abstract
This paper presents a novel mathematical model of alveoli, which simulates the effects of tissue elasticity and surfactant on the stability of human alveoli. The model incorporates a spherical approximation to the alveolar geometry, the hysteretic behavior of pulmonary surfactant and tissue elasticity. The model shows that the alveolus without surfactant and the elastic properties of the lung tissue are always at an unstable equilibrium, with the capability both to collapse irreversibly and to open with infinite volume when the alveolus has small opening radii. During normal tidal breathing, the alveolus can becomes stable, if surfactant is added. Including the passive effect of tissue elasticity stabilizes the alveolus, further allowing the alveoli to be stable, even for lung volumes below residual volume. The model is the first to describe the combined effects of tissue elasticity and surfactant on alveolar stability. The model may be used as an integrated part of a more comprehensive model of the respiratory system, since it can predict opening pressures of alveoli.
Keywords: alveolar collapse, surfactant model, pressure-volume hysteresis, surface tension
artificial ventilation with small tidal volumes (Vt) has been shown to reduce mortality in patients with acute respiratory distress syndrome (ARDS) (38). Presumably, this must be ascribed to a prevention of ventilator-induced lung injury (VILI) (12), a hypothesis that is supported by the finding of a smaller inflammatory response in patients ventilated using a lung-protective strategy with small Vt values (30). A recent animal study showed that small Vt ventilation at low lung volumes was injurious, causing a significant increase in proinflammatory cytokines compared with animals ventilated at larger lung volumes using positive end-expiratory pressure (PEEP) (8). However, two recent clinical trials comparing ventilator strategies using small Vt and either low or high PEEP failed to demonstrate any significant differences in mortality between low and high PEEP groups (23, 24). An explanation of these controversial results has remained elusive, with one of the impediments being a poor understanding of the mechanical behavior of alveoli during mechanical ventilation. One hypothesis is that VILI is mainly due to mechanical strain on the alveoli, caused by repetitive closing and opening or by overdistension of neighboring alveoli (7), but it remains uncertain under which circumstances, if any, alveoli will close. The mechanical properties are, to a large extent, determined by the surfactant lining the alveoli. Laplace's law dictates that, for a spherical alveolus, the pressure exerted by the surface tension increases as the radius of the alveolus goes down. This holds the potential for instability in the sense that the pressure-volume (PV) curve for alveoli may have negative slopes, leading to a behavior in which alveoli are unstable and may suddenly pop open or closed (39, 44).
It was originally suggested by Clements et al. (9) that surfactant serves to stabilize the alveoli, and the passive elastic properties of the lung tissue may play a similar role. Experimental and theoretical studies (4, 21, 32, 39) indicate that lipid phase transitions provide the surfactant monolayer lining the alveolar surface with mechanical properties that are suitable for stabilizing the alveoli. These mechanical properties display marked hysteresis, which is compatible with the hysteresis of the PV curve observed during inspiration and expiration. Indeed, pulmonary surfactant deficiency or inhibition may play an important role in the development of VILI (49).
Several theoretical models have been used to investigate the properties of pulmonary surfactant and mechanics (16, 20, 27, 28, 29, 34, 43, 47). The majority of these models have focused on either the hysteretic properties of pulmonary surfactant alone (16, 20, 27, 28) or a combination of lung tissue properties and surfactant, ignoring surfactant hysteretic behavior (e.g., Ref. 34, 43, 47). However, to the best of the authors' knowledge, only Trauble et al. (39) investigated under which conditions alveoli show instable behavior, and this was performed using a model neglecting lung tissue properties.
The purpose of this paper is to explore theoretically under which conditions an alveolus will show instability, when subjected to a range of transmural pressures (Ptm). The mathematical model developed will use a simple geometry for the alveolus, where individual alveoli are inflated through a rigid ring (43). The Ptm, resisting inflation, will be considered to consist of a contribution due to passive elastic properties of the lung tissue (34), plus a contribution from the surfactant, including its hysteretic behavior (21).
METHODS
The presented model has been implemented in MATLAB (The Mathworks, Natick, MA).
The alveolar model has three components: 1) a geometric model of the alveoli, 2) a model of the surfactant, and 3) a model of tissue passive elastic properties.
A geometric model of an alveolus.
The alveolar form was suggested by Valberg and Brain (43) to be a “honeycomb”, where the surface of an alveolus has a polyhedral shape. We make the assumption that the shape can be approximated by a sphere, inflated through a ring, which is considerably stiffer than the walls of the alveolus due to the presence of collagen fibers and smooth muscle (19). According to this model, the alveolus is a flat surface spanning the rigid ring at zero alveolar Ptm. During inflation, it becomes saucer shaped (Fig. 1A), a hemisphere (Fig. 1B), and, finally, almost spherical (Fig. 1C).
Fig. 1.
Schematic representation of an alveolus, assuming that the circumference of the alveolar opening is constant. A: saucer shaped. B: a hemisphere. C: spherical. a, Alveolar opening radius; r, radius of the alveolus; b, height of the alveolus; Va, alveolar volume.
The volume included in the alveolus (Va) can be calculated using the geometric formula (35):
| (1) |
where b is the height of the alveolus, and r is the radius of the alveolus.
The surface area of the alveolus (AA) can be calculated as (35):
| (2) |
where a is the length of the opening radius (Fig. 1). From Eq. 2, r can be isolated, as a function of a and b:
| (3) |
Thus, if a and b are known, r can be calculated along with the Va (Eq. 1) and AA (Eq. 2).
The alveolar Ptm.
The alveolar Ptm is defined as the difference between the pressure inside the alveolus (Pa) and the hydrostatic pressure (Pl) exerted by the tissue surrounding the alveolus as defined in Eq. 4.
| (4) |
In the lungs, Pl will increase down the lungs due to the weight of the lung tissue. This paper focuses on the behavior of individual alveoli, and the Ptm seen by an alveolus will, therefore, be considered the independent variable.
For a given alveolus, Ptm must be counterbalanced by the mechanical properties of the alveolus, and it is assumed that these mechanical properties have two components: an elastic component due to alveolar wall, and a component due to the surface tension of the alveolar air-liquid interface. It is assumed that:
| (5) |
where PE is the pressure exerted by the elasticity of the lung tissue, and PS is the recoil pressure due to surface tension. We will assume that the pressure PS due to the surface tension γ of the alveolar air-liquid interface can be calculated from Laplace's law, as stated in Eq. 6.
| (6) |
where r is the radius of a sphere inscribed in alveolar space (Fig. 1).
The classic model with two connected alveolar “bubbles” of unequal radii shows unstable behavior, as the small bubble will empty into the larger (45), because of the inverse relationship between PS and r, as given by Laplace's law. In the alveoli, this behavior is opposed by the tissue elasticity and by the ability of surfactant to increase the surface tension during inflation of the alveolus (45). Combining the effects of tissue and surfactant properties distinguishes the present model from previous models describing alveolar behavior.
Surface area and volume changes in the alveoli.
For a human subject in the supine position, the values total lung capacity (TLC) = 6.8 l (48), anatomic dead space volume (VAD) = 0.15 liter, number of alveoli in the lungs, NA = 375 106. (1), functional residual capacity (FRC) = 2.2 liter (15), and residual volume (RV) = 1.62 liter (5) were assumed.
The average maximum Va (VaTLC) can be calculated as:
| (7) |
For a radius of the rigid ring of a = 100 μm, a maximal alveolar radius rMax = 163 μm, can be calculated from Eqs. 1, 2, and 3. The same calculation gives an average Va, VaFRC = 5.5 nl at FRC, and an Va, VaRV = 3.8 nl at RV. Equation 7 assumes that the inspired air besides dead space is distributed only to the alveoli, ignoring air residing in the alveolar ducts (6, 45, 47).
Table 1 shows calculations of the average relative Va and surface area changes during three different respiratory maneuvers for different radii a of the rigid ring. The three respiratory maneuvers are expiration from 1) TLC to FRC, 2) TLC to RV, and 3) FRC + Vt to FRC. For each maneuver, the average relative reduction in Va and AA has been calculated using Eqs. 1, 2, 3, 8, and 9.
| (8) |
| (9) |
Note that the reduction in Va is calculated as the percentage left in the alveolus at the end of expiration relative to the end-inspiratory volume, e.g., in the first maneuver, the Va is reduced to 30.8%, while the volume is only reduced to 80.4% in the third maneuver, even though the absolute end-expiratory volume is the same for both maneuvers. The same applies for the calculations of surface areas.
Table 1.
Relative reductions in alveolar volumes and surface areas for different respiratory maneuvers
| Alveolar Area Reduction, % |
||||||
|---|---|---|---|---|---|---|
| Respiratory Maneuver | Lung Volume Reduction, liter | Alveolar Volume Reduction, % | a = 0 μm | a = 75 μm | a = 100 μm | a = 150 μm |
| TLC →FRC | 6.8 → 2.2 | 30.8 | 45.7 | 43.1 | 42.0 | 43.6 |
| TLC → RV | 6.8 → 1.6 | 21.8 | 36.2 | 33.4 | 32.4 | 36.2 |
| FRC + Vt → FRC | 2.7 → 2.2 | 80.4 | 86.5 | 85.3 | 84.9 | 87.1 |
a, Alveolar opening radius; TLC, total lung capacity; FRC, functional residual capacity; RV, residual volume; Vt, tidal volume.
A model of surfactant mechanical properties.
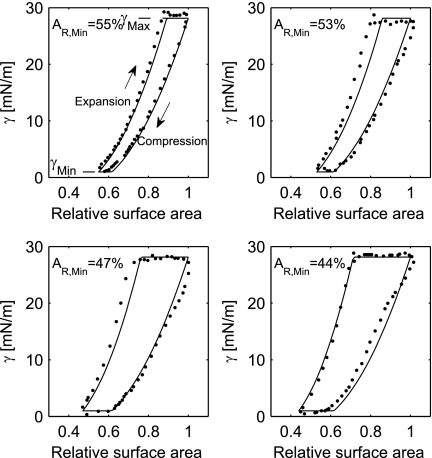
The hysteresis due to surfactant activity measured with captive bubble surfactometry was among others studied by Lu et al. (21). The surface tension as a function of the relative surface area was measured in air bubbles coated with bovine surfactant extract during different degrees of dynamic compression. Data read from the study are shown in Fig. 2. The data show that, when the surface area of the bubble is reduced by compressing the bubble, then the surface tension decreases down to a minimum value defined by γMin.
Fig. 2.
The relation between relative surface area (AR) and surface tension (γ) with minimum relative alveolar surface area (AR,Min) of 55, 53, 47, and 44%. Data read from Lu et al. (21) are shown (dots) with corresponding modeled γ (solid curves). The minimal γ (γMin) and maximal γ (γMax) are indicated as well.
A biophysical interpretation of this behavior has been proposed by Morris et al. (27) and Krueger and Gaver (20). During the compression, the concentration of the surfactant monolayer in the air-liquid interface is increased, and the surface tension is reduced accordingly. When the surface tension has been reduced to γMin, the maximal possible surfactant concentration has been reached, and any further compression results in “collapse” of the monolayer formed by the surfactant, and a secondary bilayer is formed in the liquid phase, effectively removing surfactant from the air-liquid interface.
When the relative surface area is increased by expansion of the bubble, the surface tension rises up to a maximal equilibrium surface tension defined by γMax. Any further expansion will lead to “respreading,” where the secondary bilayer is incorporated into the monolayer at the air-liquid interface, effectively adding surfactant to the air-liquid monolayer. As seen in Fig. 2, the surface tension exhibits hysteresis whenever the bubbles are compressed beyond a threshold AMeta, which is 62% of their maximal surface area. If the surface area is not reduced below 62%, no hysteresis occurs (21).
We used the results reported by Lu et al. (21) to derive a model of surface tension due to surfactant as a function of the compression of the surface area.
The relative AA (AR) is defined by Eq. 10.
| (10) |
where A0 is the surface which can be covered by the amount of surfactant currently in the monolayer, when the monolayer is stretched to give the γMax. A0 must be updated through a breath (A0,New), according to Eq. 11, to account for surfactant removed from or added to the air-liquid monolayer because of compression during expiration or expansion during inspiration.
| (11) |
A second-order polynomial stated in Eq. 12 has been chosen as a model for the surface tension during compression and expansion.
| (12) |
To determine the coefficients a, b, and c, constraints have been formulated on the basis of the data by Lu et al. (21). First, Eq. 12 must reach the maximal value (γMax) when the AR = 1. Second, Eq. 12 must equal the γMin when the AR reaches AR = AMeta. The two requirements can be expressed mathematically by Eqs. 13 and 14, respectively.
| (13) |
| (14) |
γMax and γMin were estimated from the four datasets represented in Fig. 2 (21) by averaging the points of highest and lowest values for the surface tension, resulting in γMax = 28.1 mN/m and γMin = 1.0 mN/m, respectively, in agreement with previous findings (11, 32, 34, 46). Equation 12 can be applied to all data points in Fig. 2 (21), giving a set of regression equations. A least squares solution to these equations under the constraints given by Eqs. 13 and 14 over all of the points in Fig. 2 gives the values: a = 98.9 mN/m, b = −89.0 mN/m, c = 18.3 mN/m, and AMeta = 0.617. Simulated surface tensions are shown in Fig. 2 as solid curves.
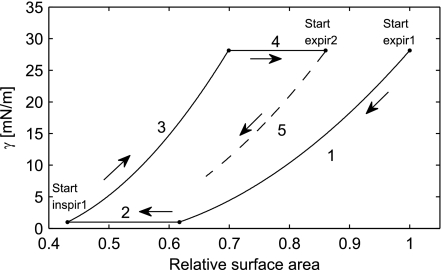
The behavior of the surfactant model will be illustrated by following the relationship between surface tension and relative surface area during a breathing maneuver, consisting of an expiration and an inspiration (Fig. 3). Figure 3 shows a simulation of a “breath” (1–4), starting from expiration noted by “Start expir1”. During the expiration, beginning at the point labeled “Start expir1”, the surface tension initially follows curve 1. On this curve AMeta ≤ AR ≤ 1, so A0 remains constant and γ is given by Eq. 12. Note that, if the expiration is stopped somewhere along curve 1 and an inspiration is begun, then the surface tension will still follow curve 1, without any hysteresis. During the second part of the expiration (curve 2), the surface tension is constant, since the AA is compressed <61.7% of the start surface area and A0 is changed according to Eq. 11 to account for surfactant removed from the monolayer due to collapse. AR, therefore, remains constant (AR = AMeta). During the first part of the inspiration (curve 3), the surfactant left in the monolayer is allowed to expand. This happens without adding surfactant to the monolayer. Therefore, A0 is constant, and AR increases toward 1. During the last part of the inspiration (curve 4), the surface tension is maximal, AR = 1, and A0 is gradually increased according to Eq. 11 to account for the surfactant added to the monolayer due to “respreading” of the secondary layer. During a following second expiration (curve 5), the surfactant will be compressed again, but now using the value of A0 achieved at the end of the inspiration.
Fig. 3.
Simulation of the γ where alveolar area does not return to its previous value, e.g., after a yawn, where a large inspiration is followed by a smaller tidal breath. During expiration, the γ follows curves 1 and 2. During inspiration, γ follows curves 3 and 4. In the following smaller breath, γ follows curve 5.
Lung tissue properties.
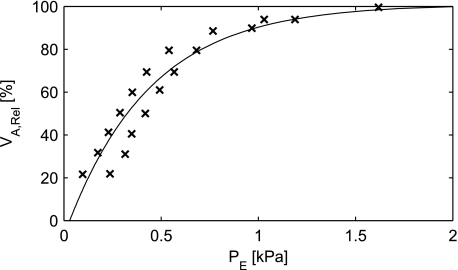
The lung tissue exerts a recoil pressure when inflated. This has been examined by inflating excised rabbit lungs with saline, making it possible to eliminate surface tension (34). The excised lung was reported to be affected by a gravitational pressure gradient of ∼0.1 kPa down the lung. This effect is considered minor and is disregarded in the model. Measurements by Smith and Stamenovic (34) of inflation and deflation reveal some degree of hysteresis (Fig. 4). This effect is also disregarded. The model represents the tissue properties of the whole lungs, including alveolar membranes and the tissue connecting the alveoli. Assuming all alveoli have identical elastic properties, the measured PE is also valid for a single alveolus.
Fig. 4.
Relation between the elastic recoil pressure (PE) exerted by the tissue of an alveolus and the volume of the alveolus (Varel). The data (crosses) are adapted from Smith et al. (34). A curve (Eq. 15) has been fitted to the data.
Figure 4 shows the data read from Smith and Stamenovic (34) translated to relative Va with a curve fitted to data. The equation for the curve fit is stated in Eq. 15.
| (15) |
where VaRel is the Va relative to VaTLC.
RESULTS
To determine the effect of tissue elastic properties and surfactant on alveolar stability, model simulations have been performed in five situations: 1) no effect of lung tissue elastic properties and a constant surface tension from a liquid-air interface without surfactant; 2) the effect of lung tissue elastic properties alone; 3) the effect of lung tissue elastic properties and a high surface tension from a liquid-air interface without surfactant; 4) the effect of surfactant alone; and 5) both the properties of surfactant and tissue elastic properties included. Finally, the simulated total PV relationship is compared with data obtained from an excised cat lung.
The alveolus without surfactant and tissue elastic properties.
In patients with ARDS, the effect of surfactant may be reduced because the surfactant has been washed away by pulmonary edema (44), or because the surfactant has been deactivated by plasma proteins (49). In these cases, the lungs are ventilated under high surface tension. The surface tension in an alveolus without surfactant is assumed to be equal to the surface tension of plasma, ∼73 mN/m (18).
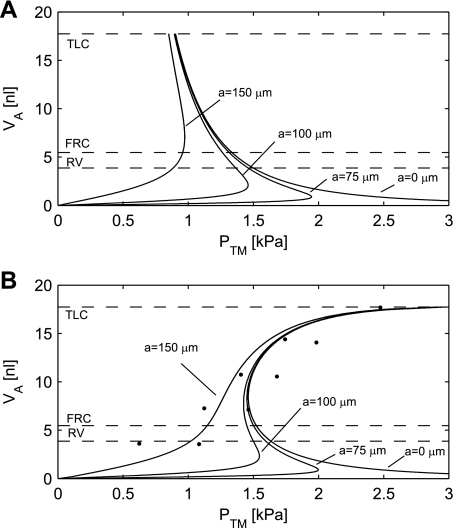
If the radius a of the rigid ring is small compared with the radius of the alveolus, then the alveolus behaves like a sphere. The Ptm of the alveolus then follows Laplace's law (Eq. 6), resulting in the hyperbolic curve labeled a = 0 μm in Fig. 5A.
Fig. 5.
A: alveolar pressure-volume (PV) curves for an alveolus without surfactant and tissue elastic properties. B: simulations of the alveolar PV curve with the tissue elastic properties and a constant γ of 73 mN/m. The radius of the rigid ring a varies between 0, 75, 100, and 150 μm. The simulation shows that the tissue elastic properties are capable of stabilizing the alveolus when the opening radius a is 150 μm, however, not for the smaller opening radii. Experimental data are indicated by dots (3). The dashed lines indicate residual volume (RV), functional residual capacity (FRC), and total lung capacity (TLC). The dashed lines represent Va going from maximal volume (TLC) down to 30.8% (FRC) and 21.8% (RV) of maximal volume (Table 1). Ptm, transmural pressure.
This hyperbolic PV curve (a = 0 μm) has a negative slope, which implies that the pressure increases with decreasing volumes. This is a situation of unstable equilibrium, where, at a given pressure, any small perturbation of the Va will lead to either collapse to zero volume or expansion to infinite volume. Furthermore, a collapse is irreversible, since the Pa goes toward infinity at small volumes. These are undesirable properties for an alveolus and incompatible with normal lung function.
It is clear from photographs of cross sections of lung tissue that the radius of the “rigid ring” is not small compared with the radius of an alveolus (17). A value of a in the range from 75 to 150 μm seems realistic. If the PV curve under this modified geometric assumption is plotted, then we get curves labeled 75, 100, and 150 μm, respectively, in Fig. 5A. This assumption actually imparts some degree of stability to the alveolar PV relationship with a positive slope for small Va values. However, the slope becomes negative, when the alveoli reach the semispherical shape, corresponding to the situation in Fig. 1B. Above that volume, the alveolus remains unstable. The pressure at which it is possible to reach the negative slope depends on the radius a of the rigid ring. At a radius a = 75 μm, the pressure required to “pop open” the alveolus is 1.9 kPa. For a = 100 μm, the opening pressure is 1.5 kPa and for a = 150 μm, 1.0 kPa.
The alveolus with tissue elastic properties and without surface tension.
This situation is simple and completely described by the model of elastic tension given by Eq. 15. Inspection of the curve in Fig. 4 reveals that the slope of the curve in the PV diagram is positive for all volumes, leaving no room for instability.
The alveolus with tissue elastic properties and a high surface tension.
Bachofen et al. (3) studied the PV relationship in the lungs after depleting the lungs of surfactant with a detergent. For comparison with these data, a simulation was performed with the surface tension equal to the surface tension of plasma, ∼73 mN/m (18). The tissue elastic properties are assumed to be unaffected.
The measurements by Bachofen et al. (3) are shown in Fig. 5B, along with the results of the simulation with four different opening radii for the alveolus (0, 75, 100, and 150 μm). For alveolar opening radii of 0, 75, and 100 μm, the alveolus will be unstable and will pop open at its opening pressure. As shown in Fig. 5, the elasticity stabilizes the alveoli so that, when the opening pressure is reached, it pops open to a finite volume. When the opening radius is increased to 150 μm, the alveolus is stabilized by the tissue elastic properties, even without the effects of surfactant.
The alveolus with surfactant and without tissue elastic properties.
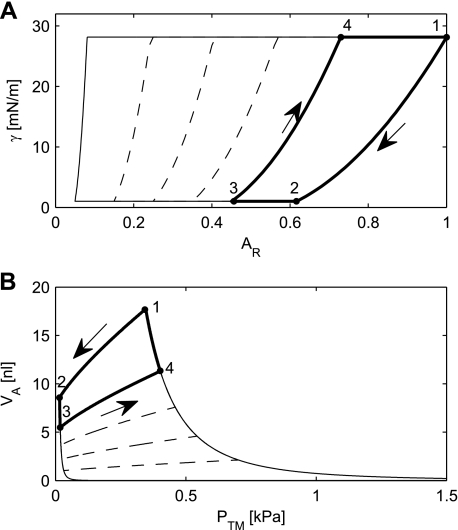
Surfactant reduces the surface tension and may also provide stability to the alveoli. The surfactant model stated by Eqs. 10, 11, and 12 with the constants a, b, c, and AMeta generates the plots in Fig. 6A. The thick line represents a maneuver, which starts in the point labeled 1 with the average alveolus inflated to its maximum radius, corresponding to a lung volume equal to TLC. The surface area of an average alveolus is subsequently reduced to 45.7% of the original surface, as indicated by the point labeled 3. This corresponds to a volume reduction to 30.8% of the original volume, or a reduction corresponding to the reduction obtained by expiring from TLC to FRC (Table 1). In the course of the area reduction, the area passes the point labeled 2, where the relative area is 61.7%, which is an area reduction equal to AMeta. At this point, the γMin has been reached, and the parameter A0 will be reduced according to Eq. 11. As a consequence, the surface tension will begin to show hysteresis. For relative areas larger than 61.7%, there is no hysteresis, and reinflation from point 2 back to the original area will follow the same curve between 2 and 1 as it followed during deflation.
Fig. 6.
A: simulation results of the alveolar γ as a function of the AR. B: simulation results from the same simulations as in A, replotted as an alveolar PV curve. The thick line represents a simulation with Va ranging from maximum Va (VaMax) to Va at FRC (VaFRC) and back. The dashed lines show the behavior that follows from the model of surfactant for deflations going down to relative areas of 5, 15, 25, and 35%.
If the alveolus is inflated from its area at point 3, it will follow the curve up to point 4. At this point, the γMax has been reached, and the parameter A0 will be increased according to Eq. 11. During the remaining part of the inflation, the surface tension will stay at its maximum, and it will follow the curve from 4 to 1.
By applying Laplace's law, the surface tension can be converted to a Pa and Eqs. 1, 2, and 3 can be used to convert relative area to Va. The curves in Fig. 6A can, therefore, be replotted as alveolar PV curves (Fig. 6B). If the deflation-inflation maneuver labeled 1, 2, 3, and 4 in Fig. 6A is carried out by controlling the volume of the alveolus, then it can be refound with the same labels in Fig. 6B, where it is assumed that the radius a of the rigid ring is zero. However, the same maneuver cannot be carried out by pressure control. In that case, the instability of the alveolus will manifest itself. The alveolus will be stable along the deflation going from point 1 to point 2. In point 2, it can be seen from Fig. 6B that the slope in the PV diagram becomes negative, and, once the volume reaches point 2, the alveolus will collapse, following the leftmost curve past point 3 to the bottom of the diagram and then converge toward zero volume and infinite pressure. As was the case without surfactant, this situation is irreversible because of the infinite pressure. It should also be noted that points on the rightmost curve in the PV diagram, including points 1 and 4, are unstable. An alveolus under pressure control, placed on this curve, will continue up the curve, past point 1, until it reaches infinitely large volume. Thus, even with surfactant, an alveolus displays both collapse and expansion toward infinity, just like the alveolus without surfactant.
Nevertheless, the situation with surfactant is better than the situation without surfactant. We can reinterpret the movements in the PV diagram (Fig. 6B) and let point 1 represent a situation where the Va corresponds to a normal inspiration, i.e., that the lung volume is equal to FRC plus Vt. A normal expiration to FRC would only reduce the relative volume to 80.4%, and normal respiration would, therefore, stay at the stable part of the curve between points 1 and 2. This is a marked improvement relative to the situation without surfactant, where even normal respiration would be unstable.
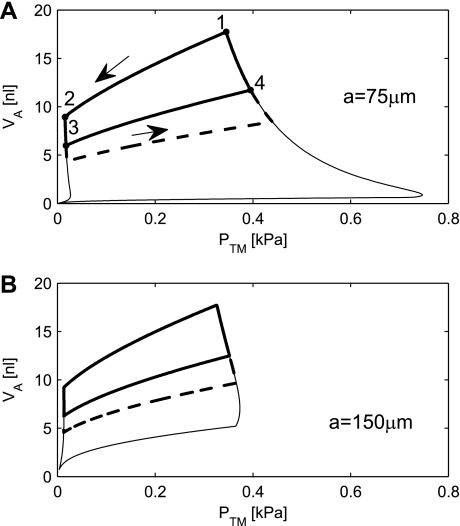
A further improvement of stability can be achieved, if we also consider geometries where the radius a of the rigid ring is greater than zero. The alveolus will collapse, but not to zero volume. The volume will be caught at the small notch evident in the bottom left corner of Fig. 7A. This collapse is reversible. Upon reinflation, the maximal pressure required to open the alveolus is 0.75 kPa for a = 75 μm and only 0.38 kPa for a = 150 μm. Once the opening pressure is reached, the alveolus will still expand to infinite volume, just as in the case, where a = 0.
Fig. 7.
Simulated PV curve is shown without the lung tissue elastic properties with an opening radius a of 75 μm (A) and 150 μm (B). The thick line is a simulation with Va ranging from Va at TLC (VaTLC) to VaFRC and back. The thick dashed line represents the physiologically relevant range of the simulations from VaTLC to Va at RV (VaRV). The bottom thin line shows simulations of compressions from maximum surface area to 5%.
It is also interesting to note that, according to Fig. 6B, the classical two bubble model, where the sum of the two volumes is kept constant, will be stable. Stability is ensured as long as the slope of the curve “1–4” is steeper than the slope of the curve “3–4”. However, it does not change the conclusion, that an alveolus with surfactant displays both collapse and expansion toward infinity, just like the alveolus without surfactant. This is because the appropriate comparison is not a two-bubble, but an N bubble model. If, in an N bubble model, one alveolus increases its volume, then the volume decrease must be distributed between the remaining N − 1 alveoli. Each of those, therefore, sees a much smaller volume reduction, which gives rise to a much smaller pressure drop in the alveoli with decreased volumes. Therefore, the negative feedback becomes positive, leading to instability. Graphically, it can be interpreted as the slope of the curve “3–4” becoming N − 1 times steeper.
The alveolus with surfactant and tissue elastic properties.
In this situation, the alveolar Ptm is given by Eq. 5, i.e., as the sum of the PE and the pressure due to surfactant PS.
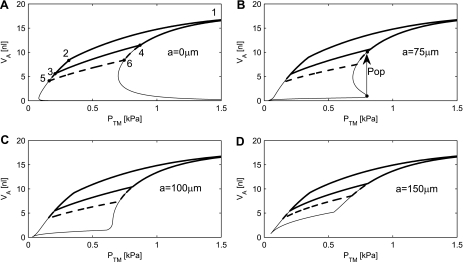
For the geometry where the radius of the rigid ring is zero, the alveolar PV curve is plotted in Fig. 8A. During deflation, the alveolus is now completely stable, and even deflation from TLC (point 1) down to RV (point 5), followed by an inflation through points 6, 4, and 1, will keep the alveolus stable. However, if the alveolus is subjected to Pa < 0.1 kPa, it will close, and this closure is irreversible.
Fig. 8.
The simulated PV relationship of an alveolus, including the mechanical properties of the tissue elasticity and surfactant. The thick line is a simulation with Va ranging from VaTLC to VaFRC and back. The thick dashed line represents the physiological range of volume changes from VaTLC to VaRV. A: the alveolar PV relationship for a = 0 μm. B: with a = 75 μm, the alveolus will “pop” open, once the Ptm exceeds the opening pressure of 0.8 kPa. The Va will suddenly increase, as indicated by the arrow labeled Pop. The bottom thin line shows a simulation of compressions from maximum surface area to 5%. C: further increase to a = 100 μm will eliminate the ability of the alveolus to pop open. D: with a = 150 μm, the alveolus will be completely stable.
If the radius a of the rigid ring is 75 μm (Fig. 8B), then closure of the alveolus becomes reversible with an opening pressure of 0.8 kPa (Fig. 8B). In this situation, the alveolus will open with a “pop”, jumping from the volume at the opening pressure to a higher volume. This is shown in Fig. 8B by an arrow with “Pop” noted. A further increase to a = 100 μm will eliminate the ability of the alveolus to pop open, and with a = 150 μm the alveolus will be completely stable.
Comparison to cat data.
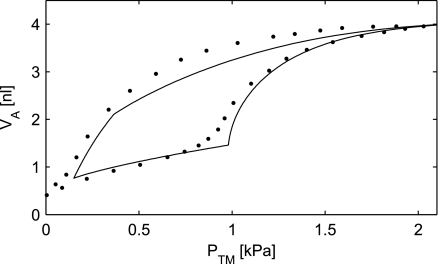
Bachofen et al. (4) measured the PV relationship in an excised cat lung. Producing a model simulation for a cat requires reestimation of the model parameters. The γMax is different for different species (2, 13, 28, 33), and the alveoli tend to be smaller for smaller animals (25, 41). Figure 9 shows both the experimental data of Bachofen et al. and a simulation with γMax = 28 mN/m, rMax = 100 μm, and radius of the rigid ring a = 61 μm, keeping the ratio a/rMax identical to the ratio a/rMax = 100:163 μm used in the human lungs.
Fig. 9.
The simulated PV curve with the tissue elastic and surfactant properties included. The parameter γMax was set to 28 mN/m. The radius a of the alveolar rigid ring was set to 61 μm, and the maximal alveolar radius (rMax) to 100 μm to simulate smaller cat alveoli. Experimental data are indicated by dots (4).
DISCUSSION
This paper has used as a starting point the approximation that the geometry of an alveolus can be approximated by a spherical inflated through a rigid ring. The analysis showed that, without surfactant and with a small radius a of the rigid ring, the alveolus is always at an unstable equilibrium with the capacity both to close irreversibly and to open with infinite volume. By assuming the radius of the rigid ring to be larger than zero, the closing can be made reversible, although a fairly large pressure, 1–2 kPa for a going from 150 to 75 μm, is required to reopen a collapsed alveolus. The model thus predicts the opening pressures required to open alveoli in the absence of surfactant, which may be clinically relevant for premature babies in whom the production of surfactant is insufficient or in case of ARDS, where surfactant has been washed away by pulmonary edema (44).
We have not been able to find estimates of the radius of the “rigid ring” in the literature, but visual inspection of photomicrographs of lung tissue (17, 45) has led to the use of a range of radii, going from 75 to 150 μm. For a = 100 μm, the ratio a/rMax = 100:163 μm = 0.61. Alveolar behavior is stable for a ≥ 100 μm, when both surfactant and tissue elasticity are taken into account (Fig. 8). Furthermore, when a/rMax = 0.61 is used to simulate the PV curve, the simulations give a reasonable fit to the experimental data (Fig. 9). We, therefore, believe a = 100 μm to be a reasonable estimate for the radius of the “rigid ring” in the human alveoli.
Based on in vitro behavior of surfactant, a novel model of the mechanical behavior of surfactant has been constructed. Surfactant stabilizes the alveolus for moderate volume changes, compatible with stable behavior during normal breathing, even without the stabilizing effect of tissue elasticity. However, the capacity both to close irreversibly and to open with infinite volume remains for a equal to zero. For nonzero values of a, the collapse of alveoli can be made reversible with moderate opening pressures ranging from 0.37 to 0.75 kPa.
Simulations were performed without surfactant, but with the tissue elasticity unaffected, as is the case of ARDS, where leak of plasma proteins and edema deactivate surfactant. These simulations show that the alveoli are stable when the alveolar opening radius is 150 μm, but unstable for opening radii of 0, 75, and 100 μm.
When the passive elastic properties of alveoli are added to the surfactant properties, we obtain a model that does not display obviously unreasonable behavior and that actually predicts that normal breathing will take place in a range of inflation and deflation, which does not give rise to hysteresis, while deeper breaths will give rise to hysteresis. Qualitatively, this agrees well with the behavior of whole lungs observed during mechanical ventilation (14).
Several other assumptions in the paper are open for discussion. The surfactant used by Lu et al. (21) is bovine and presumably has mechanical properties that are somewhat different from human surfactant, although it has been argued that bovine surfactant resembles human surfactant (37). Furthermore, the experimental data used for the surfactant model are obtained under constant dynamic compression/expansion of 25 s per cycle, while breath cycles in an adult take ∼4 s. This may be an issue for further improvement, since the hysteresis is shown to be dependent on the speed of compression (11).
It has been shown experimentally that the alveolar surface area under normal conditions is increased by approximately two-thirds power of the lung volume changed (6, 13), according to the spherical equations. This relation between lung volume and lung area has, however, been questioned recently, in particular at low lung volumes and when surface tension is high (3, 10, 29, 31, 40, 42, 46, 47). Since the presented model does not include the alveolar ducts, it cannot contribute to an understanding of this phenomenon, and maybe results should be interpreted with caution under these circumstances.
Another limitation is that the model does not allow changes in elastic properties of the alveolar wall, thus being incapable of simulating how the properties change with, e.g., fibrosis (22).
In Fig. 9 an alveolus with surfactant and in Fig. 5B an alveolus without surfactant are compared with the behavior of whole excised lungs. Such a comparison is only valid to the extent that the simulated alveolus is representative for all alveoli in the lungs. In principle, the presence of a hydrostatic gradient in the lungs, due to the weight of the lung tissue, cause alveoli at different heights in the lungs to behave differently. Due to the small size of the cat lung, the hydrostatic gradient is limited, and this may explain why experimental data and simulations agree reasonably well in Fig. 9. In Fig. 5B, the alveolar behavior for a = 100 μm is unstable, where alveoli close and pop open. This makes it less valid to infer the behavior of a whole lung from an “average” alveolus and may explain why there is a poorer agreement between experimental and simulated data in Fig. 5B. An additional problem in Fig. 5B is that alveoli are modeled individually. When an alveolus closes, the interaction with neighboring alveoli with which the alveolus shares a wall must be substantial. Presumably, this will make neighboring alveoli open and close at the same time, but this cannot be modeled with the current model.
Despite these shortcomings, the current simple model of alveolar geometry, surfactant, and tissue elasticity shows how these factors combine to provide alveolar stability. The model also predicts that compromised surfactant will cause closing of alveoli with reopening pressures up to 2 kPa, depending on the radius of the alveolar opening toward the alveolar ducts.
As the next step, the alveolar model will be included in a larger lung mechanical model, which also takes into account the hydrostatic gradient down the lung, as well as the effect of the chest wall (36).
GRANTS
S. Andreassen, S. Rees, and D. S. Karbing were partially funded by a grant awarded to the Center for Model-Based Medical Decision Support at Aalborg University by the NABIIT Committee under the Danish Strategic Research Council. J. Bernardino de la Serna was supported by a Lundbeck Foundation personal fellowship and acknowledges taking advantage of MEMPHYS-Center for Biomembrane Physics (Danish National Research Foundation Center of Excellence) and related grants.
DISCLOSURES
No conflicts of interest, financial or otherwise, are declared by the author(s).
REFERENCES
- 1. Angus GE, Thurbeck WM. Number of alveoli in the human lung. J Appl Physiol 32: 483–485, 1972 [DOI] [PubMed] [Google Scholar]
- 2. Axe JR. Analysis of pressure-volume relationship of excised lungs. Ann Biomed Eng 13: 101–117, 1985 [DOI] [PubMed] [Google Scholar]
- 3. Bachofen H, Gehr P, Weibel ER. Alterations of mechanical properties and morphology in excised rabbit lungs rinsed with a detergent. J Appl Physiol 47: 1002–1010, 1979 [DOI] [PubMed] [Google Scholar]
- 4. Bachofen H, Hildebrandt J, Bachofen M. Pressure-volume curves of air- and liquid-filled excised lungs–surface tension in situ. J Appl Physiol 29: 422–431, 1970 [DOI] [PubMed] [Google Scholar]
- 5. Baydur A, Sassoon CSH, Carlson M, Aral H. Measurement of lung mechanics at different lung volumes and esophageal levels in normal subjects: effect of posture change. Lung 174: 139–151, 1996 [DOI] [PubMed] [Google Scholar]
- 6. Butler JP, Brown RE, Stamenovic D, Morris JP, Topulos GP. Effect of surface tension on alveolar surface area. J Appl Physiol 93: 1015–1022, 2002 [DOI] [PubMed] [Google Scholar]
- 7. Chiumello D, Carlesso E, Cadringher P, Caironi P, Valenza F, Polli F, Tallarini F, Cozzi P, Cressoni M, Colombo A, Marini JJ, Gattinoni L. Lung stress and strain during mechanical ventilation for acute respiratory distress syndrome. Am J Respir Crit Care Med 179: 346–355, 2008 [DOI] [PubMed] [Google Scholar]
- 8. Chu EK, Whitehead T, Slutsky AS. Effects of cyclic opening and closing at low- and high-volume ventilation on bronchoalveolar lavage cytokines. Crit Care Med 32: 168–174, 2004 [DOI] [PubMed] [Google Scholar]
- 9. Clements JA, Brown ES, Johnson RP. Pulmonary surface tension and the mucus lining of the lungs: some theoretical considerations. J Appl Physiol 12: 262–268, 1958 [DOI] [PubMed] [Google Scholar]
- 10. Cochrane CG. Pulmonary surfactant in allergic inflammation: new insight into the molecular mechancisms of surfactant functiuon. Am J Physiol Lung Cell Mol Physiol 288: L608–L609, 2005 [DOI] [PubMed] [Google Scholar]
- 11. Crane JM, Hall SB. Rapid compression transforms interfacial monolayers of pulmonary surfactant. Biophys J 80: 1863–1872, 2001 [DOI] [PMC free article] [PubMed] [Google Scholar]
- 12. Dreyfuss D, Saumon G. Ventilator-induced lung injury–lessons learned from experimental studies. Am J Respir Crit Care Med 157: 294–323, 1998 [DOI] [PubMed] [Google Scholar]
- 13. Fisher MJ, Wilson MF, Weber KC. Determination of alveolar surface area and tension from in situ pressure-volume data. Respir Physiol 10: 159–171, 1970 [DOI] [PubMed] [Google Scholar]
- 14. Harris RS. Pressure-volume curves of the respiratory system. Respir Care 50: 78–99, 2005 [PubMed] [Google Scholar]
- 15. Ibanez J, Raurich M. Normal values of functional residual capacity in the sitting and supine positions. Intensive Care Med 8: 173–177, 1982 [DOI] [PubMed] [Google Scholar]
- 16. Ingenito EP, Mark L, Morris J, Espinosa FF, Kamm RD, Johnson M. Biophysical characterization and modeling of lung surfactant components. J Appl Physiol 86: 1702–1714, 1999 [DOI] [PubMed] [Google Scholar]
- 17. Itoh H, Nishino M, Hatabu H. Architecture of the lung. J Thorac Imaging 19: 221–227, 2004 [DOI] [PubMed] [Google Scholar]
- 18. Karagianni M, Avranes A. The effect of deaeration on the surface tension of water and some other liquids. Physicochem Eng Asp 335: 168–173, 2009 [Google Scholar]
- 19. Krahl VE. Anatomy of the mammalian lung. In: Handbook of Physiology. Neurophysiology. Respiration. Washington, DC: Am. Physiol. Soc., 1964, sect. 3, vol. I, chapt. 6, p. 213–284 [Google Scholar]
- 20. Krueger MA, Gaver DP. A theoretical model of pulmonary surfactant multilayer collapse under oscillating area conditions. J Colloid Interface Sci 229: 353–364, 2000 [DOI] [PubMed] [Google Scholar]
- 21. Lu JY, Distefano J, Philips K, Chen P, Neumann AW. Effect of the compression ratio on properties of lung surfactant (bovine lipid extract surfactant) films. Respir Physiol 115: 55–71, 1999 [DOI] [PubMed] [Google Scholar]
- 22. Matamis D, Lemaire F, Harf A, Brun-Buisson C, Ansquer JC, Atlan G. Total respiratory pressure-volume curves in the adult respiratory distress syndrome. Chest 86: 58–66, 1986 [DOI] [PubMed] [Google Scholar]
- 23. Meade MO, Cook DJ, Guyatt GH, Slutsky AS, Arabi YM, Cooper DJ, Davies AR, Hand LE, Zhou Q, Thabane L, Austin P, Lapinsky S, Baxter A, Russell J, Skrobik Y, Ronco JJ, Stewart TE. Ventilation strategy using low tidal volumes, recruitment maneuvers, and high positive end-expiratory pressure for acute lung injury and acute respiratory distress syndrome–a randomized controlled trial. JAMA 299: 637–645, 2008 [DOI] [PubMed] [Google Scholar]
- 24. Mercat A, Richard JM, Vielle B, Jaber S, Osman D, Diehl J, Lefrant J, Prat G, Richecoeur J, Nieszkowska A, Cervais C, Baudot J, Bouadma L, Brochard L. Positive end-expiratory pressure setting in adults with acute lung injury and acute respiratory distress syndrome–a randomized controlled trial. JAMA 299: 646–655, 2008 [DOI] [PubMed] [Google Scholar]
- 25. Mercer RR, Crapo JD. Three-dimensional reconstruction of the rat acinus. J Appl Physiol 63: 785–794, 1987 [DOI] [PubMed] [Google Scholar]
- 26. Millar AB, Denison DM. Vertical gradients of lung density in healthy supine men. Thorax 44: 485–490, 1987 [DOI] [PMC free article] [PubMed] [Google Scholar]
- 27. Morris J, Ingenito EP, Mark L, Kamm RD, Johnson M. Dynamic behavior of lung surfactant. J Biomech Eng 123: 106–113, 2001 [DOI] [PubMed] [Google Scholar]
- 28. Otis DR, Ingenito EP, Kamm RD, Johnson M. Dynamic surface tension of surfactant TA: experiment and theory. J Appl Physiol 77: 2681–2688, 1994 [DOI] [PubMed] [Google Scholar]
- 29. Prokop RM, Chen P, Grag A, Neumann AW. Thermodynamic modeling of the lung mechanics. Colloids Surf B Biointerfaces 13: 59–73, 1999 [Google Scholar]
- 30. Ranieri VM, Suter PM, Tortorella C, De Tullio R, Dayer JM, Brienza A, Bruno F, Slutsky AS. Effect of mechanical ventilation on inflammatory mediators in patients with acute respiratory distress syndrome. JAMA 282: 54–61, 1999 [DOI] [PubMed] [Google Scholar]
- 31. Schiller HJ, McCann UG, Carney DE, Gatto LA, Steinberg JM, Nieman GF. Altered alveolar mechanics in the acutely injured lung. Crit Care Med 29: 1049–1055, 2001 [DOI] [PubMed] [Google Scholar]
- 32. Schürch S, Martin L, Gehr P. Pulmonary surfactant: surface properties and function of alveolar and airway surfactant. Pure Appl Chem 64: 1745–1750, 1992 [Google Scholar]
- 33. Slama H, Schoedel W, Hansen E. Lung surfactant: film kinetics at the surface of an air bubble during prolonged oscillations of its volume. Respir Physiol 19: 233–243, 1973 [DOI] [PubMed] [Google Scholar]
- 34. Smith JC, Stamenovic D. Surface forces in lungs. I. Alveolar surface tension-lung volume relationships. J Appl Physiol 60: 1351–1350, 1986 [DOI] [PubMed] [Google Scholar]
- 35. Spiegel MR, Liu J. Schaum's Mathematical Handbook of Formulas and Tables (2nd Ed.). New York: McGraw-Hill, 2001 [Google Scholar]
- 36. Steimle Kl, Mogensen ML, Karbing DS, de La Serna JB, Andreassen S. A model of ventilation of the healthy human lung. Comput Methods Programs Biomed. doi:10.1016/j.cmpb.2010.06.017, 2010 [DOI] [PubMed] [Google Scholar]
- 37. Taeusch HW, de la Serna JB, Perez-Gil J, Alonso C, Zasadzinski A. Inactivation of pulmonary surfactant due to serum-inhibited adsorption and reversal by hydrophilic polymers: experimental. Biophys J 89: 1769–1779, 2005 [DOI] [PMC free article] [PubMed] [Google Scholar]
- 38. The Acute Respiratory Distress Syndrome (ARDS) Network Ventilation with lower tidal volumes compared with traditional tidal volumes for acute lung injury and the acute respiratory distress syndrome. N Engl J Med 324: 1301–1308, 2000 [DOI] [PubMed] [Google Scholar]
- 39. Trauble H, Eibl H, Sawada H. Respiration–A Critical Phenomenon? Lipid phase transitions in the lung alveolar surfactant. Naturwissenschaften 61: 344–354, 1974 [DOI] [PubMed] [Google Scholar]
- 40. Tschumperlin DJ, Margulies SS. Alveolar epithelial surface area-volume relationship in isolated rat lungs. J Appl Physiol 86: 2026–2033, 1999 [DOI] [PubMed] [Google Scholar]
- 41. Tsuda A, Filipovic N, Haberthür D, Dickie R, Matsui Y, Stampanoni M, Schittny C. Finite element 3D reconstruction of the pulmonary acinus imaged by synchrotron X-ray tomography. J Appl Physiol 105: 964–976, 2008 [DOI] [PMC free article] [PubMed] [Google Scholar]
- 42. Tsunoda S, Fukaya H, Sugihara T, Martin CJ, Hildebrandt J. Lung volume, thickness of alveolar walls, and microscopic anisotropy of expansion. Respir Physiol 2: 285–296, 1974 [DOI] [PubMed] [Google Scholar]
- 43. Valberg PA, Brain JD. Lung surface tension and air space dimensions from multiple pressure-volume curves. J Appl Physiol 43: 730–738, 1977 [DOI] [PubMed] [Google Scholar]
- 44. Verbrugge SJC, Lachmann B, Kesecioglu J. Lung protective ventilatory strategies in acute lung injury and acute respiratory distress syndrome: from experimental findings to clinical application. Clin Physiol Funct Imaging 27: 67–90, 2007 [DOI] [PubMed] [Google Scholar]
- 45. Weibel ER. The Pathway for Oxygen. Cambridge: Harvard University Press, 1984, Ch. 11, p. 302–338 [Google Scholar]
- 46. Wilson T. Surface tension-surface area curves calculated from pressure-volume loops. J Appl Physiol 53: 1512–1520, 1982 [DOI] [PubMed] [Google Scholar]
- 47. Wilson T, Bachofen H. A model for mechanical structure of the alveolar duct. J Appl Physiol 52: 1064–1070, 1982 [DOI] [PubMed] [Google Scholar]
- 48. Withers RT, Bourdon PC, Crockett A. Lung volume standards for healthy male lifetime nonsmokers. Chest 93: 91–97, 1988 [DOI] [PubMed] [Google Scholar]
- 49. Zasadzinski JA, Alig TF, Alonso C, de la Serna JB, Perez-Gil J, Taeusch H. Inhibition of pulmonary surfactant adsorption by serum and the mechanisms of reversal by hydrophilic polymers: theory. Biophys J 89: 1621–1629, 2005 [DOI] [PMC free article] [PubMed] [Google Scholar]


