Abstract
p66Shc, a promoter of apoptosis, modulates oxidative stress response and cellular survival, but its role in the progression of diabetic nephropathy is relatively unknown. In this study, mechanisms by which p66Shc modulates high-glucose (HG)- or angiotensin (ANG) II-induced mitochondrial dysfunction were investigated in renal proximal tubular cells (HK-2 cells). Expression of p66Shc and its phosphorylated form (p-p66Shc, serine residue 36) and apoptosis were notably increased in renal tubules of diabetic mice, suggesting an increased reactive oxygen species production. In vitro, HG and ANG II led to an increased expression of total and p-p66Shc in HK-2 cells. These changes were accompanied with increased production of mitochondrial H2O2, reduced mitochondrial membrane potential, increased translocation of mitochondrial cytochrome c from mitochondria into cytosol, upregulation of the expression of caspase-9, and ultimately reduced cell survival. Overexpression of a dominant-negative Ser36 mutant p66Shc (p66ShcS36A) or treatment of p66Shc- or PKC-β-short interfering RNAs partially reversed these changes. Treatment of HK-2 cells with HG and ANG II also increased the protein-protein association between p-p66Shc and Pin1, an isomerase, in the cytosol, and with cytochrome c in the mitochondria. These interactions were partially disrupted with the treatment of PKC-β inhibitor or Pin1-short interfering RNA. These data suggest that p66Shc mediates HG- and ANG II-induced mitochondrial dysfunctions via PKC-β and Pin1-dependent pathways in renal tubular cells.
Keywords: diabetic nephropathy, proximal tuble cells, mitochondria, ROS
diabetic nephropathy (dn) is one of the common complications of both type 1 and type 2 diabetes mellitus. DN is characterized by glomerular and tubular hypertrophy initially and followed by thickening of both glomerular and tubular basement membranes (38, 39). Several studies have shown that damage to tubular cells plays a significant role in the progression of DN (38, 39), and the changes in the tubulo-interstitial compartment are well reflected in the deterioration of renal functional parameters, i.e., glomerular filtration rate (26, 27). The mechanisms relevant to its progression include increased activity of polyol and hexosamine pathways, formation of advanced glycation end products, activation of protein kinase C (PKC), generation of reactive oxygen species (ROS) and activation of intrarenal renin-angiotensin system (4, 17, 33, 37). Among the spectrum of biochemical changes induced by high-glucose (HG) ambience, the generation of ROS seems to be one of the main pathophysiological mechanism (7), as a consequence of which the downstream events lead to extracellular matrix accumulation, as well as apoptosis, with the latter being predominantly confined to tubular epithelia. The major source of ROS is believed to be the mitochondrial electron transport system (13). In addition, many factors, such as ischemic renal injury (6), advanced glycation end products (5), angiotensin II (ANG II) (25, 36), besides HG (14), may also induce excessive ROS production and mitochondrial dysfunction, which eventually leads to apoptosis and necrosis of the renal tubular cells (35). Our laboratory's previous studies have shown that HG can reduce the mitochondrial membrane potential (Δψm) and enhance the release of mitochondrial cytochrome c (mCyt.C) into the cytosol with activation of caspases and ultimately apoptosis in tubular cells (32). However, the finer detailed mechanisms modulating HG or ANG II-induced mitochondrial ROS generation and subsequent downstream events in tubular cells need to be teased out further.
Adaptor protein p66Shc is a newly recognized mediator of mitochondrial dysfunction, and it is expressed in most of the mammalian tissues. It has been shown that p66Shc during the generation of hydrogen peroxide (H2O2) utilizes the mitochondrial electron transfer chain via the oxidation of Cyt.C (9, 21). During this process, the p66Shc is imported into the mitochondrial intermembrane space, which requires Ser36 phosphorylation (p-p66Shc) by PKC-β and Pin1 (29). The concept that p-p66Shc leads to the generation of ROS is supported by studies on p66Shc−/− cells, which exhibit reduced levels of intracellular ROS, decreased mitochondrial DNA (mtDNA) alterations, and resistance to apoptosis induced by a variety of stimuli, including H2O2, ultraviolet radiation, human immuodeficiency virus-1, and hypoxia/reoxygenation (12, 15, 24, 29). Similarly, p66Shc−/− mice exhibit increased resistance to oxidative stress and have a prolonged life span (24). They are also protected from the development of diabetic glomerulopathy, presumably due to a blockade of hyperglycemia-induced ROS production (23). Furthermore, it has been reported that the p66Shc mediates mitochondrial dysfunction in renal proximal tubule cells in the ischemia-reperfusion injury model (1), and ANG II induced apoptosis in myocardial cells (10). These literature reports certainly establish the role of p66Shc in states of oxidant stress. However, the role of p66Shc and the detailed mechanisms in the process of mitochondrial ROS generation and, subsequently, cell death induced by HG and ANG II in the pathobiology of the tubules remain to be investigated.
The aim of the present study was to determine the status of p66Shc expression and its phosphorylation status in diabetic kidneys, and to assess whether p66Shc contributes to mitochondrial ROS generation, their dysfunctions in renal proximal tubular cells subjected to HG ambience and ANG II exposure, and if PKC-β and Pin1 are involved in this signaling cascade.
MATERIALS AND METHODS
Animal models.
Animal studies were conducted under a protocol approved by the Institutional Animal Care and Use Committee at Central South University of China. The animals were housed in a temperature-controlled room, and they were given free access to water and standard laboratory chow. A diabetic state was induced in 8-wk-old ICR mice (N = 20) by an intraperitoneal injection of freshly prepared streptozotocin (STZ; Sigma Chemical, St. Louis, MO). The STZ was prepared by dissolving in 10 mM citrate buffer, pH 4.2. The mice received five consecutive daily injections of STZ (50 mg/kg body wt), while saline buffer served as a control. Blood glucose levels were monitored with One-Touch Glucometer (Lifescan, Milpitas, CA) by using one drop of tail blood. The mice with blood glucose levels >250 mg/dl were selected for various studies. All mice were killed 18 wk after the start of STZ treatment. C57BL/KsJ-db/db (N = 20) and their age-matched nondiabetic db/m mice were also used in the study, they were killed at 18 wk of age, and their kidneys were utilized for various studies.
In vivo studies with kidney tissues in diabetic mice.
First, apoptosis was assessed by terminal deoxynucleotidyl transferase dUTP-mediated nick-end labeling (TUNEL) method, using In Situ Cell Death Detection Kit, following vendor's instructions (5). Renal tissue sections for immunostaining were deparaffinized and incubated with 3% H2O2 solution. The sections were then incubated with antibodies directed against p66Shc and phospho-p66Shc (Ser36) (Calbiochem), respectively. The tissue antigen retrieval was performed as previously described (18, 32). The sections were coverslip mounted and examined with a Zeiss fluorescence microscope. Intracellular generation of O2·− was assessed using the O2− reporter dye dihydroethidium (Sigma-Aldrich). For Western blotting, protein concentration of the cell or tissue lysates was adjusted to 1 mg/ml. This was followed by SDS-PAGE and by transfer of proteins onto a nitrocellulose membrane by Western blotting procedures. The immunoreactive bands in the membranes were visualized by using enhanced chemiluminescence reaction kit (ECL, Amersham Pharmacia Biotech, Piscataway, NJ), and integrated density of each band from six blots was quantified.
In vitro cell culture studies under HG ambience and different concentrations of ANG II.
A proximal tubular cell line, HK-2 (ATCC, Rockville, MD), was maintained in DMEM medium supplemented with 10% FBS, 100 U/ml of penicillin, 100 μg/ml of streptomycin, and incubated at 37°C in a 5% CO2 environment. Cells were transfected with p66Shc wild type (WT) or the p66ShcS36A mutant (Addgene, Cambridge, MA) using LIPOFECTAMINE 2000 reagent (Invitrogen, Carlsbad, CA), as previously discussed (32). After selection of stable transfectants, cells were maintained in a defined medium. After achieving 80% cell confluency, the medium was changed to FBS-free DMEM. Varying concentrations of d-glucose (5–45 mM) and ANG II (10−9-10−5) were added. HK-2 cells stably transfected with p66Shc or its mutant p66ShcS36A were subjected to HG ambience. The mRNA and protein expression were determined by real-time PCR and Western blotting procedures, respectively.
Gene expression and mtDNA studies.
Total RNAs of HK-2 cells were isolated by TRIzol method. First-strand cDNAs were generated by two-step RT-PCR (Fermentas Life Science). Real-time PCR was performed in an Applied Biosystems 7300 Real-time RCR System using a SYBRgreen PCR reagent kit (Invitrogen). The change in mRNA levels was determined by the formula 2−(ΔΔCT), where ΔCT is the value from the threshold cycle (CT) of the treated sample subtracted from the CT value of untreated or zero time point control sample. The relative amount of mRNA in the sample was normalized to β-actin mRNA. The PCR primers were as follows: p66Shc-sense, 5′-CCACTCCGG AATGAGTCTCT-3′, and antisense, 5′-GAAGGAGCACAGGGTAG TGG-3′; β-actin sense, 5′-ACTCTTCCA GCCTTCCTTCC-3′, and antisense, 5′-GAGGAGCAATGATCTTGATCTTC-3′. The mtDNA damage of high- and low-molecular-weight DNAs was evaluated by PCR using a REPLI-g mitochondrial DNA isolation kit (QIAGEN), following vendor's instructions. The PCR was used to simultaneously coamplify both the high- and low-molecular-weight mtDNA. For the high-molecular-weight DNA, the PCR primers were as follows: sense, 5′-TACTAGTCCGCGAGCCTT CAAAGC-3′, and antisense, 5′-GGGTGATCTTTGTTTGCGGGGT-3′; for low-molecular-weight DNA the primers were as follows: sense, 5′-CGACAGCT AAGACCCAAACTGGG-3′, and antisense, 5′-CCCATTTCTTCCCATTTCATTGGC-3′. PCR products of 8,636 and 316 bp were visualized following agarose gel electrophoresis, and a ratio between the high- and low-molecular-weight DNA products was calculated.
Protein expression.
The protein expression was evaluated by Western blotting procedures. The total protein of HK-2 cell was isolated with the use of RIPA lysis buffer containing a cocktail of protease inhibitors. Mitochondria and cytosolic extracts were prepared from HK-2 cells using a mitochondrial isolation kit (Pierce, Rockford, IL) and by following the vendor's instructions. Expression of cytochrome c (Cyt.C) in isolated mitochondria, and total p66Shc (p66Shc), p-p66Shc, and caspapse 9 in cytosolic extracts was assessed, using anti-Cyt.C, anti-p66Shc, anti-p-p66Shc (Ser36 site), and anti-caspapse 9 antibodies (Santa Cruz, CA), respectively. The anti-mitochondrial heat shock protein 70 (mHSP70) antibody (Novus Biologicals, Littleton, CA) was used where mitochondrial fractions were needed as loading controls.
Detection of cellular apoptosis and Δψm.
Apoptosis in HK-2 cells was assessed by using in situ cell death detection kit (Roche Applied Science) following vendor's instructions. The Δψm was measured by staining the cells with tetramethylrhodamine ethylester perchlorate (TMRE; Molecular Probes). The samples were analyzed using a FACSCalibur BD Flow Cytometry, as previously described (31).
Detection of intracellular H2O2 and assessment of mitochondrial O2−.
The H2O2-sensitive fluorescence probe dichlorofluorescein diacetate (DCFH-DA) was used to assess the generation of intracellular H2O2, as previously discussed (9, 31). To detect mitochondrial O2·−, MitoSOX Red (Invitrogen) staining was carried out as described (31). The DCFH-DA fluorescence was visualized at an excitation at wavelength of 488 nm and emission at 520 nm. For detection of MitoSOX, 514-nm excitation and 585-nm emission wavelengths were used in a Zeiss LSM510 laser scanning confocal microscope equipped with band-pass filter (Zeiss LSM 510; Carl Zeiss, Thornwood, NY). Intracellular H2O2 and mitochondrial O2·− were also detected by FACS analysis after staining with respective dyes (31).
Confocal microscopy.
Confocal microscopy was also used to localize the distribution of Cyt.C. HK-2 cells were incubated with 25 nM of Mitotracker red (Molecular Probes, Eugene, OR) at 37°C for 10 min. Slides were washed with PBS and fixed in 4% formaldehyde. They were then incubated with primary anti-Cyt.C antibody (Santa Cruz, CA), followed by another incubation with FITC-labeled secondary antibody. The cells were also subjected to 4,6-diamidino-2-phenylindole staining to visualize nuclei by confocal microscopy, using different excitation filters, followed by merging of various images into a single frame (31).
Lactate dehydrogenase and malondialdehyde measurements in cellular oxidant injury.
The levels of lactate dehydrogenase (LDH) and malondialdehyde (MDA) released from damaged HK-2 cells into the culture media were measured using LDH and MDA assay kits both from Promega (Madison, WI).
Immunoprecipitation and Western blotting studies with p66Shc, p-p66Shc, Cyt.C, and Pin1.
First, the protein concentration in each sample was adjusted to 1 mg/ml, and it was divided into two equal aliquots. Each aliquot containing 100 μg of protein was used for immunoprecipitation (IP) with two different antibodies. Samples were individually incubated with various antibodies [anti-phosphorylated (Ser36) p66Shc antibody, anti-Pin1 antibody, or anti-mCyt.C antibody; Sigma-Aldrich] in an IP buffer for 12 h at 4°C with gentle orbital rotation. Then 50 μl of protein A-Sepharose beads were added, and the incubation was extended for another 12 h. The beads were washed with the IP buffer and resuspended in SDS loading buffer, and then the entire sample was subjected to 10% SDS-PAGE followed by Western blotting procedures (32).
RESULTS
p66Shc and p-p66Shc expression, apoptosis, and ROS production in the kidneys of mice with type 1 and type 2 diabetes.
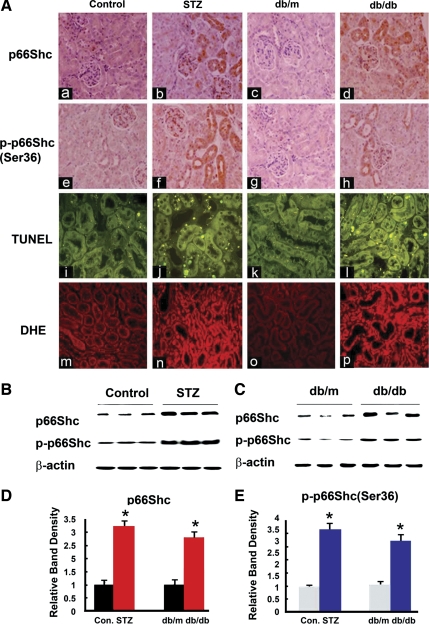
p66Shc and p-p66Shc expression in diabetic mice kidneys was evaluated by immunohistochemical procedures (Fig. 1A, a–h). Apoptosis was assessed by TUNEL assay (A, i–l), and ROS production measured using ROS-sensitive vital dye dihydroethidium (A, m–p). In control ICR mouse and db/m mice, expression of p66Shc (Fig. 1A, a and c) and of phosphorylated (p)-p66Shc (Ser36 residue) (Fig. 1A, e and g) was quite low, and it localized mainly in the renal proximal tubules and glomerular mesangium, while the signal was notably increased in the renal proximal tubules of the kidneys of mice with STZ-induced diabetes (Fig. 1A, b and f) and db/db mice at 14 wk of age (Fig. 1A, d and h). In comparison to control, apoptotic cells were increased, and they were mainly confined to the cortical tubules of STZ mice (Fig. 1Aj) and db/db mice at 18 wk (Fig. 1Al). In addition, ROS production was also increased in the renal proximal tubules of STZ mice (Fig. 1An) and db/db mice at 18 wk (Fig. 1Ap). The p66Shc and p-p66Shc protein expression was also evaluated by Western blotting procedures. A dramatically increased p66Shc and p-p66Shc expression was observed in diabetic mice kidneys (Fig. 1, B and C). Densitometric analyses revealed two- to threefold increase of p66Shc/p-p66Shc expression in the kidney tissues of STZ mice and db/db mice compared with the control and db/m mice, respectively (Fig. 1, D and E).
Fig. 1.
A: expression of p66Shc and phosphorylated p66Shc (at Ser36 residue) (p-p66Shc; a–h), status of apoptosis (i–l), and oxidant stress (m–p) in kidneys of control CD1 (ICR) mice (column 1: a, e, i, and m) and those with streptozotocin (STZ)-induced diabetes mice (column 2: b, f, j, and n), db/m mice (column 3: c, g, k, and o), and db/db (column 4: d, h, l, and p) mice. In control mice (ICR and db/m), p66Shc and p-p66Shc expression mainly localized in the proximal tubules, and it was increased in mice with STZ-induced diabetes and db/db mice. The terminal deoxynucleotidyl transferase dUTP-mediated nick-end labeling (TUNEL) staining to mark the apoptotic nuclei also notably increased in kidney sections of diabetic mice, compared with the controls (i–l). Similarly, dihydroethidine (DHE) staining to assess the ROS generation showed increased staining in the cortical tubular cells of STZ-induced and db/db mice (m–p). Magnifications: ×200. B and C: Western blot (WB) analyses showed that both p66Shc and p-p66Shc expression were increased in the cortical kidney homogenates of diabetic mice. D and E: densitometry of the autoradiographic bands were depicted in B and C, respectively. Each bar graph represents a relative density ratio between p66Shc or p-p66Shc to β-actin. Values are means ± SE; N = 20 in each group. *P < 0.01 vs. control (Con).
p66Shc and p-p66Shc expression increased in HK-2 cells subjected to HG or ANG II treatment.
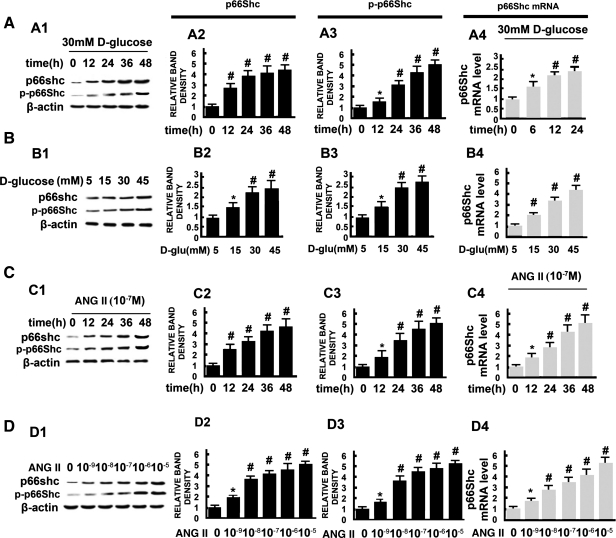
HK-2 cells (an immortalized proximal tubule epithelial cell line derived from normal adult human kidney) were exposed to different concentrations of d-glucose or ANG II, as indicated, and p66Shc mRNA and protein expression were assessed. As shown in Fig. 2, HG significantly increased the levels of p66Shc mRNA in a time- and dose-dependent manner (Fig. 2, A4 and B4). Similarly, protein expression of total p66Shc, as well as phosphorylated p66Shc (at Ser36 residue), was significantly increased in a time- and dose-dependent manner in HK-2 cell treated with HG (Fig. 2, A and B). The expression of p66Shc in cells treated with l-glucose was unchanged (data not included). Treatment of HK-2 cells with different concentrations of ANG II (10−9-10−5) (Fig. 2, C and D) also caused an increased in the expression of mRNA, as well as of the protein of both the total p66Shc and its phosphorylated form, and these changes paralleled that seen with the exposure of HG.
Fig. 2.
Expression of p66Shc and p-p66Shc in HK-2 cells following exposure to high glucose (HG; 5–45 mM) and angiotensin II (ANG II; 10−9-10−5 M), as assessed by WB analysis (A1–A3, B1–B3, C1–C3, D1–D3) and real-time PCR (A4, B4, C4, D4). Expression of both p66Shc and p-p66Shc increased in a time- and dose-dependent manner in HK-2 cells treated with d-glucose (A and B) and ANG II (C and D). Expression of β-actin was unchanged. The bar graphs (columns 2, 3, and 4) represent the expression of p66Shc and p-p66Shc relative to β-actin. Values are means ± SE; N = 6. *P < 0.05, #P < 0.01 vs. control.
Effect of p66ShcS36A mutant, p66Shc-short interfering RNA, and PKC-β-short interfering RNA on the p66Shc and p-p66Shc protein expression in HK-2 cells subjected to HG or ANG II.
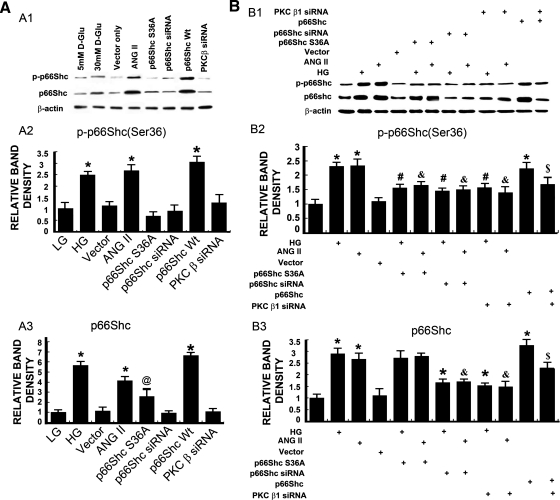
HK-2 cells were transfected with mutant p66ShcS36A, p66Shc-short interfering RNA (siRNA), or PKC-β-siRNA and then exposed to HG or ANG II. The p66Shc and p-p66Shc protein expression was assessed by Western blotting procedures with anti-p66Shc antibody and anti-phosphorylated (Ser36) p66Shc antibody, respectively. Treatment with HG (30 mM), ANG II (10−7), or overexpression of WT p66Shc increased expression of both p66Shc and p-p66Shc compared with that of the control (P < 0.01) (Fig. 3). The increase was not observed in cells transfected with a dominant-negative Ser36 mutant of p66Shc (p66ShcS36A), vector alone, or p66Shc-siRNA. A minor increase in the expression of total protein was observed in HK-2 cells transfected with p66ShcS36A mutant from the baseline (Fig. 3A). The HG or ANG II-induced expression of p66Shc and p-p66Shc in HK-2 cells was abolished following transfection with p66ShcS36A or pretreatment with p66Shc-siRNA or PKC-β-siRNA (Fig. 3B). This suggested that HG and ANG II induced p66Shc expression, as well as its phosphorylation at Ser36 residue, and it is conceivably mediated by PKC-β.
Fig. 3.
A1–A3: expression of p66Shc and p-p66Shc in HK-2 cells subjected to HG and ANG II treatments or individually transfected with wild-type (WT) p66Shc, p66ShcS36A (mutant), p66Shc-short interfering RNA (siRNA), or PKC-β-siRNA. The HG and ANG II treatment or overexpression of p66Shc significantly increased the expression of both p66Shc and p-p66Shc. The overexpression of p66ShcS36A mutant increased the expression of p66Shc, but not of its phosphorylated form, p-p66Shc. Transfection of empty vector or p66Shc-siRNA or PKC-β-siRNA had no significant effect on both p66Shc and p-p66Shc expression. B1–B3: effect of p66Shc, p66ShcS36A, p66Shc siRNA, or of PKC-β-siRNA on the expression of p66Shc and p-p66Shc in HK-2 cell that were treated with HG or ANG II. The p66Shc and p-p66Shc protein expression was increased in HK-2 cell treated with HG and ANG II, and this effect was abolished following transfection with p66Shc-siRNA or PKC-β-siRNA. The transfection of p66ShcS36A had no effect on the expression of p66Shc compared with HG or ANG II-treated groups, but it reduced the expression of p-p66Shc. Overexpression of p66Shc significantly increased the p66Shc and p-p66Shc protein expression, which was reduced following PKC-β-siRNA transfection. The bar graphs represent the densitometric measurements of the protein expression. Values are means ± SE; N = 6. *P < 0.01 vs. 5 mM d-glucose [low glucose (LG)]. @ P < 0.05 vs. 30 mM d-glucose. #P < 0.01 vs. 30 mM d-glucose (HG). & P < 0.01 vs. ANG II (10−7 M). $ P < 0.01 vs. p66Shc WT.
Overexpression of p66Shc S36A and PKC-β siRNA attenuates the generation of intracellular ROS (H2O2) and mitochondrial superoxide in HK-2 cells subjected to HG or ANG II.
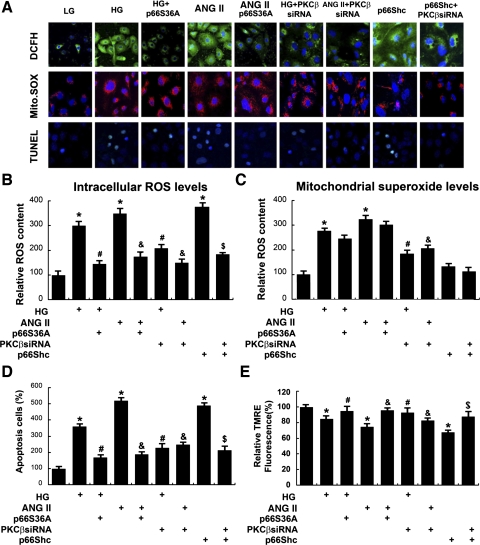
HG and ANG II (10−7) significantly increased the intracellular ROS, as assessed by cells stained with DCFH-DA (a fluorochrome that detects ROS, H2O2) and MitoSOX (a fluorescent indicator of mitochondrial superoxide, O2·−), and then examined by confocal microscopy (Fig. 4A). The effect on H2O2 production was abolished in cells transfected with p66ShcS36A or PKC-β siRNA. In addition, HG or ANG II also increased the mitochondrial “superoxide” (O2·−) levels, which were not significantly reduced by transfection with p66ShcS36A, but certainly by the treatment of PKC-β-siRNA (Fig. 4, A and C). The results were also confirmed by FACS analyses (Fig. 4, B and C). By TUNEL staining, a notable increase of apoptosis in cells treated with HG or ANG II was observed, and it was dramatically reduced following treatment with p66ShcS36A or PKC-β-siRNA (Fig. 4, A, bottom row, and D). As assessed by TMRE staining, the Δψm in HK-2 decreased after their incubation with HG or ANG II, which was almost restored to baseline with the overexpression of p66ShcS36A or PKC-β-siRNA (Fig. 4E). Transfection of HK-2 cells with p66Shc WT plasmid induced H2O2 generation, increased apoptosis, and decreased Δψm, and these changes were blocked with the PKC-β-siRNA treatment.
Fig. 4.
A, rows 1–3: confocal microscopy images of cells subjected to dichlorofluorescein-diacetate (DCFH-DA), MitoSOX, and TUNEL staining, and quantification of apoptosis and mitochondrial membrane potential (Δψm). By DCFH-DA staining, overexpression of p66ShcS36A, or treatment of PKC-β-siRNA attenuated intracellular reactive oxygen species (ROS) generation in HK-2 induced by HG (30 mM) or ANG II (10−7 M), while treatment of PKC-β-siRNA reduced ROS production in HK-2 induced by p66Shc serving as positive control (row 1). Similar results were seen upon staining with MitoSOX; however, there was no change observed in cells transfected with p66ShcS36A or p66Shc siRNA (row 2). TUNEL staining showed that HG or ANG II increased the degree of apoptosis, which was reduced with the transfection of p66ShcS36A or treatment of PKC-β-siRNA (row 3). B and C: the bar graphs represent a summary of flow cytometry analyses of cells stained with DCFH-DA and MitoSOX. D: the bar graph represents the quantification of apoptosis in HK-2 cells by TUNEL assay. E: Δψm as measured by tetramethylrhodamine ethylester perchlorate (TMRE) staining revealed a decrease of Δψm in HK-2 cells following HG and ANG II treatments, which was restored with the overexpression of p66ShcS36A or treatment of PKC-β-siRNA. Values are means ± SE; N = 6. *P < 0.01 vs. 5 mM d-glucose. #P < 0.01 vs. 30 mM d-glucose. & P < 0.01 vs. ANG II (10−7 M). $ P < 0.01 vs. p66Shc WT.
Overexpression of p66ShcS36A and PKC-β-siRNA normalized HG or ANG II-induced Cyt.C release and caspase-9 activation.
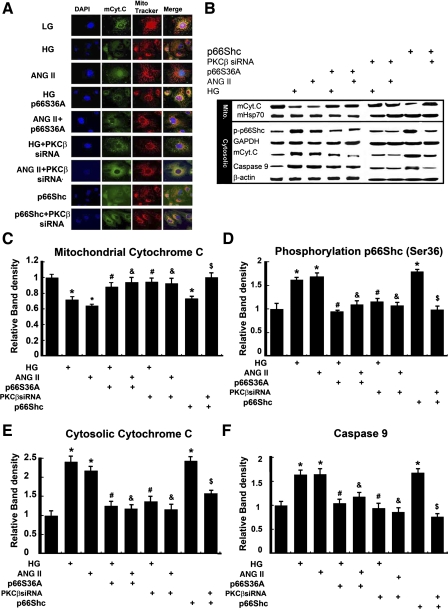
Compared with low glucose (5 mM), HG (30 mM) and ANG II (10−7 M) induced the translocation of mCyt.C from mitochondria into the cytosolic compartment in HK-2 cells (Fig. 5A, rows 2 and 3 vs. 1), as assessed by confocal laser scanning microscopy. Following transfection with p66ShcS36A or PKC-β-siRNA, an inhibition of translocation was observed (Fig. 5A, rows 4 and 6 vs. 2, and rows 5 and 7 vs. 3). These results were confirmed by Western blot analyses. As shown in Fig. 5B, the HK-2 cells treated with HG or ANG II exhibited dramatic decreased expression of mCyt.C in the mitochondrial fractions. The mHSP70 served as a loading control (Fig. 5B, top panel). The expression of mCyt.C and caspase-9 increased significantly in the cytosolic extracts (Fig. 5B, bottom panel). These effects were abolished with the transfection of p66ShcS36A and or PKC-β-siRNA (Fig. 5B, column 4 vs. 2, column 5 vs. 3, column 6 vs. 2, column 7 vs. 3). Using an antibody that specifically recognizes p-p66Shc at Ser36, the Western blotting procedures indicated that HG and ANG II treatments increased the expression of p-p66Shc in HK-2 cells (Fig. 5B), which was notably reduced in cells transfected with p66ShcS36A or PKC-β-siRNA. The HK-2 cell overexpressing p66Shc induced mCyt.C release and increased p-p66Shc expression, and it was reduced with the treatment of PKC-β-siRNA. Densitometric analyses of the band intensities of various experiments are shown in Fig. 5, C–F.
Fig. 5.
Effect of p66Shc on the HG- or ANG II-induced cytochrome c (Cyt.C) release. A: confocal microscopy revealed that, at a basal low concentration of d-glucose (LG, 5 mM), the Cyt.C is localized in the mitochondria (mCyt.C), as detected by anti-mCyt.C antibody (green, column 2) or Mitotracker dye (red, column 3). With the treatment of 30 mM d-glucose (HG) or ANG II (10−7 M), the Cyt.C was released into cytosol, and the release was inhibited by transfection of p66ShcS36A or PKC-β-siRNA. B: distribution of p-p66Shc, Cyt.C, and caspase-9 in mitochondrial vs. cytoplasmic compartments following various treatments, as assessed by WB analysis, with mitochondrial heat shock protein 70 (mHSP70) or GAPDH served as loading controls. C–F: the bar graphs represent a summary of WBs reflecting expression of mCyt.C (C) cytosolic Cyt.C (E), p-p66Shc (D), and caspase-9 (F). The HG or ANG II induced a decrease of mCyt.C and increase of p-p66Shc, cytosolic Cyt.C, and caspase-9, while overexpression of p66ShcS36A mutant or treatment of PKC-β-siRNA reversed these changes. Transfection of p66Shc WT had similar effects, as induced by HG or ANG II treatments on the expression of Cyt.C, p-p66Shc, and caspase-9, and they were inhibited by PKC-β-siRNA. DAPI, 4,6-diamidino-2-phenylindole. Values are means ± SE; N = 6. *P < 0.01 vs. control of 5 mM d-glucose. #P < 0.01 vs. 30 mM d-glucose. & P < 0.01 vs. ANG II (10−7 M). $ P < 0.01 vs. p66SShc WT.
Overexpression of p66Shc-siRNA and treatment with PKC-β-siRNA inhibit oxidative damage in HK-2 cells subjected to HG or ANG II.
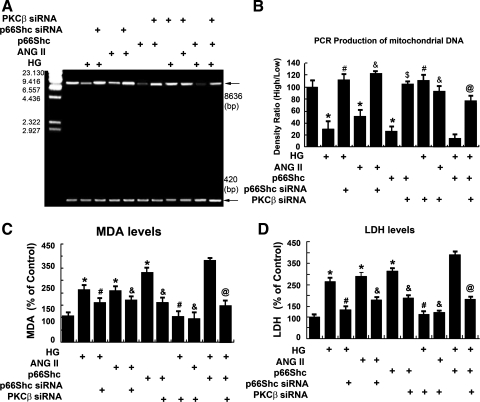
As shown in Fig. 6, A and B, compared with control, the 8,636-bp PCR amplification product of mtDNA was decreased in the HK-2 cells treated with HG or ANG II (lanes 2 and 4 vs. 1). This effect was dampened in cells transfected with p66Shc-siRNA (lanes 3 and 5 vs. 2 and 4) or following the treatment with PKC-β siRNA (lanes 8 and 9 vs. 2 and 4). Interestingly, the 8,636-bp PCR product also dramatically decreased in the HK-2 cells exposed to HG and transfected with p66Shc WT plasmid compared with HG treatment or p66Shc transfection alone (lane 10 vs. 6 and 2). However, PKC-β-siRNA partially reversed this effect (lane 11 vs. 10). The MDA and LDH levels increased in HK-2 cells exposed to HG, ANG II, or p66Shc compared with the controls. Conversely, their levels were reduced in cells transfected with p66Shc-siRNA (Fig. 6, C and D). The PKC-β-siRNA notably decreased LDH and MDA levels induced by HG, ANG II or by overexpression of p66Shc (Fig. 6, C and D).
Fig. 6.
A: status of mitochondrial DNA (mtDNA) in HK-2 cells exposed to HG or ANG II. HG or ANG II treatment led to a reduction in the expression of high-molecular-weight DNA (8,636 bp), while low-molecular-weight DNA (420 bp) was unaffected. These changes were normalized by the overexpression of p66ShcS36A or treatment of PKC-β-siRNA. The PKC-β-siRNA partially reversed the p66Shc-induced changes as well, which served as a positive control. B: the bar graph represents the densitometric analyses of the PCR product bands, followed by calculation of the high mtDNA-to-low mtDNA ratio. C and D: bar graphs depicting malondialdehyde (MDA) and lactate dehydrogenase (LDH) levels. Overexpression of p66ShcS36A or treatment of PKC-β-siRNA restored the increased MDA and LDH levels caused by HG or ANG II treatments. Values are means ± SE; N = 6. *P < 0.01 vs. 5 mM d-glucose. #P < 0.01 vs. 30 mM d-glucose. & P < 0.01 vs. ANG II (10−7 M). $ P < 0.01 vs. p66Shc WT. @ P < 0.01 vs. p66Shc WT + HG.
PKC-β and Pin1 pathway modulates the mitochondrial events related to altered expression of p66Shc induced by HG or ANG II.
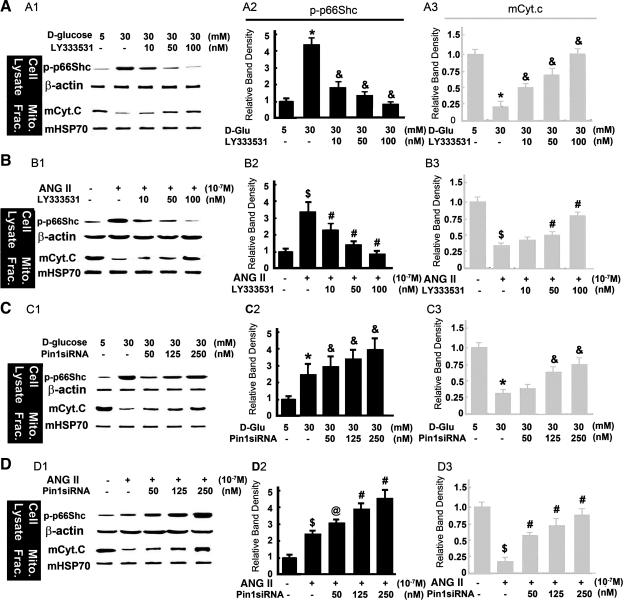
As shown in Fig. 7, A and B, compared with control, HG or ANG II significantly increased p66Shc-S(36) phosphorylation in cytosolic fraction, and it was blocked in a dose-dependent manner in HK-2 cells treated with PKC-β inhibitor, LY333531(10–100 nM). The expression of β-actin was unchanged (Fig. 7, A and B, top panels). The mCyt.C expression decreased in mitochondrial extracts of HK-2 treated with HG or ANG II, and PKC-β inhibitor reversed the effect in a dose-dependent manner (Fig. 7, A and B, bottom panels). Expression of mHSP70, serving as a loading control, was unchanged. An increased expression of p-p66Shc in the cytoplasm, while a decreased expression of mCyt.C in the mitochondrial fraction of HK-2 treated with 30 mM d-glucose or 10−7 M of ANG II, was seen compared with that of low glucose. After treatment with Pin1-siRNA (50–250 nM), the level of p-p66Shc expression in the cytoplasm was increased (Fig. 7, C and D, top panels), and also the Cyt.c expression in the mitochondrial fraction was restored almost to baseline in a dose-dependent manner (Fig. 7, C and D, bottom panels) compared with HG or ANG II treatments (Fig. 7, C and D, bottom panels, lanes 3–5 vs. 2). The expression of both β-actin and mHSP70 was unchanged. These data indicate that the PKC-β inhibitor mediates p66Shc phosphorylation and subsequent Cyt.C release from mitochondria into the cytosol in HK-2 cell treated with HG and ANG II, while the Pin1-siRNA reduces the p66Shc translocation into the mitochondria and decreases the mCyt.C release.
Fig. 7.
Expression of cytosolic p-p66Shc and mCyt.C in HK-2 cells exposed to HG and ANG II and treated with PKC-β inhibitor (LY333531) and Pin1 siRNA. A1, B1, C1, and D1: WB profiles of p-p66Shc and mCyt.C following various treatments. The β-actin and mHSP70 served as respective cytosolic and mitochondrial loading controls. A2, B2, C2, D2, A3, B3, C3, and D3: the bar graphs represent the density of the p-p66Shc (column 2) and mCyt.C (column 3) bands detected by WB procedures relative to that of β-actin and mHSP70. The PKC-β inhibitor partially normalized the HG or ANG II-induced changes in a dose-dependent manner in both cytosolic (p-p66Shc) and mitochondrial (mCyt.C) fractions. The Pin1-siRNA treatment also partially normalized the HG or ANG II-induced changes in the mitochondrial (mCyt.C), while they were accentuated in cytosolic (p-p66Shc) fractions. Values are means ± SE; N = 6. *P < 0.01 compared with 5 mM of LG. & P < 0.01 compared with HG. $P < 0.01 compared with 0 μM ANG II. @ P < 0.05 vs. 0 μM ANG II. #P < 0.01 vs. 10−7 M ANG II.
HG and ANG II modulate the protein-protein interactions between phosphorylated form of p66Shc (p-p66Shc) and Pin1 in the cytosol and with Cyt.C in the mitochondrial.
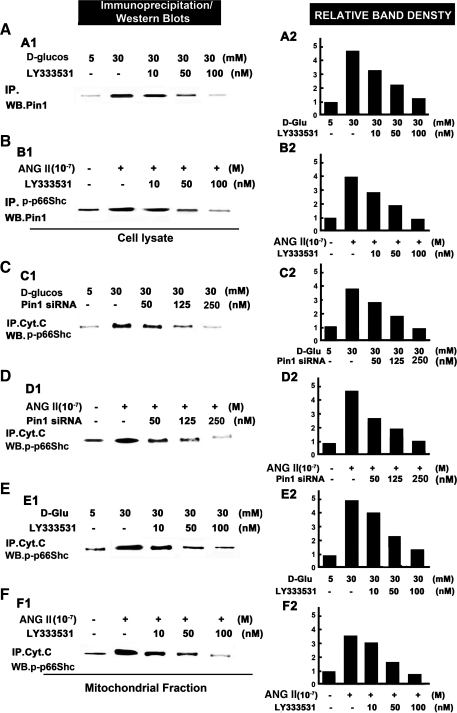
The HK-2 cells were treated with HG or ANG II, following which the cytosolic and mitochondrial proteins were isolated and subjected to immunoprecipitation/Western blotting procedures. A notable increase in the binding was seen in HK-2 cells treated with HG or ANG II, which represented an interaction between p-p66Shc and Pin1 in the cytosolic extracts (Fig. 8, A1, A2, B1, and B2, lane 2 vs. 1), while the PKC-β-selective inhibitor LY333531 ameliorated this effect (lanes 3–5 vs. 2) in a dose-dependent manner. An increased association of p-p66Shc with mCyt.C in the mitochondrial fraction of HK-2 cells treated with HG or ANG II was observed compared with control (Fig. 8, C and D, lane 2 vs. 1), whereas this effect was abolished with the treatment of Pin1 siRNA (Fig. 8, C1, C2, and D1, D2, lanes 3–5 vs. 2). Similar results were seen with the treatment of PKC-β inhibitor, LY333531 (Fig. 8, E1, E2, F1, and F2), indicating that HG or ANG II enhances the interactions between p-p66Shc and Pin1 in the cytosol, and between p-p66Shc and Cyt.C in mitochondria, and such associations are conceivably mediated by PKC-β and Pin1.
Fig. 8.
Protein-protein interactions between p-p66Shc and Pin1 in the cytosol (A and B), and between Cyt.C and p-p66Shc (C–F) in the mitochondria following HG, ANG II, PKC-β inhibitor (LY333531), and Pin1-siRNA treatments. The interactions were assessed by immunoprecipitation (IP)/WB procedures. A and B: the LY333531 inhibits the protein-protein interactions between p-p66Shc and Pin1 in the cytosolic fraction of HK-2 cells treated with HG or ANG II in a dose-dependent manner. A1 and B1 are autoradiograms, while A2 and B2 represent the densitometric analysis of density of the respective bands. C–F: both LY333531 and Pin1-siRNA inhibit the protein-protein interactions between p-p66Shc and mCyt.C in the mitochondrial fraction of HK-2 cells treated with HG or ANG II in a dose-dependent manner. C1, D1, E1, and F1 are autoradiograms, while C2, D2, E2, and F2 represent the densitometric analysis of density of the respective bands. The data included in A2, B2, C2, D2, E2, and F2 are representative of 3 experiments.
DISCUSSION
A number of pathways and molecules have been incriminated in the progression of DN. These mechanisms have been mainly elucidated in the context of pathobiology of the glomerulus, and conceivably they may be also applicable to the proximal tubular compartment that is enriched with mitochondria having metabolic energy demands. The renal proximal tubular cell damage and apoptosis following the generation of ROS has been reported be responsible for the early stages of DN (3), and their sustained assault is believed to be critical in the progression of DN (34). The HG and ANG II seemed to be the key factors in the induction of intracellular ROS generation in the mitochondrial compartment, and that eventually leads to oxidative damage and apoptosis in renal cells (8, 11, 16, 28). The p66Shc is a newly recognized mediator of mitochondrial dysfunction, which, by oxidizing Cyt.C in the mitochondria, leads to the generation of H2O2, and these sequence of events have been reported to be responsible for the pathogenesis of acute kidney injury in ischemia-reperfusion model (1). However, very limited literature information is available that documents the status of p66Shc phosphorylation in the diabetic state and the effects of p66Shc in HG and ANG II-induced intracellular ROS generation in the mitochondria of tubular cells in hyperglycemia-induced injury models.
To pursue the present study, first we established that both p-p66Shc and total p66Shc protein are mainly localized in the renal proximal tubules, and their expression increases in mice with STZ-induced diabetes (type 1) and db/db mice (type 2), which apparently induce an increased oxidative damage to the tissues, leading to apoptosis (Fig. 1). Similarly, an increased expression of both total and p-p66Shc protein expression was seen in the HK-2 cells treated with HG or ANG II. The HG has been shown to increase the synthesis of ANG II (8) and expression of p53, a transcription factor. Interestingly, the consensus sequences for the binding of this transcription factor have been localized in the promoter region of p66Shc (19). Thus the observed increase of p66Shc mRNA expression in DN may be via the ANG II-induced modulation of p53. Other factors modulating the biology of p66Shc may include PKC-β, which is known to be activated by hyperglycemia and oxidative stress (20). Conceivably, the PKC-β can phosphorylate p66Shc at Ser36 residue (9), and, consequently, the p-p66Shc would further increase the generation of ROS (9, 29). To address the above contention, HK-2 cells were pretreated with PKC-β siRNA and p66Shc siRNA and then exposed to HG or ANG II. The results showed an inhibition of p66Shc phosphorylation induced by HG or ANG II. Furthermore, inhibition of p-p66Shc expression following the transfection of p66ShcS36A mutant confirmed that S36 residue is critical for its phosphorylation by PKC-β.
Among the Shc protein family, the p66Shc has an additional NH2-terminal calponin homology (CH) domain, known as CH2, which includes serine36 amino acid residue phosphorylation site. This domain is believed to function as an oxido-reductase redox enzyme and has been implicated in mitochondrial H2O2 generation and translation of oxidative stress signals into apoptosis (2). The next question addressed in this investigation was whether the p-p66Shc is involved in the intracellular ROS production in HK-2 cells following the treatment of HG or ANG II. This was assessed by the use of DCFH-DA, a dye probe that measures ROS (H2O2) in the cytosol, as well as in cellular organelles, such as mitochondria. As elucidated in Fig. 4, HG and ANG II, or overexpression of p66Shc (a positive control) increased intracellular ROS production, and this effect was blocked by overexpression of either p66ShcS36A or PKC-β siRNA. To assess if the superoxide, O2·−, is generated in the mitochondria of HK-2 via p66Shc mediation, MitoSOX, a mitochondrial O2·− indicator, was employed. The p66Shc S36A mutant failed to reduce significantly the mitochondrial O2·− generation induced by HG and ANG II, while reduced by PKC-β siRNA. These observations support the results of previous studies that ANG II and HG induce mitochondrial H2O2 production (4, 14). Additional conclusions that can be drawn from our studies include that HG or ANG II leads to the activation of PKC-β, which then induces Ser36-phosphorylation of p66Shc and its translocation into the mitochondria to stimulate H2O2 generation in HK-2 cell, while p66Shc seems to not be responsible for directly mediating mitochondrial O2·− production, since its dominant-negative mutant (p66ShcS36A) had a marginal effect. However, p66Shc is capable of inducing cellular apoptosis and perturbing Δψm under the influence of HG and ANG II, and these effects are certainly consistent with the fact that there was an increase in the levels of intracellular ROS. Collectively, these data demonstrate that PKC-β/p66Shc pathway activated by HG or ANG II induced H2O2 generation within mitochondria, followed by mitochondrial dysfunction and apoptosis.
With respect to the distal events in the mitochondrial that lead to apoptosis, Lee et al. demonstrated ANG II-induced Cyt.C release from the mitochondria concurrent with caspase-3 activation and DNA fragmentation, as well as apoptosis in primary lung endothelial cells (22). As our laboratory reported earlier, the activation of mitochondrial proapoptotic pathway can also be induced by HG (18, 32); however, the mechanisms by which ANG II modulates mitochondrial cell death in renal proximal tubular cells has not been previously reported. Our findings clearly implicate that HG and ANG II or overexpression of p66Shc increases p66Shc phosphorylation, enhances the release of Cyt.C from the mitochondria into the cytoplasm, activates caspase-9, and damages the mitochondrial DNA, and these effects are reversed by the treatment with p66ShcS36A, p66Shc-siRNA, and PKC-β-siRNA (Fig. 5). Other markers of cell death include LDH and lipid hydroperoxides (MDA), and they have been widely used as indicators of ROS production in various cells, including tubular cells (30). Both HG and ANG II induced a notable increase in the cellular levels of LDH and MDA in HK-2 cells, and they were also associated with increased fragmentation of high-molecular-weight mtDNA (Fig. 6). The low-molecular-weight mtDNA was unaffected. These findings basically confirm our contention that PKC-β/p66Shc are the essential modulators that lead to the HG or ANG II-induced mitochondrial dysfunction and subsequent cellular changes in renal proximal tubular cells.
Peptidyl prolyl cis-trans isomerase 1, Pin1 (21), belongs to the parvulin subfamily of peptidyl prolyl cis-trans isomerases. The PKC-β-mediated phosphorylation of p66Shc triggers its translocation into the mitochondrial compartment, where it gets associated with Pin1, and this association plays a key role in the generation of H2O2. Experiments were carried out if the PKC-β-mediated p66Shc phosphorylation leads to the association of p-p66Shc with Pin1 to induce cellular oxidant stress. The HK-2 cells exposed to HG and ANG II were treated with LY333531, a PKC-β selective inhibitor. As shown in Fig. 7, A and B, HG and ANG II induced p66Shc and Cyt.C expression in the cytosolic and mitochondrial compartments, respectively, while LY333531 treatment inhibited the expression of p-p66Shc. The treatment of HK-2 cells subjected to HG and ANG II with Pin1 siRNA increased p-p66Shc expression in cytosolic and Cyt.C in the mitochondrial fraction, indicating that PKC-β and Pin1 not only modulate p66Shc activation, but also are involved in its translocation into the mitochondria, which is followed by p66Shc-Pin1 protein-protein interactions. This contention is indirectly supported by the mutational analyses experiments, where transfection of p66ShcS36A, a mutant lacking serine phosphorylation site, failed to yield the above-described effects. Besides protein-protein interaction between p-p66Shc and Pin1, interaction between p-p66Shc and Cyt.C can conceivably occur to accomplish the cascade of apoptosis. This was assessed by the Western blotting combined with IP experiments, in which usage of the antibodies was exchanged between these two methods. These interactions are believed to occur via the phosphotyrosine binding domain in the NH2-terminus, having conserved glutamic acid residues (9). As shown in Fig. 8, the HG or ANG II certainly accentuated the interactions between p-p66Shc and Pin1 in the cytosol while between p-p66Shc and Cyt.C in the mitochondrial compartment. These data indicated that HG and ANG II can heighten the interaction of p-p66Shc with Pin1 in cytoplasm, and p-p66Shc binding to Cyt.C in mitochondria via the PKC and Pin1 pathway.
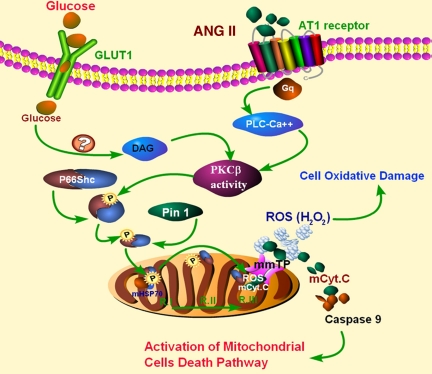
In conclusion, these findings highlight the activation of a novel PKC-β-p66Shc-Pin1-Cyt.C pathway (Fig. 9) by HG and ANG II treatment in proximal tubular epithelial cells, and it is anticipated that this information would yield impetus for future studies to study the biology of the tubular compartment in the pathogenesis of DN.
Fig. 9.
Schematic drawing depicting conceivable events as a consequence of HG and ANG II treatment with activation of PKC-β-p66Shc-Pin1-Cyt.C pathway and leading to oxidant stress and apoptosis of renal tubular epithelial cells. DAG, diacylglycerol.
GRANTS
This work was supported by grants from National Foundation Committee of Natural Science of China (C140405. 30971379), Furong Scholars Fund from Education Department of Hunan Province, Natural Science Foundation of Hunan Province (09JJ6031), and National Institute of Diabetes and Digestive and Kidney Diseases Grants DK28492 and DK60635, USA.
DISCLOSURES
No conflicts of interest, financial or otherwise, are declared by the author(s).
REFERENCES
- 1.Arany I, Faisal A, Clark JS, Vera T, Baliga R, Nagamine Y. p66Shc-mediated mitochondrial dysfunction in renal proximal tubular cells during oxidative injury. Am J Physiol Renal Physiol 298: F1214–F1221, 2010 [DOI] [PubMed] [Google Scholar]
- 2.Bonfini L, Migliaccio E, Pelicci G, Lanfrancone L, Pelicci PG. Not all Shc's roads lead to Ras. Trends Biochem Sci 21: 257–261, 1996 [PubMed] [Google Scholar]
- 3.Brezniceanu ML, Lau CJ, Godin N, Chenier I, Duclos A, Ethier J, Filep JG, Ingelfinger JR, Zhang SL, Chan JS. Reactive oxygen species promote caspase-12 expression and tubular apoptosis in diabetic nephropathy. J Am Soc Nephrol 21: 943–954, 2010 [DOI] [PMC free article] [PubMed] [Google Scholar]
- 4.Brownlee M. Biochemistry and molecular cell biology of diabetic complications. Nature 414: 813–820, 2001 [DOI] [PubMed] [Google Scholar]
- 5.Coughlan MT, Thorburn DR, Penfold SA, Laskowski A, Harcourt BE, Sourris KC, Tan AL, Fukami K, Thallas-Bonke V, Nawroth PP, Brownlee M, Bierhaus A, Cooper ME, Forbes JM. RAGE-induced cytosolic ROS promote mitochondrial superoxide generation in diabetes. J Am Soc Nephrol 20: 742–752, 2009 [DOI] [PMC free article] [PubMed] [Google Scholar]
- 6.Devarajan P. Update on mechanisms of ischemic acute kidney injury. J Am Soc Nephrol 17: 1503–1520, 2006 [DOI] [PubMed] [Google Scholar]
- 7.Di Mario U, Pugliese G. 15th Golgi lecture: from hyperglycaemia to the dysregulation of vascular remodelling in diabetes. Diabetologia 44: 674–692, 2001 [DOI] [PubMed] [Google Scholar]
- 8.Efrati S, Berman S, Tov YS, Averbukh Z, Weissgarten J. Hyperglycemia alters renal cell responsiveness to pressure in a model of malignant hypertension. J Hypertens 27: 365–375, 2009 [DOI] [PubMed] [Google Scholar]
- 9.Giorgio M, Migliaccio E, Orsini F, Paolucci D, Moroni M, Contursi C, Pelliccia G, Luzi L, Minucci S, Marcaccio M, Pinton P, Rizzuto R, Bernardi P, Paolucci F, Pelicci PG. Electron transfer between cytochrome c and p66Shc generates reactive oxygen species that trigger mitochondrial apoptosis. Cell 122: 221–233, 2005 [DOI] [PubMed] [Google Scholar]
- 10.Graiani G, Lagrasta C, Migliaccio E, Spillmann F, Meloni M, Madeddu P, Quaini F, Padura IM, Lanfrancone L, Pelicci P, Emanueli C. Genetic deletion of the p66Shc adaptor protein protects from angiotensin II-induced myocardial damage. Hypertension 46: 433–440, 2005. [DOI] [PubMed] [Google Scholar]
- 11.Ha H, Lee HB. Reactive oxygen species amplify glucose signalling in renal cells cultured under high glucose and in diabetic kidney. Nephrology (Carlton) 10, Suppl: S7–S10, 2005 [DOI] [PubMed] [Google Scholar]
- 12.Haga S, Terui K, Fukai M, Oikawa Y, Irani K, Furukawa H, Todo S, Ozaki M. Preventing hypoxia/reoxygenation damage to hepatocytes by p66(shc) ablation: up-regulation of anti-oxidant and anti-apoptotic proteins. J Hepatol 48: 422–432, 2008 [DOI] [PubMed] [Google Scholar]
- 13.Hall AM, Unwin RJ. The not so “mighty chondrion”: emergence of renal diseases due to mitochondrial dysfunction. Nephron Physiol 105: 1–10, 2007 [DOI] [PubMed] [Google Scholar]
- 14.Hsieh TJ, Zhang SL, Filep JG, Tang SS, Ingelfinger JR, Chan JS. High glucose stimulates angiotensinogen gene expression via reactive oxygen species generation in rat kidney proximal tubular cells. Endocrinology 143: 2975–2985, 2002 [DOI] [PubMed] [Google Scholar]
- 15.Husain M, Meggs LG, Vashistha H, Simoes S, Griffiths KO, Kumar D, Mikulak J, Mathieson PW, Saleem MA, Del Valle L, Pina-Oviedo S, Wang JY, Seshan SV, Malhotra A, Reiss K, Singhal PC. Inhibition of p66ShcA longevity gene rescues podocytes from HIV-1-induced oxidative stress and apoptosis. J Biol Chem 284: 16648–16658, 2009 [DOI] [PMC free article] [PubMed] [Google Scholar]
- 16.Jaimes EA, Hua P, Tian RX, Raij L. Human glomerular endothelium: interplay among glucose, free fatty acids, angiotensin II, and oxidative stress. Am J Physiol Renal Physiol 298: F125–F132, 2010 [DOI] [PMC free article] [PubMed] [Google Scholar]
- 17.Kakishita M, Nakamura K, Asanuma M, Morita H, Saito H, Kusano K, Nakamura Y, Emori T, Matsubara H, Sugaya T, Ogawa N, Ohe T. Direct evidence for increased hydroxyl radicals in angiotensin II-induced cardiac hypertrophy through angiotensin II type 1a receptor. J Cardiovasc Pharmacol 42, Suppl 1: S67–S70, 2003 [DOI] [PubMed] [Google Scholar]
- 18.Kanwar YS, Liu ZZ, Kumar A, Usman MI, Wada J, Wallner EI. d-Glucose-induced dysmorphogenesis of embryonic kidney. J Clin Invest 98: 2478–2488, 1996 [DOI] [PMC free article] [PubMed] [Google Scholar]
- 19.Kim CS, Jung SB, Naqvi A, Hoffman TA, DeRicco J, Yamamori T, Cole MP, Jeon BH, Irani K. p53 impairs endothelium-dependent vasomotor function through transcriptional upregulation of p66Shc. Circ Res 103: 1441–1450, 2008 [DOI] [PubMed] [Google Scholar]
- 20.Kouroedov A, Eto M, Joch H, Volpe M, Luscher TF, Cosentino F. Selective inhibition of protein kinase C beta 2 prevents acute effects of high glucose on vascular cell adhesion molecule-1 expression in human endothelial cells. Circulation 110: 91–96, 2004 [DOI] [PubMed] [Google Scholar]
- 21.Lebiedzinska M, Duszynski J, Rizzuto R, Pinton P, Wieckowski MR. Age-related changes in levels of p66Shc and serine 36-phosphorylated p66Shc in organs and mouse tissues. Arch Biochem Biophys 486: 73–80, 2009 [DOI] [PubMed] [Google Scholar]
- 22.Lee YH, Mungunsukh O, Tutino RL, Marquez AP, Day RM. Angiotensin-II-induced apoptosis requires regulation of nucleolin and Bcl-xL by SHP-2 in primary lung endothelial cells. J Cell Sci 123: 1634–1643, 2010 [DOI] [PMC free article] [PubMed] [Google Scholar]
- 23.Menini S, Amadio L, Oddi G, Ricci C, Pesce C, Pugliese F, Giorgio M, Migliaccio E, Pelicci P, Iacobini C, Pugliese G. Deletion of p66Shc longevity gene protects against experimental diabetic glomerulopathy by preventing diabetes-induced oxidative stress. Diabetes 55: 1642–1650, 2006 [DOI] [PubMed] [Google Scholar]
- 24.Migliaccio E, Giorgio M, Mele S, Pelicci G, Reboldi P, Pandolfi PP, Lanfrancone L, Pelicci PG. The p66Shc adaptor protein controls oxidative stress response and life span in mammals. Nature 402: 309–313, 1999 [DOI] [PubMed] [Google Scholar]
- 25.Mitsuishi M, Miyashita K, Muraki A, Itoh H. Angiotensin II reduces mitochondrial content in skeletal muscle and affects glycemic control. Diabetes 58: 710–717, 2009 [DOI] [PMC free article] [PubMed] [Google Scholar]
- 26.Nath KA. Tubulointerstitial changes as a major determinant in the progression of renal damage. Am J Kidney Dis 20: 1–17, 1992 [DOI] [PubMed] [Google Scholar]
- 27.Nath KA. Tubulointerstitium in progressive renal disease. Kidney Int 54: 992–994, 1998 [DOI] [PubMed] [Google Scholar]
- 28.Ogawa S, Mori T, Nako K, Kato T, Takeuchi K, Ito S. Angiotensin II type 1 receptor blockers reduce urinary oxidative stress markers in hypertensive diabetic nephropathy. Hypertension 47: 699–705, 2006 [DOI] [PubMed] [Google Scholar]
- 29.Pinton P, Rimessi A, Marchi S, Orsini F, Migliaccio E, Giorgio M, Contursi C, Minucci S, Mantovani F, Wieckowski MR, Del Sal G, Pelicci PG, Rizzuto R. Protein kinase C beta and prolyl isomerase 1 regulate mitochondrial effects of the life-span determinant p66Shc. Science 315: 659–663, 2007 [DOI] [PubMed] [Google Scholar]
- 30.Poovala VS, Kanji VK, Tachikawa H, Salahudeen AK. Role of oxidant stress and antioxidant protection in acephate-induced renal tubular cytotoxicity. Toxicol Sci 46: 403–409, 1998 [DOI] [PubMed] [Google Scholar]
- 31.Sun L, Shukair S, Naik TJ, Moazed F, Ardehali H. Glucose phosphorylation and mitochondrial binding are required for the protective effects of hexokinases I and II. Mol Cell Biol 28: 1007–1017, 2008 [DOI] [PMC free article] [PubMed] [Google Scholar]
- 32.Sun L, Xie P, Wada J, Kashihara N, Liu FY, Zhao Y, Kumar D, Chugh SS, Danesh FR, Kanwar YS. Rap1b GTPase ameliorates glucose-induced mitochondrial dysfunction. J Am Soc Nephrol 19: 2293–2301, 2008 [DOI] [PMC free article] [PubMed] [Google Scholar]
- 33.Susztak K, Raff AC, Schiffer M, Bottinger EP. Glucose-induced reactive oxygen species cause apoptosis of podocytes and podocyte depletion at the onset of diabetic nephropathy. Diabetes 55: 225–233, 2006 [PubMed] [Google Scholar]
- 34.Verzola D, Gandolfo MT, Ferrario F, Rastaldi MP, Villaggio B, Gianiorio F, Giannoni M, Rimoldi L, Lauria F, Miji M, Deferrari G, Garibotto G. Apoptosis in the kidneys of patients with type II diabetic nephropathy. Kidney Int 72: 1262–1272, 2007 [DOI] [PubMed] [Google Scholar]
- 35.Wang X. The expanding role of mitochondria in apoptosis. Genes Dev 15: 2922–2933, 2001 [PubMed] [Google Scholar]
- 36.Yin JX, Yang RF, Li S, Renshaw AO, Li YL, Schultz HD, Zimmerman MC. Mitochondria-produced superoxide mediates angiotensin II-induced inhibition of neuronal potassium current. Am J Physiol Cell Physiol 298: C857–C865, 2010 [DOI] [PMC free article] [PubMed] [Google Scholar]
- 37.Zafari AM, Ushio-Fukai M, Akers M, Yin Q, Shah A, Harrison DG, Taylor WR, Griendling KK. Role of NADH/NADPH oxidase-derived H2O2 in angiotensin II-induced vascular hypertrophy. Hypertension 32: 488–495, 1998 [DOI] [PubMed] [Google Scholar]
- 38.Ziyadeh FN, Sharma K. Overview: combating diabetic nephropathy. J Am Soc Nephrol 14: 1355–1357, 2003 [DOI] [PubMed] [Google Scholar]
- 39.Ziyadeh FN. Significance of tubulointerstitial changes in diabetic renal disease. Kidney Int 49, Suppl 54: S10–S13, 2009 [PubMed] [Google Scholar]


