Abstract
Purpose:In vivo range verification in proton therapy is highly desirable. A recent study suggested that it was feasible to use point dose measurement for in vivo beam range verification in proton therapy, provided that the spread-out Bragg peak dose distribution is delivered in a different and rather unconventional manner. In this work, the authors investigate the possibility of using a commercial implantable dosimeter with wireless reading for this particular application.
Methods: The traditional proton treatment technique delivers all the Bragg peaks required for a SOBP field in a single sequence, producing a constant dose plateau across the target volume. As a result, a point dose measurement anywhere in the target volume will produce the same value, thus providing no information regarding the water equivalent path length to the point of measurement. However, the same constant dose distribution can be achieved by splitting the field into a complementary pair of subfields, producing two oppositely “sloped” depth-dose distributions, respectively. The ratio between the two distributions can be a sensitive function of depth and measuring this ratio at a point inside the target volume can provide the water equivalent path length to the dosimeter location. Two types of field splits were used in the experiment, one achieved by the technique of beam current modulation and the other by manipulating the location and width of the beam pulse relative to the range modulator track. Eight MOSFET-based implantable dosimeters at four different depths in a water tank were used to measure the dose ratios for these field pairs. A method was developed to correct the effect of the well-known LET dependence of the MOSFET detectors on the depth-dose distributions using the columnar recombination model. The LET-corrected dose ratios were used to derive the water equivalent path lengths to the dosimeter locations to be compared to physical measurements.
Results: The implantable dosimeters measured the dose ratios with a reasonable relative uncertainty of 1%–3% at all depths, except when the ratio itself becomes very small. In total, 55% of the individual measurements reproduced the water equivalent path lengths to the dosimeters within 1 mm. For three dosimeters, the difference was consistently less than 1 mm. Half of the standard deviations over the repeated measurements were equal or less than 1 mm.
Conclusions: With a single fitting parameter, the LET-correction method worked remarkably well for the MOSFET detectors. The overall results were very encouraging for a potential method of in vivo beam range verification with millimeter accuracy. This is sufficient accuracy to expand range of clinical applications in which the authors could use the distal fall off of the proton depth dose for tight margins.
Keywords: particle therapy, in vivo dosimetry, range uncertainty, MOSFET, LET dependence
INTRODUCTION
Range uncertainty in proton therapy is a recognized concern for many treatment sites.1, 2, 3, 4, 5, 6 As a result, the superb sharp distal penumbra in the depth dose of the proton beam cannot be safely used for organ sparing with tight margins, thus seriously compromising the potential benefit of proton therapy. For example, anterior fields are not used in prostate treatment, despite the fact that such fields can, in principle, utilize the sharp distal penumbra (∼4 mm at 50%–95%) to separate the prostate and the rectum behind.7 Instead, only lateral fields (angled slightly at some institutions) are used, relying solely on the much broader lateral beam penumbra at the treatment depths (∼10 mm at 50%–95%) to spare the rectum. Sources of range uncertainty include inaccuracies in acquiring the CT data and the conversion from Hounsfield unit to stopping power.2 In the case of prostate treatment, interfractional changes in patient’s anatomical configuration may also substantially affect the water equivalent path length (WEPL) and thus the beam range in patient. It would be very desirable that we could provide in vivo verification of the beam range in patient for each fraction of the treatment with an accuracy of 1–2 mm.
In vivo dose verification has been widely used in routine clinical practices for treatments using photon and electron beams with many techniques and equipment available.8 The most common applications use point dosimeters, e.g., diodes or TLDs, to measure doses at points on patient skin surface or intracavity to verify the most concerning aspects of the treatment. Recently, an implantable dosimeter with immediate wireless reading became available [Dosimetry Verification System (DVS) Sicel Technologies Inc., Morrisville, NC] and has been studied for treatment verification for prostate and other treatments by photon fields.9, 10, 11 In general, point dose measurements are not sufficient to verify a proton treatment because the main concern here is the beam range in patient, rather than the absolute dose. It was shown recently, however, that point dose measurements can be used to verify the water equivalent path length at the detector position, and thus the effect of the beam range, provided that we deliver the proton dose in a different and rather unconventional manner.6 In the present study, we explore the feasibility of using the DVS dosimeters for this particular application.
The DVS dosimeters are metal oxide semiconductor field-effect transistor (MOSFET) based radiation detectors and these detectors are known to have a dependence on linear energy transfer (LET).12 In a recent study of a MOSFET dosimeter for proton therapy, the dosimeter was found to undervalue the dose substantially around the Bragg peak where LET increases dramatically.13 As will be shown, although the method for range verification under study here uses only the dose ratio rather than the dose itself, the LET effect will not cancel out. A correction method had to be developed for accurately calculating the response of MOSFET detectors to proton beams.
MATERIALS AND METHODS
The dose ratio method for range verification
The method for using in vivo point dose measurement for beam range verification had been presented previously.6 We will only describe the basic strategy here.
A proton treatment field is a superposition of Bragg peaks, produced either by range modulation with passive scattering or by layer stacking with pencil beam scanning. In the simplest form, the dose distribution in depth can be expressed as
| (1) |
where P0(x+δi) denotes the Bragg peak with the peak position shifted byδi. The weights {wi} are optimized to produce a constant dose plateau in depth in order to provide homogeneous dose coverage of the target volume. Traditionally, a proton treatment field is delivered by giving all the Bragg peaks in a single sequence (usually from deep to shallow) with their full weights{wi}. As a result, the entire target volume receives the same dose and measuring the dose at any point in the target volume would provide no information regarding the water equivalent path length to the point of measurement.
The dose distribution given by Eq. 1 can also be achieved by splitting the single sequence to two subsequences (or subfields). This can be done as an independent step subsequent to the normal treatment planning process. That is, we can split the dose distribution in Eq. 1 by
where
and
| (2b) |
Both Da(x) and Db(x) are essentially the distribution D(x) but with the weights modified by the parameters{νi}. Note that the two subfields a and b form a complementary pair in the sense that regardless of the choices of {νi}(0≤νi≤1), their summation always equals to the original dose distribution D(x) with a uniform dose over the target volume.
A particular way of selecting the values of {νi} is such that Da(x) and Db(x) give “sloped” depth doses over the target volume. Naturally, the slopes for the two are opposite to each other so that the total dose distribution retains the original dose plateau. The difference is that the slope now creates a unique correspondence between the dose and the WEPL. Moreover, the ratio of the two opposite slopes can be a very sensitive function of WEPL. If we deliver the two oppositely sloped subfields one at a time and measure the dose at the same point in the target volume, respectively, we will obtain the dose ratio from which we can determine the WEPL to the location of the dosimeter and thus the residual beam range at this point.
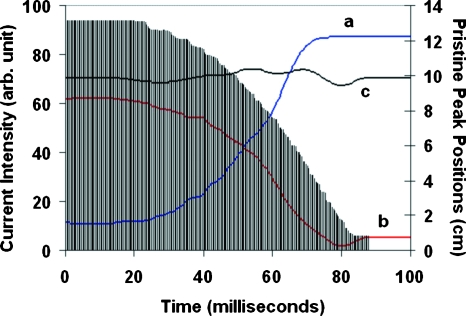
It was demonstrated previously that such sloped depth-dose distributions can be easily produced by a passive scattering system with the capability of beam current modulation (BCM) (Ion Beam Applications Inc., Belgium).14, 15 The BCM technique varies the beam current intensity in synchronization with the rotation of the modulator wheel so that the beam current passing through each individual step of the wheel, and thus the weight for each individual Bragg peak, can be controlled nearly arbitrarily. The dose distributions Da(x) and Db(x) were generated in such a way that the ratio function R(x)=Da(x)∕Db(x) is nearly perfectly linear throughout the target volume. A test using this ratio function based on ion-chamber measurement in a water tank demonstrated the range verification method with millimeter accuracy.6 Figure 1 shows the modulated beam current distributions for a complementary pair of SOBP fields used in the present study, where (a) and (b) are for decreasing and increasing dose distributions, respectively, while (c) is for a constant dose plateau in depth. Also shown in histogram are the peak positions of the depth-dose distributions for the corresponding rotational position of the modulator wheel.
Figure 1.
Beam current modulation patterns required to generate a type I field pair, (a) for a depth-dose distribution sloping down distally, (b) for sloping up, and (c) for a typical SOBP field with a constant dose plateau. The histogram shows the peak position of the depth-dose distribution corresponding to each rotational position of the modulator wheel over the full period of rotation (100 ms).
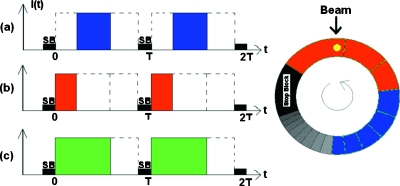
In passive scattering systems without beam current modulation, the weight for the individual Bragg peak is solely determined by the physical construct of the range modulator wheel and thus cannot be changed without new hardware fabrication.16 For such systems, the dose splitting as symbolized by Eq. 1 may be achieved by dividing the required Bragg peaks into two groups and delivering them separately. This can be accomplished by manipulating the beam pulse width and timing relative to the range modulator wheel, as illustrated in Fig. 2. Instead of using the full pulse width covering all the required steps of the modulator wheel as in a conventional delivery (c), one splits the pulse to two, with one covering only the first number of steps (b) and the other covering the remaining steps (a). For Eq. 2, this means having νi=0 for i<j and νi=1 fori≥j, with j corresponding to the first step in the second group. As will be shown in the next sections, the ratio function R(x) produced in this manner is no longer a straight line. The correspondence between the dose and WEPL is, however, still unique. For convenience of discussion, we denote these kinds of sequence pairs as type II, while those with a linear ratio function achieved by beam current modulation discussed earlier as type I.
Figure 2.
A schematic illustration of the method for generating a type II field pair. The three beam pulse patterns differ in location and width, (a) covering only the lower right section of the modulator track, (b) the upper section, and (c) the sum of (a) and (b), covering both as in a conventional dose delivery. T is the rotational period of the modulator track and SB marks the position of the stop block.
Measurement of depth doses and dose ratios
In our experiment, we used a horizontal beam with a typical beam range of 13.3 cm and a modulation width of 8.5 cm (90%–90%). Both type I and type II pairs are created for the beam. A water phantom with one-dimensional horizontal scanning system (Computerized Radiation Scanning Inc., Vero Beach, FL) and a Markus chamber were used to measure, with 0.25 mm step size, the depth-dose distributions, i.e., DaI(x), DbI(x), DaII(x), DbII(x), with the ratio functions RI(x)=DaI(x)∕DbI(x) and RII(x)=DaII(x)∕DbII(x) subsequently calculated, respectively. At each depth, the time-resolved dose rate function was also recorded to be used for correcting the LET dependence, as will be described in Sec. 2C.14
For point dose measurement, the Markus chamber was first used to measure the doses in the water tank at four different depths within the plateau of the SOBP, using a Keithley electrometer. Each of the four subfields was used to delivery 50 cGy with the output calibrated at 10 cm depth. The 10 cm depth for the output calibration was chosen solely on the basis of convenience for this initial feasibility study. In the future, we expect to calibrate the output close to the entrance, where the depth curve is less steep and deliver each subfield according to the ratio that produces a flat SOBP when summed. Ratios of the measured doses were then calculated between the corresponding subfields in the pairs. The obtained values were then compared to the ratio functions RI(x) and RII(x) calculated above.
Next, eight DVS dosimeters were placed in pairs at four different depths in the water tank and were irradiated in the same manner as in the ion-chamber measurement mentioned above, i.e., with 50 cGy delivered to 10 cm depth. For each type of field pairs, the dosimeters received two irradiations from the two subfields a andb. The change in threshold voltage (Vth) of each dosimeter was measured via the wireless reader and the ratio of changes, i.e., Rth=ΔVth,a∕ΔVth,b, was calculated. For efficiency, the wireless reader was programed to be operated remotely outside the treatment room, as opposed to only manual operation with a hand scanner in the original design. A preliminary set of data was first taken with a type I field pair to determine the value of a fitting parameter for the LET-correction model to be discussed below. For the main data acquisition, the ratio values for both type I and type II field pairs were measured four times in two sessions on two separate days.
LET dependence
MOSFET-based radiation detectors are known to have LET dependence.12 It was demonstrated in a recent study that a MOSFET detector produced increasingly lower reading than an ion chamber toward the distal aspect of the Bragg peak depth-dose distribution.13 It is necessary to model the effect of this LET dependence on the dose ratios to avoid having to measure the ratios at multiple depths for every possible SOBP and every individual choice of how to split those SOBPs into complimentary field pairs.
The observed LET dependence may be attributed to electron-hole recombination among the charge pairs created by the particle beam. The principle of MOSFET dosimeter is based on the electron-hole pairs created by ionizing radiation in the oxide layers of the device. When these charges get trapped permanently, the threshold voltage of the MOSFET is reduced and the amount of reduction reflects the dose received by the detector. If, however, a charge pair recombines, it would not contribute to the reduction of the threshold voltage and the amount of energy released by the particle for creating this pair of charges would go uncounted. If the rate of charge recombination depends on the LET, the measured dose would become LET dependent.
The problem of charge recombination has been studied extensively in the past for various purposes and the effect along the tracks of protons in SiO2 films has been investigated.17 A columnar model for the recombination process has been proposed and was used in a recent study to explain the dependence of the measured dose on the orientation of the applied electric field relative to the incident proton beam.18 The model states that a heavy charged particle through a medium will create a dense ionization region of electron-hole pairs in the form of a cylindrical volume around the particle track. Under normal conditions, a large percentage of the electrons and holes recombine through diffusion. If an electric field is introduced across the medium, the process is altered and the fraction of charge pairs escaping recombination can be described by
| (3) |
where N0 is the total number of charge pairs created by the incident proton per unit length along the track. The parameter η is inversely proportional to the component of the applied electric field perpendicular to the particle track, i.e., η∼1∕E sin(θ), with θ being the angle between the electric field and the particle track. Basically, the smaller this angle is, the longer time the charges will spend in the “column” of generated charges along the track and are thus more likely to get recombined. For a larger angleθ, on the other hand, the electric field is more perpendicular to the track and therefore pushes the charges out of the column, escaping recombination.
Equation 3 can provide a qualitative explanation to the observed LET dependence in MOSFET detectors in measuring the dose of a Bragg peak.13 It shows that for a given electric field with a fixed magnitude and orientation, i.e., a fixed value for the parametersη, the fraction of charge pairs escaping recombination would decrease as the number of charge pairs created by the particle N0 increases. At any point along the particle track, N0should be proportional to the LET at the point. Since the LET increases substantially as it approaches the end of the particle track, the charge pairs created per unit length (N0) will also increase in equal proportion to the increase in the absorbed dose. Consequently, the net number of charge pairs detected by the device per unit dose actually decreases, resulting in the underdetection of the dose near the Bragg peak as reported.13
The measurement reported in Ref. 13 was conducted with an external bias voltage over the MOSFET dosimeter during the irradiation, as was the practice for most of the applications of such dosimeters. The DVS dosimeters, on the other hand, have no bias available, being implanted in the patient. However, given the semiconductor nature of the device and the presence of trapped charges, it is reasonable to assume that there is an intrinsic electric field present such that the columnar recombination model still applies. That is, the fractional charge pairs escaping recombination can still be described by Eq. 3, although the parameter η would be substantially larger due to the weaker intrinsic electric field.
For a SOBP field, the detector placed at a point in depth will not see protons with a single LET value, but protons with a broad spectrum of LET values resulting from the variety of energies corresponding to the different constituting Bragg peaks. As a result, the recombination effect described by Eq. 3 will be compounded according to the weights of the Bragg peaks. This means that even though we are not concerned with the absolute dose in the present investigation but only the ratio of doses, the LET effect will not cancel out. Because the two subfields in a field pair must have very different weights for the constituting Bragg peaks in order to achieve the nearly reversed depth-dose dependences, the energy spectra of the protons passing through the same location in depth will be different, giving different spectra of LET and thus different overall recombination effects. If we were to use the ratios measured by the MOSFET detectors to determine the WEPL, we must not compare them to the ratios of absorbed dose, but to a ratio function that takes the LET dependence into account quantitatively based on Eq. 3.
LET correction
In an earlier effort to derive an analytical expression for the Bragg curve, the absorbed dose for a monoenergetic proton beam was given as
where ρ is the mass density of the medium and γ is a constant.19 Φ(x) is the particle fluence at depthx, E(x) is the energy of the particle, and S(x) denotes the linear stopping power, that is, S(x)=−dE(x)∕dx. The functionsΦ(x), E(x), and S(x) can all be expressed analytically in terms of the range of the protons (r) at the energy under consideration. That is,
| (4b) |
| (4c) |
and
| (4d) |
wherex<r. The parametersα, β, and p all have fixed values as given in Ref. 19 and are not to be repeated here.
The expression in Eq. 4 is valid only for monoenergetic protons. In reality, the incident protons have a nonzero energy spread and the spread continues to increase as the beam passes through the medium (range straggling). It was shown, however, that both of these effects for a Bragg peak distribution can be taken into account by assuming a Gaussian distribution in the range of the protons.19 That is, the depth-dose distribution for a realistic Bragg peak can be obtained by the integral
| (5) |
Here ra is the average range of the protons and σ the standard deviation.
The first term in Eq. 4a represents the energy released to the medium through ionization. The second term describes the energy deposited to the medium due to nonelastic nuclear interactions that causes the reduction of particle fluence.19 The parameter γ was given the value of 0.6 for a reasonable estimate of energy deposited locally by these interactions. This term contributes only marginally to the absorbed dose and nearly vanishes in the vicinity of the Bragg peak. In the present case, we will thus ignore its effect on MOSFET detectors. For one, it is not clear what value of γ is appropriate for protons passing through a semiconductor medium rather than water or tissue equivalent materials. Second, this term is much smaller than the first in any case and its effect on the ratios should likely be negligible.
As pointed out above, the number of charge pairs created per unit length along the particle track (N0) should be proportional to the LET of the particle. For protons, the LET is equal to the linear stopping power and therefore N0 must be proportional to S(x) in Eq. 4. Since for each proton, the MOSFET detects only the fraction of the charge pairs escaping recombination, it follows from Eqs. 3, 4 that the response, or the “dose,” measured by the MOSFET for a monoenergetic proton beam can be expressed as
| (6) |
where the parameter λ describes the effect of the electric field, like η in Eq. 3, and C is a constant conversion factor from stopping power to MOSFET response. For a realistic Bragg peak, the MOSFET response DM(x) should be calculated by substituting in the place of in Eq. 5.
Equations 4, 5, 6 show that the MOSFET response function for a Bragg peak can be calculated, given the Gaussian distribution of the particle range, i.e., the values of ra andσ, and also the particle fluence at the surface of the mediumΦ0. Obviously, for a range modulated beam with a SOBP dose distribution as in our case, we will need these values for each constituting Bragg peak.
For a passively scattered beam modulated by a range modulator wheel, the total SOBP depth-dose distribution is a summation of distributions produced at each rotational position of the wheel. It was shown recently that these “sub” distributions can be obtained by measuring the time dependence of the dose rate function in depth and performing a simple deconvolution of the data.14 As mentioned earlier, such measurements were performed for the sloped SOBP fields used in the present study and for each field a total of 184 equally weighted distributions were extracted for the given modulation width. Each of these “Bragg peaks” was then fitted to Eq. 5 to determine the values of the three parametersra, σ, andΦ0. These parameters, together with Eqs. 4, 5, provide an analytical model for the depth-dose distribution of the SOBP field.
With the obtained parameter values, we then calculated the response of MOSFET given by Eq. 5 but with replaced by for each Bragg peak. The MOSFET response functions for the total SOBP fields were then calculated by simple summations of these MOSFET Bragg peaks and the ratios between the corresponding field pairs were subsequently calculated. The constant C in Eq. 6 actually cancelled out in the process. The parameter λ was varied to produce the best fit of the ratios between the calculated and the measured values for the data taken during the preliminary run with a type I field pair as mentioned earlier.
RESULTS
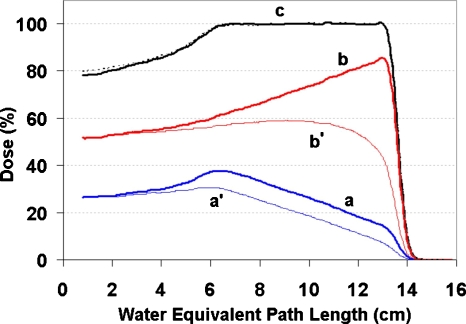
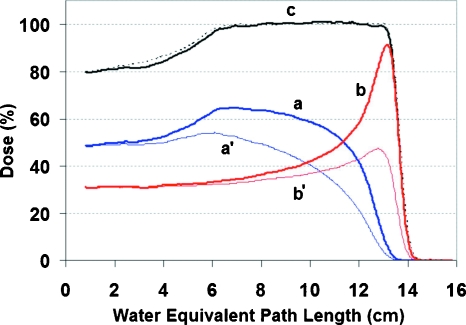
Figures 34 show the depth-dose distributions for the type I and type II field pairs used in the experiment. In both figures, aand b are the distributions measured with the Markus chamber for the sloped fields. The distributions are shown with the proper scale factors so that their summation c shows the familiar constant dose plateau.
Figure 3.
Depth doses for the type I field pair used in the experiment. The distributions (a) and (b) correspond to the beam current modulation patterns (a) and (b) in Fig. 1 and were measured with a Markus chamber. They were scaled in the figure such that their sum has a constant dose plateau (c) as by a conventional dose delivery. The distributions (a′) and (b′) were computed with the LET correction based on the time-resolved data obtained in measuring (a) and (b). The depth-dose measured without splitting the field delivery is shown in the dotted line.
Figure 4.
Depth doses for the type II field pair used in the experiment. The distributions (a) and (b) correspond to beam pulse patterns (a) and (b) in Fig. 2 and were measured with a Markus chamber. They were scaled in the figure such that their sum has a (c) constant dose plateau, as by a conventional dose delivery. The distributions (a′) and (b′) were computed with the LET correction based on the time-resolved data obtained in measuring (a) and (b). The depth-dose measured without splitting the field delivery is shown in the dotted line.
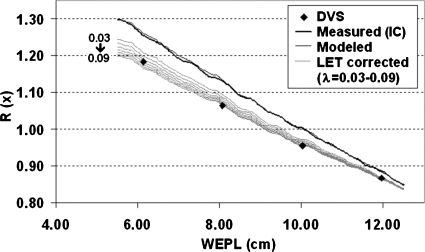
Figure 5 shows the calculated ratio functions, together with the ratios measured by the DVS dosimeters (diamonds) during the preliminary measurement. Note that each DVS dosimeter actually has two MOSFET detectors packed at opposite side. The ratio between the average shifts in Vth was used in the figure. Computing the ratio first for each individual detector and then taking the average made negligible difference. The thicker dark line is the ratio functionR(x)[=Da(x)∕Db(x)]computed directly from the IC-measured depth-dose distributions, while the thinner dark line is obtained from the analytical model based on the numerical fitting of extracted Bragg peaks, as discussed earlier. The gray lines show the ratio functions also computed from the analytical model but with LET corrections for a range of λ values. Note that because both subfields a and b were calibrated to delivery 50 cGy at 10 cm depth during the ratio measurement, by definition the IC-measured ratio function should be scaled to unity at this depth. The same scale factor was applied to the other ratio functions, since they were all derived from the same original depth-dose distributions.
Figure 5.
Average ratios measured by DVS dosimeters in comparison with the ratio functions computed from the data obtained in the preliminary measurement for determining the value of parameterλ. The thicker dark line is calculated directly from the IC-measured depth doses and the thinner dark line is computed from the model fit of the measured data. The gray lines are also computed from the model fit but with the MOSFET LET correction for a range of values ofλ.
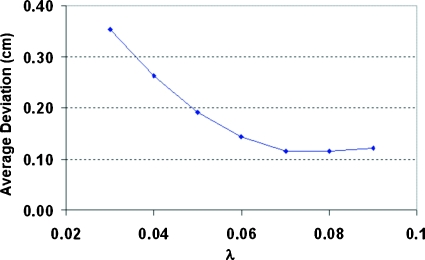
In order to determine the best value for the parameterλ, we calculated the WEPL values corresponding to the measured DVS ratios, according to a ratio function in Fig. 5. We then compared them to the known positions of the dosimeters in the water tank and calculated the average deviation over the eight dosimeters for each of the LET-corrected ratio functions. The result is plotted as a function of the parameter λ in Fig. 6. It shows that the LET-correction model was fairly sensitive when λ is less than 0.06 but becomes stabilized around 0.07–0.09. We chose 0.08 in the following calculations. This choice of λ gives us an average residual error of∼0.12 cm, which is sufficiently accurate for our application. Note that this is the total residual error and includes any error resulting from factors other than the LET dependence of the MOSFET detectors (see discussion of IC measurements below).
Figure 6.
The average deviation between actual positions of the DVS dosimeter and those derived from the LET-correction model as a function of the parameterλ.
We then calculated the LET-corrected dose distributions for both type I and type II field pairs and plotted them as a′ and b′ in Figs. 34, corresponding to the ion-chamber measured distributions a andb. These are dose distributions that would be measured by MOSFET detectors. For convenience of comparison, they are scaled to match with their ion-chamber counterparts at the shallow end of the distributions, respectively.
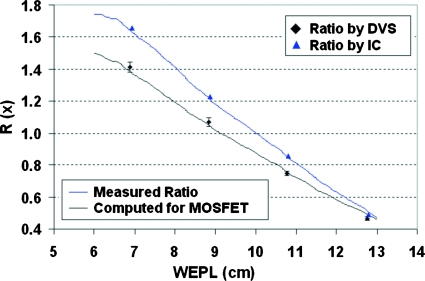
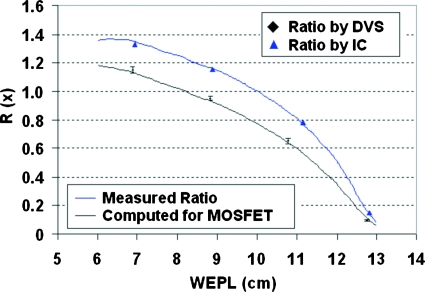
From these MOSFET dose distributions, we calculated the ratio functions and plotted them together with the ratios measured by the DVS dosimeters in Fig. 7 for type I field pair and Fig. 8 for type II field pair. The ratios shown for the DVS dosimeters were averaged over the four measurements for each dosimeter and also over the two dosimeters at the same position in depth. The error bar showed the standard deviation. Also plotted were the ratio functions computed directly from measured depth-dose distributions in comparison with the ratios measured separately by ion chambers at four different depths. The standard deviations for the ion-chamber ratio measurement were under 0.3%, too small to be shown in the figure.
Figure 7.
Average ratios measured by DVS dosimeters (diamonds) and the Markus chamber (triangles) at discrete depths for type I field pair in comparison with the ratio functions calculated directly from the measured depth doses (upper) and with LET corrections (lower). The error bars show the standard deviations in DVS measured ratios.
Figure 8.
Average ratios measured by DVS dosimeters (diamonds) and the Markus chamber (triangles) at discrete depths for type II field pair, in comparison with the ratio functions calculated directly from the measured depth doses (upper) and with LET corrections (lower). The error bars show the standard deviations in DVS measured ratios.
From the LET-corrected ratio functions, we can obtain corresponding values of WEPL for the measured DVS ratios and compared them to the known locations of the dosimeters in the water tank. Table 1 shows the difference for every measured ratio by every dosimeter for both type I and type II field pairs. The water equivalent position (x) measures from the front surface of the water tank to the center of the cylindrical capsule of the dosimeter. Overall, 55% of the individual measurements reproduced the positions of the dosimeters within a millimeter (in boldface). 80% of them reproduced position errors less than 3 mm. Type II field pair had 59% measurements with position errors ≤1 mm versus 44% for type I. For three dosimeters, R3 for type I and L4 and R4 for type II, the position error was consistently less than 1 mm. Half of the standard deviations over the repeated measurements were equal to or less than 1 mm. The average of the measured DVS ratios for each dosimeter (⟨R⟩) is also shown in Table 1, together with the standard deviation of the measured ratios relative to the average, i.e., σR∕⟨R⟩.
Table 1.
The difference (Δ) between the actual water equivalent depth of the DVS dosimeter and that derived from the measured ratio, with the average (⟨Δ⟩) and the standard deviation (σΔ) over the four measurements for each of eight dosimeters. The cells with boldface have values equal or less than 1 mm. The averages of the ratios measured by the dosimeters (⟨R⟩) and the standard deviation of those ratios (σR) are also shown. The standard deviations are given as percentages of the average values to indicate the relative uncertainty.
| Field pairs | DVS | x (cm) | Δ1 (cm) | Δ2 (cm) | Δ3 (cm) | Δ4 (cm) | ⟨Δ⟩ (cm) | σΔ (%) | ⟨R⟩ | σR∕⟨R⟩ (%) |
|---|---|---|---|---|---|---|---|---|---|---|
| Type I | L1 | 6.88 | −0.10 | −0.38 | 0.01 | 0.10 | −0.09 | 0.21 | 1.400 | 2.5 |
| L2 | 8.82 | −0.03 | −0.27 | −0.35 | 0.09 | −0.14 | 0.21 | 1.074 | 3.0 | |
| L3 | 10.78 | 0.01 | 0.11 | −0.02 | 0.17 | 0.07 | 0.09 | 0.743 | 1.9 | |
| L4 | 12.75 | 0.15 | 0.08 | 0.30 | 0.20 | 0.18 | 0.09 | 0.469 | 2.5 | |
| R1 | 6.88 | −0.20 | −0.38 | −0.16 | −0.13 | −0.22 | 0.11 | 1.424 | 1.2 | |
| R2 | 8.85 | −0.10 | −0.34 | 0.03 | −0.01 | −0.11 | 0.17 | 1.064 | 2.4 | |
| R3 | 10.78 | −0.04 | 0.06 | −0.09 | 0.09 | 0.01 | 0.08 | 0.754 | 2.0 | |
| R4 | 12.76 | 0.27 | 0.18 | 0.40 | 0.13 | 0.24 | 0.12 | 0.461 | 3.0 | |
| Type II | L1 | 6.88 | −0.79 | −0.04 | −0.21 | 0.04 | −0.25 | 0.38 | 1.147 | 2.1 |
| L2 | 8.82 | −0.43 | −0.03 | −0.19 | 0.05 | −0.15 | 0.21 | 0.947 | 2.3 | |
| L3 | 10.78 | −0.19 | −0.08 | −0.20 | 0.02 | −0.11 | 0.10 | 0.660 | 2.8 | |
| L4 | 12.75 | 0.06 | 0.05 | 0.03 | 0.08 | 0.06 | 0.02 | 0.098 | 4.5 | |
| R1 | 6.88 | −0.01 | −0.01 | −0.83 | −0.54 | −0.35 | 0.41 | 1.153 | 2.2 | |
| R2 | 8.85 | −0.31 | −0.31 | −0.16 | −0.38 | −0.29 | 0.09 | 0.959 | 1.0 | |
| R3 | 10.78 | −0.19 | 0.03 | 0.02 | 0.01 | −0.03 | 0.10 | 0.645 | 3.0 | |
| R4 | 12.76 | 0.07 | 0.09 | 0.05 | 0.05 | 0.06 | 0.02 | 0.094 | 3.9 |
In the same manner, the IC-measured ratios were used to obtain the corresponding WEPL based on the dose ratio functions. For type I, the difference between the obtained values and the actual positions of the chamber were 1.1, 0.8, 0.4, and 1.0 mm for the measurements from shallow to deeper, respectively. For type II, they were 2.0, 0.6, 0.4, and 0.1 mm, respectively. The position of the ion chamber was driven by the step motor of the scanning system with the step size of 0.25 mm. The residual error in the WEPL, coupled with the very small spread in the repeated measurements, is an indication that there is some intrinsic error in the method. In the shallowest depth, where the slope of the field pairs is small, this is understandable. It is interesting to note that only the type I field pairs show errors on the order of 1 mm in any but the shallowest measurement. This may be a measure of the limit of accuracy of the beam current modulation system used to produce the sloped SOBPs, and thus point to the superiority of the type II method for splitting the SOBPs.
DISCUSSIONS
Beam range uncertainty in patient has been one of the primary challenges in proton therapy.1 The widely adopted practice is to increase the beam range universally by 3.5% to “head off” the potential undershooting and to use the lateral rather than the sharper distal penumbra for tight margins to avoid the risk of potential overshooting. The dose ratio method proposed recently and further explored in this work is intended to provide a limited but practical approach to range verification. It requires essentially no additional time for patient and gives the same dose distribution to patient as planned, only in a different method of delivery.
The main limitation of the method results from the fact that because only a small number of dosimeters can be implanted in a target volume, the verification is therefore at best only along those discrete lines, rather than over the entire beam cross section. In certain treatments, however, tissue heterogeneities vary only slowly over the beam cross section. With the proper positioning of the dosimeters, the method could verify the most concerning aspects of the treatment. An example is treating prostate by an anterior field where the pubic bone in the beam path produces only limited range shifts. The verification of the beam range at a few points along the rectum where the prostate target volume is closest to the anterior rectal wall would be highly appreciated. Another limitation of the method is the fact that the dosimeters must be planted inside the target volume and therefore they verify only the beam path from the body surface to the locations of the dosimeter, rather than to the distal surface of the target volume the coverage of which is the actual concern in the first place. Nevertheless, the remaining part of beam path is much shorter and its uncertainty should thus be much smaller, particularly for soft tissue target volume.
The primary challenge in this work was the LET dependence of the MOSFETs used in the DVS dosimeters. It was hoped initially that since the range verification method does not require the absolute dose measurement but only a ratio, the LET effect may be negligible to an acceptable degree. The data clearly proved the contrary.
The method developed for LET correction based on the columnar recombination model worked reasonably well, given that it required only a single parameter λ and was able to provide reasonable fits to all the data taken by the dosimeters. We must, however, note a word of caution, given the following considerations. Our application of the columnar recombination model was based on the assumption that there is an intrinsic electric field due to trapped charges, even in the absence of an external bias voltage. MOSFET dosimeters are accumulative. That is, the number of trapped charges will increase as the device receives more radiation and so should the strength of this intrinsic electric field. As a result, the value of the parameter λ will decrease, being inversely proportional to the electric field. Although DVS dosimeters at different depths receive the same radiation dose in the actual application of this particular range verification technique with either type of field pairs, the increase in the amount of trapped charges will differ due to the LET dependence. As a result, each dosimeter may need a different value of λ for the LET correction as its dose accumulates. The DVS dosimeters used in our measurement did receive different amount of LET-corrected dose since we never switched their positions. The differences are still relatively small given the relatively low amount of irradiation they received. How much would the value of λ change during a full course of therapy treatment for an actual application and how the measured ratios would change correspondingly would have to be further investigated.
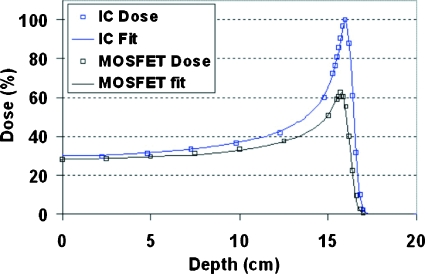
As an exercise, we applied the LET-correction model to the data reported in Ref. 13 where a Bragg peak was measured using both an ion chamber and a MOSFET detector but no modeling was attempted. Figure 9 shows the data (squares) that we digitized off Fig. 6 in Ref. 13, together with the fits (lines). The LET-corrected distribution matched the measured MOSFET data very closely. The value of λ was found to be 0.024 for the best fit, much smaller than the value of 0.08 for interpreting our data. This is consistent with the fact that their experiment used an external bias voltage that would produce a stronger electric field and thus a smaller value ofλ, following the discussions above.
Figure 9.
A test of the LET-correction model based on the data obtained in Ref. 13 from measuring a Bragg peak distribution by an ion chamber (upper) and a MOSFET dosimeter (lower).
The DVS dosimeters measured the dose ratio with a reasonably consistent relative uncertainty of 1%–3% at all depths, except when the ratio itself becomes very small, as for dosimeters L4 and R4 for the type II field pair. The same relative uncertainty in the measured ratio does not, however, necessarily translate into the same uncertainty in the derived dosimeter positions. It also depends on the absolute value of the ratio and the slope of the ratio functions at the point of measurement. The steeper the slope is, the smaller the uncertainty in the derived position. For type I, this slope varied little over the depth (Fig. 7) and so did the uncertainties in the position, as shown in Table 1. For type II, on the other hand, the slope started less than type I at the shallow part, but became more than type I at the deeper end (Fig. 8). At the same time, the uncertainty in position decreased dramatically from 0.41 to 0.02 from shallow to deep. This also explains the large increase of position error from deep to shallow seen in the type II field pair data measured with the ion chamber as shown above.
Clearly, a steep ratio function at the location of the dosimeter is the key to better accuracy. The nearly constant slope produced by the type I field pair is convenient in that it can maintain the same level of accuracy regardless of the location of the dosimeters. However, the linearity requirement also places a limit to the steepness that it can provide, particularly for target volumes with a large span in depth. The steep segment in the deeper part of the ratio function produced by the type II field pair is obviously ideal for accuracy, but it also covers only a small range in depth. Fortunately, the location of the steep segment is determined by the point of splitting the beam pulse (Fig. 2). By selecting the appropriate point of split, the segment can be moved to match the locations of the implanted dosimeters for the desired accuracy. However, this may not be possible if multiple dosimeters at very different depths need to be used simultaneously.
It should be noted that the original intention of splitting the SOBP field into pairs was to create depth-dependent dose distributions absent in the constant dose plateau produced by the conventional dose delivery method. However, due to the LET dependence, a MOSFET detector would never measure a constant plateau even with the conventional delivery. In fact, such a measurement had been reported in Ref. 13 and the measured depth distribution showed a clear downward slope toward the distal end of the SOBP (Fig. 7 in Ref. 13). The slope provides a one-to-one correspondence between the measured dose and the water equivalent path length to the location of the dosimeter and therefore can, in principle, be used for range verification without the trouble of splitting fields. It does require, however, an absolute calibration of the MOSFET detectors, which may be achieved based on the LET-correction model developed here. The main drawback of the approach is the fact that the slope becomes steep only near the distal end of the SOBP, requiring precise positioning of the dosimeters, which may not always be practical.
We used passive scattering to generate the two types of field pairs for the measurement. Naturally, these can be produced by the pencil beam scanning technique as well. In fact, the ratios between the individual pencil beam layers can also be utilized in a similar manner with even more flexibility.20 Measurements with such types of field pairs (type III) are currently in preparation at our institution.
CONCLUSION
We conducted a preliminary investigation on the feasibility of using the implantable DVS dosimeters for in vivo beam range verification using the dose ratio approach suggested recently. A method has been developed based on the columnar recombination model to correct the well-known LET dependence of the MOSFET detectors used in DVS. Results from water phantom tests showed that with the LET correction and a proper selection of the dose delivery strategy, the DVS dosimeters can provide millimeter accuracy in determining the water equivalent path length to the dosimeter location. Further investigations regarding the effect of tissue heterogeneity, as well as the angular dependence as observed previously,13 are currently under way.
ACKNOWLEDGMENTS
The authors wish to thank Thomas Bortfeld for a critical review of this manuscript.
References
- Goitein M., “Magical protons?,” Int. J. Radiat. Oncol., Biol., Phys. 70, 654–656 (2008). 10.1016/j.ijrobp.2007.10.057 [DOI] [PubMed] [Google Scholar]
- Schaffner B. and Pedroni E., “The precision of proton range calculations in proton radiotherapy treatment planning: Experimental verification of the relation between CT-HU and proton stopping power,” Phys. Med. Biol. 43, 1579–1592 (1998). 10.1088/0031-9155/43/6/016 [DOI] [PubMed] [Google Scholar]
- Minohara S., Endo M., Kanai T., Kato H., and Tsujii H., “Estimating uncertainties of the geometrical range of particle radiotherapy during respiration,” Int. J. Radiat. Oncol., Biol., Phys. 56, 121–125 (2003). 10.1016/S0360-3016(03)00092-0 [DOI] [PubMed] [Google Scholar]
- Engelsman M. and Kooy H., “Target volume dose considerations in proton beam treatment planning for lung tumors,” Med. Phys. 32, 3549–3557 (2005). 10.1118/1.2126187 [DOI] [PubMed] [Google Scholar]
- Lu H., “A potential method for in vivo range verification in proton therapy treatment,” Phys. Med. Biol. 53, 1413–1424 (2008). 10.1088/0031-9155/53/5/016 [DOI] [PubMed] [Google Scholar]
- Lu H., “A point dose method for in vivo range verification in proton therapy,” Phys. Med. Biol. 53, N415–N422 (2008). 10.1088/0031-9155/53/23/N01 [DOI] [PubMed] [Google Scholar]
- Melancon A., Lee A., Kudchadker R., and Dong L., “Improving rectal sparing with a single anterior proton beam: A planning study,” Med. Phys. 35, 2833 (2008). 10.1118/1.2962218 [DOI] [Google Scholar]
- Essers M. and Mijnheer B., “In vivo dosimetry during external photon beam radiotherapy,” Int. J. Radiat. Oncol., Biol., Phys. 43, 245–259 (1999). 10.1016/S0360-3016(98)00341-1 [DOI] [PubMed] [Google Scholar]
- Black R., Scarantino C., Mann G., Anscher M., Ornitz R., and Nelms B., “An analysis of an implantable dosimeter system for external beam therapy,” Int. J. Radiat. Oncol., Biol., Phys. 63, 290–300 (2005). 10.1016/j.ijrobp.2005.05.025 [DOI] [PMC free article] [PubMed] [Google Scholar]
- Beyer G., Scarantino C., Prestidge B., Sadeghi A., Anscher M., Miften M., Carrea T., Sims M., and Black R., “Technical evaluation of radiation dose delivered in prostate cancer patients as measured by an implantable MOSFET dosimeter,” Int. J. Radiat. Oncol., Biol., Phys. 69, 925–935 (2007). 10.1016/j.ijrobp.2007.06.065 [DOI] [PubMed] [Google Scholar]
- Scarantino C., Prestidge B., Anscher M., Ferree C., Kearns W., Black R., Bolick N., and Beyer G., “The observed variance between predicted and measured radiation dose in breast and prostate patients utilizing an in vivo dosimeter,” Int. J. Radiat. Oncol., Biol., Phys. 72, 597–604 (2008). 10.1016/j.ijrobp.2008.05.058 [DOI] [PMC free article] [PubMed] [Google Scholar]
- Rosenfeld A., Bradley P., Cornelius I., Kaplan G., Allen B., Flanz J., Goitein M., Meerbeeck A., Schbert J., Bailey J., Takada Y., Maruhashi A., and Hayakawa Y., “New silicon detector for microdosimetry applications in proton therapy,” IEEE Trans. Nucl. Sci. 47, 1386–1394 (2000). 10.1109/23.872983 [DOI] [Google Scholar]
- Kohno R., Nishio T., Miyagishi T., Hirano E., Hotta K., Kawashima Mi., and Ogino T., “Experimental evaluation of a MOSFET dosimeter for proton dose measurements,” Phys. Med. Biol. 51, 6077–6086 (2006). 10.1088/0031-9155/51/23/009 [DOI] [PubMed] [Google Scholar]
- Lu H. and Kooy H., “Optimization of current modulation function for proton SOBP fields,” Med. Phys. 33, 1281–1287 (2006). 10.1118/1.2188072 [DOI] [PubMed] [Google Scholar]
- Lu H., Brett R., Engelsman M., Slopsema R., Kooy H., and Flanz J., “Sensitivities in the production of spread-out Bragg peak dose distributions by passive scattering with beam current modulation,” Med. Phys. 34, 3844–3853 (2007). 10.1118/1.2776255 [DOI] [PubMed] [Google Scholar]
- Koehler A., Schneider R., and Sisterson J., “Range modulators for protons and heavy ions,” Nucl. Instrum. Methods 131, 437–440 (1975). 10.1016/0029-554X(75)90430-9 [DOI] [Google Scholar]
- Oldham T., “Recombination along the tracks of heavy charged particles in SiO2 films,” J. Appl. Phys. 57, 2695–2702 (1985). 10.1063/1.335409 [DOI] [Google Scholar]
- Tallon R., Kemp W., Ackermann M., Owen M., and Hofland A., “Radiation damage in MOS transistors as a function of the angle between an applied electric field and various incident radiations (protons, electrons, and Co-60 gamma rays),” IEEE Trans. Nucl. Sci. 34, 1208–1213 (1987). 10.1109/TNS.1987.4337454 [DOI] [Google Scholar]
- Bortfeld T., “An analytical approximation of the Bragg curve for therapeutic proton beams,” Med. Phys. 24, 2024–2033 (1997). 10.1118/1.598116 [DOI] [PubMed] [Google Scholar]
- Lu H., “A method for intra-fractional beam range control in proton therapy treatment,” Med. Phys. 36, 2573 (2009). 10.1118/1.3181703 [DOI] [Google Scholar]


