Abstract
Purpose: A three-dimensional finite element analysis based canine heart model is introduced that would enable the assessment of cardiac function.
Methods: The three-dimensional canine heart model is based on the cardiac deformation and motion model obtained from the Cardiac Mechanics Research Group at UCSD. The canine heart model is incorporated into ultrasound simulation programs previously developed in the laboratory, enabling the generation of simulated ultrasound radiofrequency data to evaluate algorithms for cardiac elastography. The authors utilize a two-dimensional multilevel hybrid method to estimate local displacements and strain from the simulated cardiac radiofrequency data.
Results: Tissue displacements and strains estimated along both the axial and lateral directions (with respect to the ultrasound scan plane) are compared to the actual scatterer movement obtained using the canine heart model. Simulation and strain estimation algorithms combined with the three-dimensional canine heart model provide high resolution displacement and strain curves for improved analysis of cardiac function. The use of principal component analysis along parasternal cardiac short axis views is also presented.
Conclusions: A 3D cardiac deformation model is proposed for evaluating displacement tracking and strain estimation algorithms for cardiac strain imaging. Validation of the model is shown using ultrasound simulations to generate axial and lateral displacement and strain curves that are similar to the actual axial and lateral displacement and strain curves.
Keywords: cardiac elastography, ultrasound simulation, strain, displacement, elastography, elastogram, elasticity, elasticity imaging
INTRODUCTION
Coronary artery disease is the leading cause of morbidity and mortality in the United States. Despite advances in prevention and treatment of this disorder, there remains a large patient population who are difficult to diagnose noninvasively, yet require percutaneous or surgical revascularization.1, 2 Myocardial ischemia is generally associated with impaired regional myocardial function. Current clinical assessment uses analysis of myocardial wall motion abnormalities using echocardiography,2, 3 nuclear imaging,4, 5, 6 or magnetic resonance imaging.7, 8, 9
Echocardiography has been routinely used for the assessment of regional myocardial function, left ventricular size, and structure since it provides real-time information, is portable, and is readily available. Both B-mode and M-mode imaging have been utilized for echocardiographic analysis. However, this type of analysis is limited because it is most frequently used in a semiquantitative fashion to assess both global and regional changes. As a consequence, there is a considerable variation among interpreters of echocardiograms.10 Thickening and shortening of the wall muscle visualized using echocardiography during the cardiac cycle can also be characterized by local tissue displacements and measurements of strain, which could be useful indicators of myocardial performance.11
Tissue Doppler imaging (TDI) has been used to assess myocardial muscle displacements, providing quantitative parameters such as the strain and the strain rate [speed at which the deformation (strain) occurs].12, 13 Since TDI based methods rely on narrow-band Doppler phase-shift analysis, associated disadvantages, such as angle dependence, poor axial resolution, aliasing, and increase in ambiguity of the velocity information with center frequency, are inherited.14, 15, 16 Limitations with Doppler-derived velocity and strain indices have renewed interest in using B-mode based strain and strain rate measurements.14, 15, 16, 17 B-mode based calculations of strain have the considerable advantage of not being directionally limited. However, strain estimates obtained with B-mode or envelope signals are less accurate than those obtained with radiofrequency (RF) data.18
Cardiac elastography19, 20, 21, 22, 23 using RF echo signals provide more accurate 2D strain information when compared to B-mode data,18 as long as the RF data, at a sufficient frame rate, are acquired.24 In addition, when compared to speckle tracking of envelope data, RF tracking provides significant improvements in the signal-to-noise ratio and sensitivity, along with improved accuracy and precision in displacement and strain estimation.18 Konofagou et al.19 have demonstrated the ability to obtain accurate strain information over a small 10°–15° sector containing eight to ten A-lines. The small sector enables the acquisition of RF data at extremely high frame rates. D’Hooge et al.21 reviewed the principles of cardiac strain and strain rate imaging, describing the drift in the time-integrated strain curve which has to be compensated before clinical diagnosis.
However, most of the strain tensor estimation methods discussed in the literature22, 25, 26, 27, 28, 29 utilizing RF data estimate primarily the axial component of the strain, while the lateral (perpendicular to insonification direction and within the scan plane) and elevational (perpendicular to the insonification direction and scan plane) displacements and strain are generally not estimated. Since tissue deformation introduces motion and displacements in three dimensions (3D), all strain tensor and displacement vector components are required to characterize the deformation.27, 30 Several methods have been proposed for the estimation of the displacement vector and strain tensor components.31, 32, 33, 34 Estimation of all the displacement vector and strain tensor components provides a complete depiction of tissue deformation. However, in certain cases such as cardiac motion,19, 20 where tissue deformations are complex, other approaches for quantifying the displacement and strain may be necessary.35
Principal component analysis (PCA)36, 37 is another method for characterizing the strain distribution where the primary strain tensor components may not lie along the ultrasound insonification direction. Principal strains are defined as the normal strain components along the deformation axes where the shearing strains are included in principal strains. Zervantonakis et al.35 utilized PCA analysis to reduce angle and centroid dependence for radial strain in myocardial elastography and to obtain radial and circumferential strain images. Compared to polar strain estimates, principal strain components are more robust in the detection of cardiac dysfunction independent of the echocardiographic view.
Ultrasound system manufacturers currently provide 3D B-mode based cardiac clinical ultrasound systems.38, 39 More useful information can be obtained from 3D ultrasound image data with a large number of viewing planes that can be reconstructed from the 3D data set. Over the past decade, 2D ultrasound transducers have also moved beyond the research environment and into clinical settings.40 Although current 3D cardiac ultrasound imaging systems now provide real-time full 3D (4D) imaging over the entire heart, they typically do not provide access to 3D RF data. Most clinical cardiac ultrasound systems currently only provide 2D cardiac ultrasound RF data. Finite element analysis (FEA) based modeling is therefore necessary to enable evaluation and testing of 3D strain estimation and tracking algorithms. The 3D canine heart model41, 42 and ultrasound simulation presented in this paper provides the ability to evaluate 3D displacement tracking and strain estimation algorithms with 3D RF data at the high frame rates needed for strain imaging.
MATERIALS AND METHODS
We present a 3D cardiac mechanics model41, 42 for normal canine hearts utilized to generate realistic deformation patterns introduced during a cardiac cycle incorporated into an ultrasound simulation. These models would enable the utilization of 3D ultrasound simulation programs utilizing 2D transducer arrays to obtain 4D (3D+time) RF data over the entire cardiac cycle.
3D CANINE HEART MODEL
An FEA model based on the “CONTINUITY 6” software that enables simulation of all movement and deformation aspects (compression, translation, and torsion) of a canine heart is used.41, 42 This software package, developed by the Cardiac Mechanics Research Group at the University of California San Diego (UCSD), provides solutions for 3D nonlinear finite deformation elasticity and nonlinear reaction-diffusion systems applicable to the mechanics and electrophysiology of the mammalian (canine) heart.41, 42CONTINUITY 6 is distributed free for academic research by the National Biomedical Computation Resource and runs under Windows, Mac OS, or Linux. Simulated ultrasound RF data have also been obtained using Field II and the FEA model.43
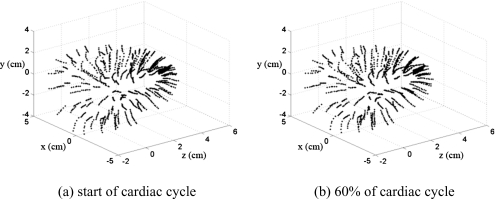
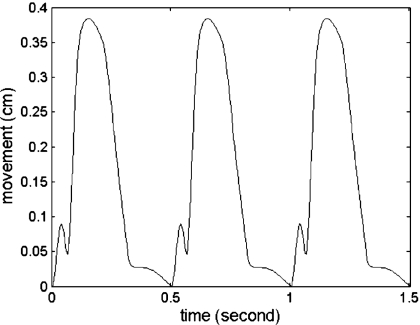
We utilize the left ventricular model provided by UCSD in conjunction with the ultrasound simulation program developed in our laboratory to evaluate methods to characterize cardiac function by estimating local displacements and strains. The canine heart data contain the movement of 1296 points located in the canine heart wall acquired at a sampling rate of 250 Hz. Figure 1 presents 3D coordinates of the 1296 points at two different time instances over the cardiac cycle. The heart rate of the canine heart model was 2 beats∕s, which enables the acquisition of cardiac ultrasound simulated RF data at temporal frame rates of up to 125 frames per cardiac cycle. Figure 2 depicts the movement of a point located on the cardiac wall over three cardiac cycles.
Figure 1.
Three-dimensional coordinates of the 1296 points obtained using the UCSD cardiac mechanics model, depicted at two time instances over the cardiac cycle.
Figure 2.
Deformation of one of the points located on the cardiac wall (shown in Fig. 1) over three cardiac cycles.
The deformation information provided with CONTINUITY 6 is, however, too coarse for the generation of ultrasound backscattered signals. We therefore reconstruct the 3D continuous smooth surface of the canine heart model utilizing the 3D positional information provided, namely, from the limited number, i.e., 1296 data points. The ultrasound simulation requires random positioning of scatterers over the entire cardiac volume at a number density of around ten scatterers per cubic millimeter to ensure Rayleigh scattering statistics. In addition, the ability to track the deformation of these scatterers over the cardiac cycle is also essential. Utilization of this scatterer density requires the inclusion of approximately 1.1×10⁶ scatterers based on the volume of the canine heart model. We utilize 3D nonlinear interpolation to obtain a finer motion∕deformation grid to track the motion of these embedded scatterers.
3D NONLINEAR INTERPOLATION (CUBIC HERMITE INTERPOLATION)
The data points within the canine heart model are interpolated based on piecewise cubic Hermite interpolation. The cubic Hermite polynomial has interpolative properties where both the function values and their derivatives are known at the end points of the interval. Let (xi,yi) and (xi+1,yi+1) denote two end points of the interval and hi denote the length of the interval
| (1) |
Let di denote the derivative (slope) of the interpolant atxi,
| (2) |
The interval function [xi,xi+1] can be expressed in term of local variable s=x−xi
| (3) |
Note that Eq. 3 satisfies four interpolation conditions,
| (4) |
If both the function and derivative values at a set of data points are available, we can reproduce the continuous function with piecewise cubic Hermite interpolation. Note that even if the derivative values are not provided, we can define the slopedi. Fritsch et al.44 and Kahaner et al.45 describe methods to determine the slope di using data values xi andyi. The key idea is to keep the interpolation function f(x) propagating through each point smoothly. There are two ways to determine the value of the slopedi.
-
(1)
If (yi>yi−1) and (yi>yi+1) or (yi<yi−1) and(yi<yi+1),di=0. The slope di is equal to 0 if yi is the local minimum or maximum when intervals hi−1 and hi on both sides of yi are equal.
-
(2)If (hi−1=hi) and (yi−1<yi<yi+1) or(yi−1>yi>yi+1), the reciprocal slope (1∕di) is equal to the average of the reciprocal slopes of the piecewise linear interpolant on either side,
where αi=yi+1−yi∕hi andαi−1=yi−yi−1∕hi−1.(5) -
(3)If(hi−1≠hi), then di is a weighted harmonic mean, with weights determined by the lengths of the two intervals
(6)
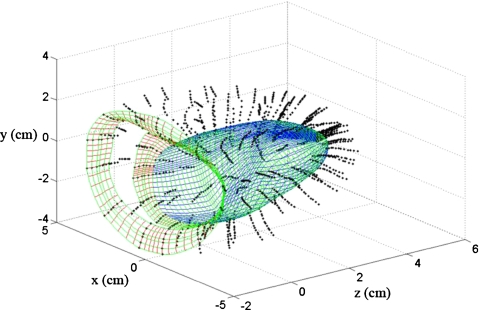
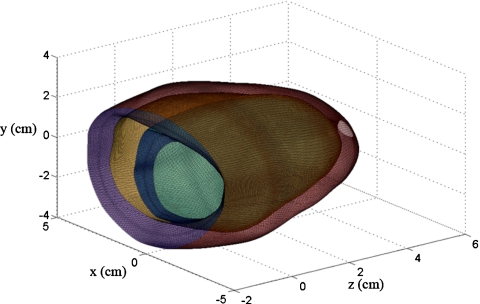
Although the piecewise cubic Hermite interpolation can be extended to higher dimensions,46 it requires complex analysis with a large computational burden. The complex higher dimensional interpolation is, however, not necessary and three independent piecewise cubic Hermite interpolations sequentially along thex, y, and z coordinates can be performed to provide sufficient boundary information for scatterer locations. The three interpolation steps are performed sequentially along the different directions, for example, first through the cardiac wall, second in the direction around the short axis view of the heart, and finally along the long axis view of the heart. Figure 3 denotes the three interpolation steps depicted using three different colors to identify the interpolation direction. The density of the curves in Fig. 3 is downsampled by a factor of 4 to appropriately display the information. In the first stage, 45 data points are obtained through the 3D interpolation procedure from 12 original data points by interpolating through the cardiac wall. These interpolation curves are presented in x-z plane on Fig. 3. The second interpolation is applied along the short axis, with 240 data points depicted as the curves in x-y plane in Fig. 3, obtained from the 12 original data points. Finally, the third interpolation step is applied along the long axis, generating 161 data points from the nine original data points and shown in y-z plane in Fig. 3. In total 1 738 800 data points are generated in this manner from the 1296 original data points provided by CONTINUITY 6. Figure 4 depicts 165 000 data points on the surface of the 3D canine heart model. The interpolated grid is then utilized to obtain the predeformational and postdeformational positions of the tissue scatterers within the cardiac wall, used to generate RF data as described in Sec. 5.
Figure 3.
Smooth interpolated curves obtained along three sequentially applied interpolation directions, namely the short axis or x-y plane, long axis or y-z plane, and along the cardiac wall or x-z plane (units for all coordinate axes are in cm).
Figure 4.
The interpolated cardiac surface with approximately 165 000 data points for the 3D canine heart model, indicating the fine scale of the deformations utilized in the ultrasound simulations (unit for all coordinate axes are in cm).
SCATTERER DISTRIBUTION IN THE 3D CANINE HEART MODEL
In the next step we randomly distribute scatterers at a sufficient number density to obtain Rayleigh statistics for the ultrasound simulation. Note that these scatterers should be constrained to lie within the walls of the canine heart model. To ensure the random distribution of the scatterers without clumping, we divide the canine heart model into 1 689 600 hexahedrons with 1 738 800 interpolated data points. The scatterer number and, thereby, density are decided based on the volume of the 1 689 600 hexahedrons, with the scatterers randomly distributed within the hexahedrons. The canine heart model contains tissue deformation information over 1.904 s with a 250 Hz temporal frame rate (two cardiac cycles at 125 frames∕cycle). Finally, the movement of the scatterers within the hexahedron is calculated based on spatial relationships between the scatterers and the hexahedron surface.
A relative shift occurs among the eight vertices of each hexahedron with deformation. The deformation of individual hexahedrons can be quite large when we estimate the movement of the scatterers located within the hexahedron. To evaluate the volume changes of individual hexahedrons and to compensate for the deformation of the hexahedron for scatterers location estimation, each hexahedron is divided into six pyramids. The location of the scatterers within each pyramid can be exclusively represented and computed using the four vertices of the pyramid.
ULTRASOUND SIMULATION PROGRAM
The ultrasound simulation program models the variation of the ultrasound field produced by a transducer in the frequency domain.47 The simulation program loads the canine model parameters and ultrasound transducer parameters from a binary input file. The backscatter coefficients of the tissue types (cardiac muscle tissue) are also provided in the binary input file. The pressure field, the number of beam lines, the frequency step, and the number of frequency points are calculated based on the dimensions of the cardiac model and ultrasound transducer characteristics. The field pressure at each frequency point and beam-steered angle for phased array transducers are also calculated. The simulation program outputs the ultrasound signal in the frequency domain. We then utilize MATLAB (Mathworks, Natick, MA) to obtain the time-domain band-pass RF data from the ultrasound simulated data in the frequency domain. The raw RF ultrasound data are obtained after applying the inverse fast Fourier transform operator in MATLAB over several cardiac cycles.
All the traditional cardiac imaging views can be obtained by appropriate placement of the transducer. For example, placement of the transducer at the side of canine heart model generates cross-sectional RF data or short axis views. A 1D linear array transducer was modeled, consisting of 0.2×10 mm elements with a 0.2 mm center-to-center separation. Each acoustic beam was formed utilizing 32 consecutive elements. The incident pulses were modeled to be Gaussian shaped with an 8 MHz center frequency and an 80% bandwidth (full-width at half-maximum). The speed of sound in the canine model and ultrasound beam-forming was set to 1540 m∕s and the attenuation coefficient was 0.5 dB∕cm.
SIMULATION RESULTS
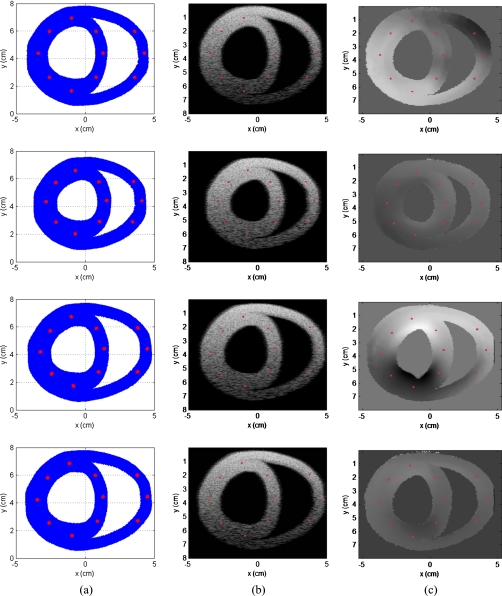
The 3D canine heart model provides data over 2 heartbeats∕s. We obtained a total of 125 RF frames over a cardiac cycle under the 250 Hz temporal frame rate. The linear array transducer is located at the top of 3D canine heart model along the x-y plane atz=0 cm. Figure 5 presents the scatterer distribution, along with the corresponding B-mode and tissue displacement images obtained at four different time instances over the cardiac cycle. These time instances correspond to 0, T∕4, T∕2, and 3T∕4, where T denotes the period of a single cardiac cycle (i.e., 0, 0.124, 0.248, and 0.372 s, respectively). Column (a) of Fig. 5 denotes the scatterer distribution scanned using the simulated transducer at four different time instances within the cardiac cycle. The corresponding B-mode images are shown in column (b) and the estimated displacement images in column (c) of Fig. 5.
Figure 5.
Scatterer distribution scanned using the simulated transducer is shown in column (a), with the corresponding B-mode images obtained in column (b); the estimated displacement images are shown in column (c). Data at four different time instances that correspond to 0, T∕4, T∕2, and 3T∕4, respectively, (i.e., 0, 0.124, 0.248, and 0.372 s), where T denotes the time period for a cardiac cycle, respectively, over the cardiac cycle are presented.
The 125 ultrasound RF echo signal frames generated over a cardiac cycle were analyzed using the multilevel hybrid method48 to compute both displacement and strain images. The algorithm estimates frame-to-frame local displacements, with B-Mode image data used for the first cross-correlation step to estimate coarse displacements. The analysis window size was 24 wavelengths (axial) by 15 A-lines (lateral), with a 66.67% overlap between successive windows. The second correlation step uses 16 wavelength×11 A-line windows with a 50% overlap. In a similar manner, the third correlation step used an eight wavelength×seven A-line window with a 50% overlap. Finally, the last (fourth) correlation step uses a four wavelength×five A-line windows with a 50% overlap to obtain the fine displacement measurements shown in Fig. 5c.
Observe the drift in the displacement estimates over the cardiac cycle as the displacements are accumulated over consecutive frames. At the end of each cardiac cycle, the heart wall should have zero accumulated displacement since the heart muscle should return to its initial position.
Using this boundary condition and assuming that the bias introduced is not dependent on the heart wall position within the heart cycle, the displacement drift can be compensated linearly within each heart cycle. Drift in the displacement estimated are also observed in in vivo data collected on human patients.24 Column (c) in Fig. 5 present local displacement images obtained using the multilevel hybrid method at the four different time instances described earlier in this section.
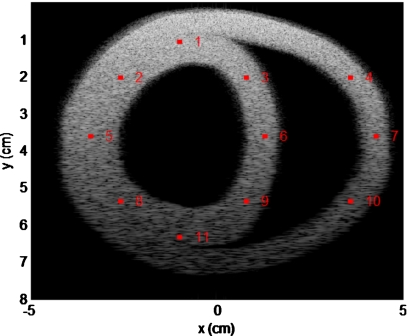
The 11 different regions of interest (ROIs) marked in red represent the corresponding location of the scatterers in the scatterer distribution and B-mode images in Fig. 5. To quantitatively evaluate the deformation of the canine cardiac wall from the ultrasound RF data, we compare actual scatterer movement or deformation (obtained from FEA) to that estimated from ultrasound RF data using the multilevel hybrid method. The 11 ROI are indexed or numbered from 1 to 11 as shown in Fig. 6. We also compare the estimated strain of ROIs to the strain calculated from actual cardiac wall movement.
Figure 6.
Index or numbering of the 11 ROI in the canine cardiac wall denoted on a simulated ultrasound B-mode image.
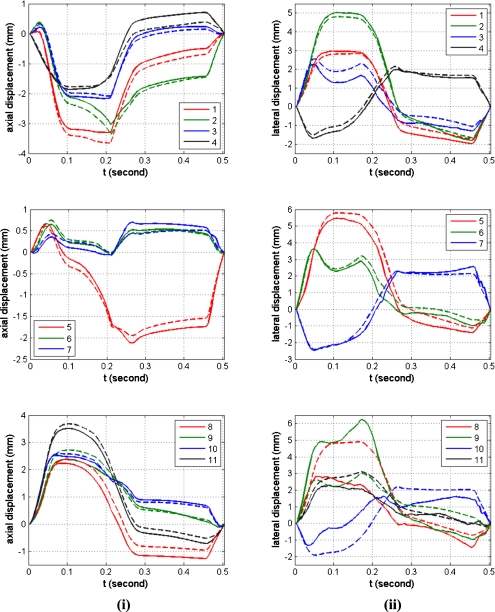
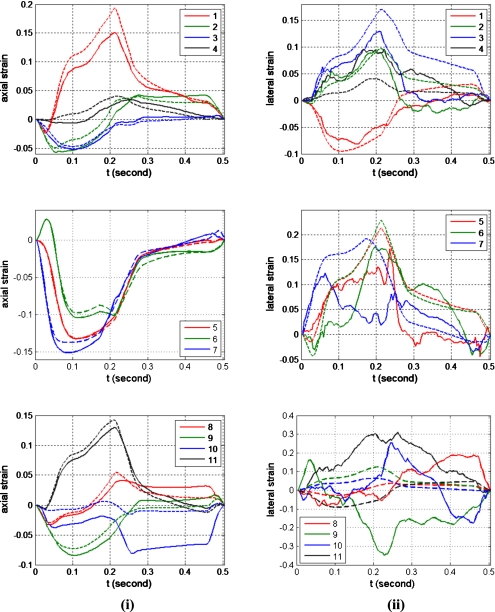
Note that the estimated axial displacements and strains presented in Figs. 78, respectively, match the actual scatterer deformations very well for all the 11 different ROI. The curve shape of the estimated displacement and the actual scatterer movements are almost identical as shown in Fig. 7. The maximum accumulated estimation error of displacement is around 0.4 mm equal to two wavelengths along the axial direction for the assumed ultrasound sound speed of 1540 m∕s and center frequency of 8 MHz. The maximum accumulated estimation error for the displacement estimate is small, considering that the window length (0.8 mm) and number of frames (125 frames) over which the estimated displacement was accumulated over the cardiac cycle. Figure 8 shows that the estimated strain curve matches the ideal (FEA) strain curve calculated from the actual scatterer movement even through large errors in the amplitude are observed for some ROI (for example, ROI 10).
Figure 7.
Quantitative comparison of the estimated displacement (solid line) with the actual interpolated scatterer displacements obtained from CONTINUITY 6 (dashed line) for the 11 ROI within the canine cardiac wall. The column on the left denotes the axial displacement, while the right column presents the lateral displacement, respectively.
Figure 8.
Quantitative comparison of the estimated strain (solid line) with the actual strain calculated from actual displacements obtained from CONTINUITY 6 FEA model (dashed line) for the 11 ROI within the canine cardiac wall. The column on the left denotes the axial strain, while the right column presents the lateral strain, respectively.
On the other hand, the estimated displacements and strain along the lateral direction are significantly noisier than the estimated displacements along the axial direction, as expected. The performance of lateral displacement estimation for ROIs 8–11 is significantly worse when compared to other ROI within the cardiac wall. Reasons for the poor displacement estimation include the fact that ROIs 8–11 are located below the focal region which is set at 4 cm. In addition, the reduction in the amplitude of the ultrasound RF signal (due to frequency dependent attenuation) and the larger beam width of the ultrasound beam profile below the focus introduce additional noise artifacts into the lateral displacement estimate. Lateral strain estimation contains more artifacts when compared to lateral displacements, as expected, since local strain is computed from the gradient of the displacement and small displacement noise artifacts are amplified in the strain curves. The strain curves for ROIs 1–6, are quite noisy even though they have similar shapes as the ideal FEA strain curves. On the other hand, the strain curves for ROIs 7–11 are noisier when compared to the strain curves obtained for ROIs 1–6 and are significantly different from the ideal FEA strain curves. All of these ROIs are located at depths deeper than the focus, where the ultrasound beam is broader. The speckle texture in the B-mode image at these depths is also larger than those observed at shallower depths. In addition, the amplitudes of the RF signal in these ROIs are lower due to attenuation, leading to lower sonographic signal-to-nose ratios in these ROIs leading to the increased estimation errors.
The actual and estimated axial and lateral strain images in Fig. 9 are presented using the same color bar range for comparison. A 1% strain corresponds to a value of 0.01 on the color bar. Positive values denote the compression of the myocardium while negative values denote the relaxation or expansion of the myocardial muscle. The estimated axial strain image closely corresponds to the actual (FEA) axial strain image. However, the estimated lateral strain image is significantly noisy especially at deeper locations. The axial strain distribution within the cardiac wall is nonuniform, as expected. In addition, the top and bottom regions within the cardiac wall depict larger strain values when compared to the strain values of the central region within the cardiac wall.
Figure 9.
Comparison of the actual and estimated axial and lateral strain tensor images obtained using the multistep 2D cross-correlation method using simulated ultrasound RF data obtained using the 3D canine heart model. The strain images depicted include the (a) actual axial strain tensor, (b) estimated axial strain tensor, (c) actual lateral strain tensor, and (d) estimated lateral strain tensor images, respectively.
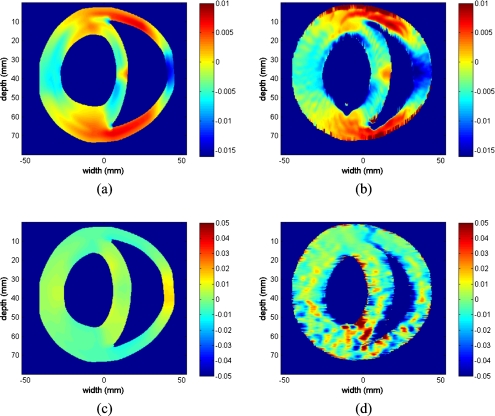
The first and second principal component strain images in Fig. 10 are calculated from the axial, lateral, and shear strain tensor images as described in a previous publication.49 Observe that both the actual first and second principal component strain images are uniform and have larger strain values when compared to the actual axial and lateral strain tensor images (from the color bar). Values of the first and second principal component strain images are independent of the angle and depth location relative to the center of the cardiac wall. The estimated first and second principal component strain images are also uniform within the cardiac wall with higher noise levels when compared to the actual first and second principal component strain images. Most of the noise artifacts are located around the bottom of the cardiac wall (deeper locations), which are introduced by the noise artifacts present in the estimated lateral strain and shear strain images at the same location.
Figure 10.
Comparison of the first and second principal component strain images obtained from the actual displacement and estimated displacements obtained using the multistep 2D cross-correlation method using the simulated ultrasound RF data from the 3D canine heart model. The strain images shown include the (a) actual first principal component strain image, (b) estimated first principal component strain image, (c) actual second principal component strain image, and (d) estimated second principal component strain image.
DISCUSSION AND CONCLUSION
In this paper, a 3D FEA based canine cardiac mechanics model is utilized to generate simulated ultrasound RF data. The 3D canine heart model is based on the cardiac deformation and motion obtained from the Cardiac Mechanics Research Group, UCSD. A nonlinear 3D interpolation was utilized to generate smooth cardiac structure at the resolution required to incorporate ultrasound scattering to generate backscattered ultrasound echo signals. We utilize a scatterer number density necessary to generate Rayleigh scattering statistics, commonly associated with ultrasonic backscattered signals.50 Other investigators have also reported on the presence of non-Rayleigh first-order statistics in the backscattered signals from normal myocardium.51 These scatterers are positioned within the cardiac wall and are free to move∕deform over the entire cardiac cycle. The 3D movement of the scatterers based on the deformation of the cardiac wall, combined with the ultrasound simulation program, is utilized to generate 3D ultrasound RF data at high digitization sampling rates and at temporal frame rate provided by theCONTINUITY 6 model. These temporal and full-field RF frame rates are significantly higher than that provided∕available with current clinical scanners.
We then utilize the 2D multilevel hybrid method based on RF data to estimate the displacement and the strain along both the axial and lateral directions to compare the estimated displacement to the actual movement of the scatterers. The estimated displacement and strain obtained compare reasonably to the actual scatterer movement and the strain calculated from actual deformation. The estimated axial and lateral displacement and strain can be converted to radial, circumferential, or longitudinal strain with corresponding projections obtained using principal component analysis. Our techniques and strain estimation algorithms provide displacement curves with high resolution for the analysis of cardiac function. The 3D FEA canine heart model coupled with the 3D ultrasound simulation can also be utilized for evaluating newer 3D strain imaging algorithms required for ultrasound cardiac strain imaging.
We also present results using principal component analysis techniques along cardiac parasternal short axis views. Principal component analysis techniques provide angle independent strain images useful for clinical diagnosis.
ACKNOWLEDGMENTS
The authors gratefully acknowledge the use of the cardiac mechanics model from the Cardiac Mechanics Research Group at UCSD. The authors would like to thank Dr. Andrew McCulloch, Ph.D. and Dr. Roy Kerckhoffs, Ph.D., who helped the authors with this model. This work was funded in part by NIH Grant Nos. R01 CA112192-04 and 5R21EB010098-02.
References
- White F. C., Carroll S. M., Magnet A., and Bloor C. M., “Coronary collateral development in swine after coronary artery occlusion,” Circ. Res. 71, 1490–1500 (1992). [DOI] [PubMed] [Google Scholar]
- Marwick T. H., “Current status of stress echocardiography for diagnosis and prognostic assessment of coronary artery disease,” Coron. Artery Dis. 9, 411–426 (1998). 10.1097/00019501-199809070-00004 [DOI] [PubMed] [Google Scholar]
- Willenheimer R. B., Erhardt L. R., Cline C. M., Rydberg E. R., and Israelsson B. A., “Prognostic significance of changes in left ventricular systolic function in elderly patients with congestive heart failure,” Coron. Artery Dis. 8, 711–717 (1997). 10.1097/00019501-199711000-00007 [DOI] [PubMed] [Google Scholar]
- Mandalapu B. P., Amato M., and Stratmann H. G., “Technetium Tc 99m sestamibi myocardial perfusion imaging: Current role for evaluation of prognosis,” Chest 115, 1684–1694 (1999). 10.1378/chest.115.6.1684 [DOI] [PubMed] [Google Scholar]
- Vanoverschelde J. L., Gerber B., Pasquet A., and Melin J. A., “Nuclear and echocardiographic imaging for prediction of reversible left ventricular ischemic dysfunction after coronary revascularization: Current status and future directions,” J. Cardiovasc. Pharmacol. 28, S27–S36 (1996). [DOI] [PubMed] [Google Scholar]
- Sinusas A. J., Beller G. A., and Watson D. D., “Cardiac imaging with technetium 99m-labeled isonitriles,” J. Thorac. Imaging 5, 20–30 (1990). 10.1097/00005382-199007000-00006 [DOI] [PubMed] [Google Scholar]
- Pelc N. J., Herfkens R. J., Shimakawa A., and Enzmann D. R., “Phase contrast cine magnetic resonance imaging,” Magn. Reson. Q. 7, 229–254 (1991). [PubMed] [Google Scholar]
- Osman N. F., Sampath S., Atalar E., and Prince J. L., “Imaging longitudinal cardiac strain on short-axis images using strain-encoded MRI,” Magn. Reson. Med. 46, 324–334 (2001). 10.1002/mrm.1195 [DOI] [PubMed] [Google Scholar]
- T. S.Denney, Jr. and Prince J. L., “Reconstruction of 3-D left ventricular motion from planar tagged cardiac MR images: An estimation theoretic approach,” IEEE Trans. Med. Imaging 14, 625–635 (1995). 10.1109/42.476104 [DOI] [PubMed] [Google Scholar]
- Heimdal A., Stoylen A., Torp H., and Skjaerpe T., “Real-time strain rate imaging of the left ventricle by ultrasound,” J. Am. Soc. Echocardiogr 11, 1013–1019 (1998). 10.1016/S0894-7317(98)70151-8 [DOI] [PubMed] [Google Scholar]
- McVeigh E. R. and Zerhouni E. A., “Noninvasive measurement of transmural gradients in myocardial strain with MR imaging,” Radiology 180, 677–683 (1991). [DOI] [PMC free article] [PubMed] [Google Scholar]
- McDicken W. N., Sutherland G. R., Moran C. M., and Gordon L. N., “Colour Doppler velocity imaging of the myocardium,” Ultrasound Med. Biol. 18, 651–654 (1992). 10.1016/0301-5629(92)90080-T [DOI] [PubMed] [Google Scholar]
- Sutherland G. R., Stewart M. J., Groundstroem K. W., Moran C. M., Fleming A., Guell-Peris F. J., Riemersma R. A., Fenn L. N., Fox K. A., and McDicken W. N., “Color Doppler myocardial imaging: A new technique for the assessment of myocardial function,” J. Am. Soc. Echocardiogr 7, 441–458 (1994). [DOI] [PubMed] [Google Scholar]
- Korinek J., Wang J., Sengupta P., Miyazaki C., Kjaergaard J., McMahon E., Abraham T., and Belohlavek M., “Two-dimensional strain—A Doppler-independent ultrasound method for quantitation of regional deformation: Validation in vitro and in vivo,” J. Am. Soc. Echocardiogr 18, 1247–1253 (2005). 10.1016/j.echo.2005.03.024 [DOI] [PubMed] [Google Scholar]
- Becker M., Bilke E., Kuhl H., Katoh M., Kramann R., Franke A., Bucker A., Hanrath P., and Hoffmann R., “Analysis of myocardial deformation based on pixel tracking in two dimensional echocardiographic images enables quantitative assessment of regional left ventricular function,” Heart 92, 1102–1108 (2006). 10.1136/hrt.2005.077107 [DOI] [PMC free article] [PubMed] [Google Scholar]
- Reisner S., Lysyansky P., Agmon Y., Mutlak D., Lessick J., and Friedman Z., “Global longitudinal strain: A novel index of left ventricular systolic function,” J. Am. Soc. Echocardiogr 17, 630–633 (2004). 10.1016/j.echo.2004.02.011 [DOI] [PubMed] [Google Scholar]
- Geyer H., Caracciolo G., Abe H., Wilansky S., Carerj S., Gentile F., Nesser H. -J., Khandheria B., Narula J., and Sengupta P. P., “Assessment of myocardial mechanics using speckle tracking echocardiography: Fundamentals and clinical applications,” J. Am. Soc. Echocardiogr 23, 351–369 (2010). 10.1016/j.echo.2010.02.015 [DOI] [PubMed] [Google Scholar]
- Varghese T. and Ophir J., “Characterization of elastographic noise using the envelope of echo signals,” Ultrasound Med. Biol. 24, 543–555 (1998). 10.1016/S0301-5629(98)00008-8 [DOI] [PubMed] [Google Scholar]
- Konofagou E., D’Hooge J., and Ophir J., “Myocardial elastography—A feasibility study in vivo,” Ultrasound Med. Biol. 28, 475–482 (2002). 10.1016/S0301-5629(02)00488-X [DOI] [PubMed] [Google Scholar]
- Varghese T., Zagzebski J. A., Rahko P., and Breburda C. S., “Ultrasonic imaging of myocardial strain using cardiac elastography,” Ultrason. Imaging 25, 1–16 (2003). [DOI] [PubMed] [Google Scholar]
- D’hooge J., Heimdal A., Jamal F., Kukulski T., Bijnens B., Rademakers F., Hatle L., Suetens P., and Sutherland G. R., “Regional strain and strain rate measurements by cardiac ultrasound: Principles, implementation and limitations,” Eur. J. Echocardiogr. 1, 154–170 (2000). 10.1053/euje.2000.0031 [DOI] [PubMed] [Google Scholar]
- Varghese T., “Quasi-static ultrasound elastography,” Ultrasound Clin. 4, 323–338 (2009). 10.1016/j.cult.2009.10.009 [DOI] [PMC free article] [PubMed] [Google Scholar]
- Lopata R. G., Nillesen M. M., Verrijp C. N., Singh S. K., Lammens M. M., van der Laak J. A., van Wetten H. B., Thijssen J. M., Kapusta L., and de Korte C. L., “Cardiac biplane strain imaging: Initial in vivo experience,” Phys. Med. Biol. 55, 963–979 (2010). 10.1088/0031-9155/55/4/004 [DOI] [PubMed] [Google Scholar]
- Chen H., Varghese T., Rahko P., and Zagzebski J. A., “Ultrasound frame rate requirements for cardiac elastography: Experimental and in vivo results,” Ultrasonics 49, 98–111 (2009). 10.1016/j.ultras.2008.05.007 [DOI] [PubMed] [Google Scholar]
- Ophir J., Cespedes I., Ponnekanti H., Yazdi Y., and Li X., “Elastography: A quantitative method for imaging the elasticity of biological tissues,” Ultrason. Imaging 13, 111–134 (1991). 10.1016/0161-7346(91)90079-W [DOI] [PubMed] [Google Scholar]
- O’Donnell M., Skovoroda A. R., Shapo B. M., and Emelianov S. Y., “Internal displacement and strain imaging using ultrasonic speckle tracking,” IEEE Trans. Ultrason. Ferroelectr. Freq. Control 41, 314–325 (1994). 10.1109/58.285465 [DOI] [Google Scholar]
- Bilgen M. and Insana M. F., “Deformation models and correlation analysis in elastography,” J. Acoust. Soc. Am. 99, 3212–3224 (1996). 10.1121/1.414865 [DOI] [PubMed] [Google Scholar]
- Chen E. J., Adler R. S., Carson P. L., Jenkins W. K., and W. D.O’Brien, Jr., “Ultrasound tissue displacement imaging with application to breast cancer,” Ultrasound Med. Biol. 21, 1153–1162 (1995). 10.1016/0301-5629(95)02005-5 [DOI] [PubMed] [Google Scholar]
- Talhami H. E., Wilson L. S., and Neale M. L., “Spectral tissue strain: A new technique for imaging tissue strain using intravascular ultrasound,” Ultrasound Med. Biol. 20, 759–772 (1994). 10.1016/0301-5629(94)90033-7 [DOI] [PubMed] [Google Scholar]
- Kallel F. and Ophir J., “A least-squares strain estimator for elastography,” Ultrason. Imaging 19, 195–208 (1997). [DOI] [PubMed] [Google Scholar]
- Konofagou E. and Ophir J., “A new elastographic method for estimation and imaging of lateral displacements, lateral strains, corrected axial strains and Poisson’s ratios in tissues,” Ultrasound Med. Biol. 24, 1183–1199 (1998). 10.1016/S0301-5629(98)00109-4 [DOI] [PubMed] [Google Scholar]
- Skovoroda A., Lubinski M., Emelianov S., and O’Donnell M., “Nonlinear estimation of the lateral displacement using tissue incompressibility,” IEEE Trans. Ultrason. Ferroelectr. Freq. Control 45, 491–503 (1998). 10.1109/58.660158 [DOI] [PubMed] [Google Scholar]
- Techavipoo U., Chen Q., Varghese T., and Zagzebski J. A., “Estimation of displacement vectors and strain tensors in elastography using angular insonifications,” IEEE Trans. Med. Imaging 23, 1479–1489 (2004). 10.1109/TMI.2004.835604 [DOI] [PMC free article] [PubMed] [Google Scholar]
- Ebbini E. S., “Phase-coupled two-dimensional speckle tracking algorithm,” IEEE Trans. Ultrason. Ferroelectr. Freq. Control 53, 972–990 (2006). 10.1109/TUFFC.2006.1632687 [DOI] [PubMed] [Google Scholar]
- Zervantonakis I., Fung-Kee-Fung S., Lee W., and Konofagou E., “A novel, view-independent method for strain mapping in myocardial elastography: Eliminating angle and centroid dependence,” Phys. Med. Biol. 52, 4063–4080 (2007). 10.1088/0031-9155/52/14/004 [DOI] [PubMed] [Google Scholar]
- Pearson K., Philos. Mag. 2, 559–572 (1901). [Google Scholar]
- Hotelling H., Analysis of a Complex of Statistical Variables into Principal Components (Warwick & York, Baltimore, 1933). [Google Scholar]
- Downey D., Fenster A., and Williams J., “Clinical utility of three-dimensional US,” Radiographics 20, 559–571 (2000). [DOI] [PubMed] [Google Scholar]
- Fenster A., Downey D., and Cardinal N., “Three-dimensional ultrasound imaging,” Phys. Med. Biol. 46, R67–R99 (2001). 10.1088/0031-9155/46/5/201 [DOI] [PubMed] [Google Scholar]
- Tamano S., Kobayashi T., Sano S., Hara K., Sakano J., and Azuma T., “3D ultrasound imaging system using Fresnel ring array and high voltage multiplexer IC,” Proc.-IEEE Ultrason. Symp. 1, 782–785 (2004). [Google Scholar]
- Mazhari R., Omens J. H., Waldman L. K., and McCulloch A. D., “Regional myocardial perfusion and mechanics: A model-based method of analysis,” Ann. Biomed. Eng. 26, 743–755 (1998). 10.1114/1.74 [DOI] [PubMed] [Google Scholar]
- McCulloch A. D. and Mazhari R., “Regional myocardial mechanics: Integrative computational models of flow-function relations,” J. Nucl. Cardiol. 8, 506–519 (2001). 10.1067/mnc.2001.117113 [DOI] [PubMed] [Google Scholar]
- Luo J., Lee W. N., and Konofagou E. E., “Fundamental performance assessment of 2-D myocardial elastography in a phased-array configuration,” IEEE Trans. Ultrason. Ferroelectr. Freq. Control 56, 2320–2327 (2009). 10.1109/TUFFC.2009.1313 [DOI] [PubMed] [Google Scholar]
- Fritsch F. N. and Carlson R. E., “Monotone piecewise cubic interpolation,” SIAM (Soc. Ind. Appl. Math.) J. Numer. Anal. 17, 238–246 (1980). 10.1137/0717021 [DOI] [Google Scholar]
- Kahaner D., Moler C., and Nash S., Numerical Methods and Software (Prentice Hall, Englewood Cliffs, 1989). [Google Scholar]
- Tavares S. A., Generation of Multivariate Hermite Interpolating Polynomials (Chapman & Hall∕CRC, Boca Raton, 2006). [Google Scholar]
- Li Y. and Zagzebski J. A., “A frequency domain model for generating B-mode images with array transducers,” IEEE Trans. Ultrason. Ferroelectr. Freq. Control 46, 690–699 (1999). 10.1109/58.764855 [DOI] [PubMed] [Google Scholar]
- Chen H. and Varghese T., “Multi-level hybrid 2D strain imaging algorithm for ultrasound sector∕phased arrays,” Med. Phys. 36, 2098–2106 (2009). 10.1118/1.3121426 [DOI] [PMC free article] [PubMed] [Google Scholar]
- Chen H. and Varghese T., “Principal component analysis of shear strain effects,” Ultrasonics 49, 472–483 (2009). 10.1016/j.ultras.2008.12.003 [DOI] [PubMed] [Google Scholar]
- Insana M. F., Wagner R. F., Brown D. G., and Hall T. J., “Describing small-scale structure in random media using pulse-echo ultrasound,” J. Acoust. Soc. Am. 87, 179–192 (1990). 10.1121/1.399283 [DOI] [PMC free article] [PubMed] [Google Scholar]
- Clifford L., Fitzgerald P., and James D., “Non-Rayleigh first-order statistics of ultrasonic backscatter from normal myocardium,” Ultrasound Med. Biol. 19, 487–495 (1993). 10.1016/0301-5629(93)90124-7 [DOI] [PubMed] [Google Scholar]


