Abstract
Normal and malignant mammary epithelial cells were studied using laboratory measurements, wavelet analysis, and numerical simulations of monolayer cell cultures to determine whether microscopic breast cancer can be detected in vitro with high-frequency ultrasound. Pulse-echo waveforms were acquired by immersing a broadband, unfocused 50-MHz transducer in the growth media of cell culture well plates and collecting the first reflection from the well bottoms. The simulations included a multilayer pulse-reflection model and a model of two-dimensional arrays of spherical cells and nuclei. The results show that normal and malignant cells produce time-domain signals and spectral features that are significantly different.
Introduction
Failure to obtain negative (cancer-free) margins during breast conservation surgery results in additional surgery for 30%–50% of patients since positive margins strongly correlate with local relapse of the disease. Several approaches are therefore being investigated for the intra-operative detection of microscopic cancer in surgical margins. Since the majority of breast cancers result from malignant changes to epithelial cells, the ability to acoustically differentiate between normal and malignant breast epithelial cells is vital to the development of an intra-operative ultrasonic method for detecting microscopic breast cancer.
Numerical models of ultrasonic scattering in simulated three-dimensional (3D) breast tissues have indicated that high-frequency (hf) ultrasound from 15–75 MHz may be sensitive to malignant changes in breast cells and tissue microstructures.1, 2 The models used a multipole-based approach to simulate up to 2137 spherical, nucleated cells. Both nuclear pleomorphism of malignant cells in random cell simulations and the in-situ growth of lobular carcinoma in lobular tissue simulations produced statistically significant changes in the ultrasonic backscatter spectra that were distinct from those of benign processes such as hyperplasia.1 Models of other tumor growth patterns, such as the diffuse infiltration of malignant cells into tissue, showed that the spectral changes were specific to the type of growth pattern and histological changes.2
Experimental measurements have also shown that hf ultrasound is sensitive to cell and tissue histology associated with cancer. Ultrasonic spectra in the 10–25 MHz range have been used to differentiate between carcinomas and sarcomas in 1-cm diameter mouse mammary tumors via measurements from live animals, euthanized animals, and centrifuged cell cultures.3 Both packed (centrifuged) cells and dilute cell suspensions have additionally been studied with hf ultrasound to explore the basic scattering properties of normal and cancerous cells and to detect apoptosis in malignant cells in vitro.4, 5, 6, 7 The sensitivity of 40-MHz ultrasonic backscatter to apoptosis in malignant cells has also been demonstrated in rat tissues ex vivo and in vivo.8 This work was recently extended to study apoptosis in mouse tumors following photodynamic and radiation therapies.9, 10 Scanning acoustic microscopy in the 15–50 MHz region has been used as well to determine tumor size and margin status in 2–5 mm thick slices of ductal carcinoma tissue.11
The purpose of this study was to determine the fundamental differences in ultrasonic scattering between normal and malignant breast epithelial cells using in vitro cell culture methods. Normal and malignant breast epithelial cells were grown as cell monolayers, experimentally tested with hf ultrasound, and numerically simulated with both a multilayer pulse-reflection model and a cell-based scattering model. The measurements did not require sophisticated methods to enhance signal detection, and produced ultrasonic waveforms with reflections from the cell monolayers that showed significant correlations with cell layer growth. The results additionally displayed major differences between the normal and malignant cultures that exhibited both time- and frequency-domain characteristics consistent with the numerical models.
Methods
Cell lines used for the monolayer cultures were MCF-10A and MDA-MB-468 for the normal and malignant breast epithelial cells, respectively, and were purchased from American Type Culture Collection (Rockville, MD). The MCF-10A cell line was derived from human fibrocystic mammary tissue and exhibits characteristics of normal breast epithelium.12 The MDA-MB-468 cell line originated from a metastatic adenocarcinoma of epithelial cell type isolated from a pleural effusion.13 Both cells lines are ER and PR negative.
Cells were seeded in six-well cell culture plates (cell growth area=9.6 cm2∕well) at a density of3.32×104 cells∕cm2. Normal cells were cultured in DMEM:F-12 medium supplemented with horse serum (5% v∕v), epidermal growth factor (20 ng∕ml), cholera toxin (100 ng∕ml), hydrocortisone(0.5 μg∕ml), bovine insulin(10 μg∕ml), and penicillin-streptomycin (1% v∕v). Malignant cells were cultured in RPMI-1640 medium supplemented with fetal bovine serum (10% v∕v) and penicillin-streptomycin (1% v∕v). Cultures were grown in a humidified incubator maintained at 37 °C and 5% atmospheric CO2 concentration.
Three wells for the normal cell line and three wells for the malignant cell line were seeded each day at the same time over a 9-day period, providing a total of 54 wells. Six unseeded wells with only growth media were used as controls (Day 0). All wells were tested with ultrasound on Day 9. Following ultrasonic testing, the cells were detached from the wells using 0.5% trypsin-EDTA and counted using a hemacytometer to evaluate the cell growth. Cell and nucleus diameters were obtained by measuring the circularity and perimeters of cells and nuclei growing in culture without fixation.
Ultrasonic pulse-echo data were acquired using a UTEX UT340 high-frequency square-wave pulser receiver, an Olympus NDT V358-SU immersion transducer (50-MHz, 6.35-mm diameter), and a 500 MHz, 1 Gs∕s digital storage oscilloscope. Waveforms were obtained by immersing the transducer in the growth media of cell culture well plates and collecting the first reflection from the well bottoms. Pulse voltage, width, and repetition rate were 100 V, 10 ns, and 5 kHz, respectively. Signals were collected with a receiver gain of 20 dB and averaged in the data acquisition. Data were downloaded and stored on a notebook PC using LabVIEW.
Two numerical approaches were used to model the ultrasonic signals from the cell monolayers. The first method used a multilayer pulse-reflection model that simulated the cell monolayer as a flat, homogeneous layer lying between the growth media and polystyrene well bottom. The ultrasonic pulse was modeled in the frequency domain using the frequency-dependent reflection coefficients and transducer response function. The waveform function was then obtained from an inverse Fourier transform. The second method used a multipole approach to model the cell monolayers as two-dimensional (2D) arrays of spherical cells containing spherical nuclei.2 Multipole expansions and boundary conditions were used to solve for the acoustic scattering from each cell. The backscattered wave fields were then averaged over a simulated transducer face to predict the resulting ultrasonic signals.
Results
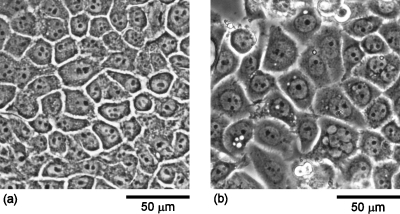
Figures 1a, 1b display phase-contrast micrographs of normal MCF-10A and malignant MDA-MB-468 breast epithelial cells, respectively, grown to confluence. Comparison of the micrographs indicates that the malignant cells exhibit larger cell and nucleus sizes as compared to the normal cells. Quantitative measurements of the cell and nucleus sizes revealed that the malignant cells displayed approximately 50% larger cell diameters and 30% larger nucleus diameters than the normal cells. The cell and nucleus diameters for the normal cells were 21.6±6.9 and11.4±2.0 μm, respectively. In contrast, the cell and nucleus diameters for the malignant cells were 32.6±10.3 and15.0±2.2 μm, respectively.
Figure 1.
Phase-contrast micrographs of (a) normal MCF-10A and (b) malignant MDA-MB-468 breast epithelial cells grown to confluence, showing the larger cell and nucleus sizes of the malignant versus normal cells.
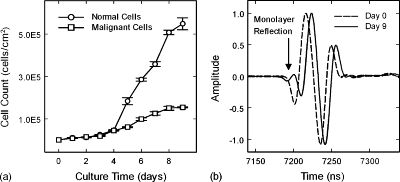
Figure 2a shows the cell growth curves for the normal and malignant cells. Both cell lines grew slowly during the lag phase of the growth curve and followed the same trend until Day 4. After Day 4 the growth curves entered the more rapidly growing log phase. The normal cells, however, displayed a significantly higher growth rate than the malignant cells. The normal cell cultures reached confluence by Day 6, whereas the malignant cell cultures achieved confluence by Day 9.
Figure 2.
(a) Cell growth curves for normal and malignant breast epithelial cells in monolayer cultures grown in vitro. (b) Comparison of ultrasonic waveforms from Day 0 (dashed) and Day 9 (solid) of a monolayer culture of normal cells. Cell layer reflection occurs at approximately 7200 ns on Day 9 waveform (arrow). Waveforms are offset in time for clarity.
Figure 2b displays ultrasonic waveforms from a culture well at Day 0 and Day 9 of normal cell monolayer growth. The waveform for Day 0 represents the ultrasonic reflection between the growth media and the polystyrene surface of the well with no monolayer present. The waveform for Day 9, however, displays a distinct wave structure in front of the well reflection, with an initial valley and then a peak. This additional reflection feature can be attributed to the normal epithelial cell monolayer. The malignant cell monolayers also produced ultrasonic reflection features at the beginning of the well reflection. However, the malignant cell monolayer reflections produced only an initial peak directly before the first valley of the well reflection, and were additionally an order of magnitude smaller than the normal cell monolayer reflections.
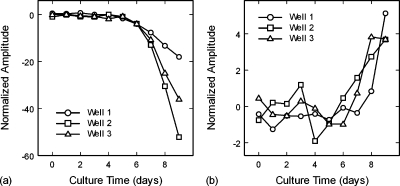
Figures 3a, 3b show the growth of the initial waveform valley for the normal cell monolayers and initial peak for the malignant cell monolayers, respectively. Both the normal cell valley and malignant cell peak significantly increased in amplitude after Day 5, indicating good correlations to the cell growth curves of Fig. 1a. The coefficients of linear correlation between the ultrasonic amplitudes, averaged over the three wells, and their respective cell growth curves were r=−0.90 and r=0.76 for the normal and malignant cell monolayers, respectively. The amplitude curves for the normal cells show a smooth trend for each well, but diverge significantly from well to well with culture time [Fig. 3a]. In contrast, the trends for the malignant cells are not smooth and show greater day-to-day variations for each well [Fig. 3b]. However, the malignant cell trends do not diverge as strongly with culture time.
Figure 3.
(a) Amplitudes of the first wave reflections from the normal cell monolayers, showing the increase in amplitude of the waveform valley with time. (b) Amplitudes of the first wave reflections from the malignant cell monolayers, showing the increase in amplitude of the waveform peak with time.
Note that the amplitudes between the normal and malignant cells are deceiving when compared as a function of culture time. As a function of cell count(cells∕cm2), the amplitudes are approximately equal up to the point of confluence. Based on the standard deviations for the amplitudes as a function of cell count, it is estimated that a minimum percentage of malignant cells that would be detectable in a mixture of normal and malignant cells would be 50%. This minimum detection level is based on time-domain signals only, and does not take into account spectral differences that may also be used to differentiate malignant from normal cells.
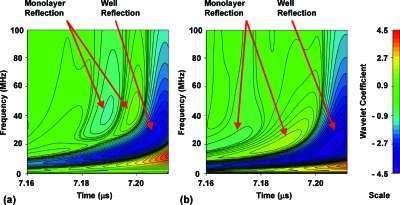
Analysis of the waveforms with the pulse-reflection model indicated that the confluent cell layers did not behave as a uniformly reflecting layer but rather as a collection of individual scatterers. The reflections from the normal cell monolayers were of a significantly higher frequency than the well surface reflection, and could not be modeled as arising from a layer with typical homogeneous properties. A wavelet analysis of the waveforms indicated that the primary frequency component of the well reflection was 23 MHz, but that the principal frequencies for the normal and malignant cell layer reflections were 40 MHz [Fig. 4a] and 20 MHz [Fig. 4b], respectively. The higher frequency of the normal cell layer reflections, and the difference in frequencies between normal and malignant cell layers, indicated that the scattering had a frequency dependence that was a strong function of cell structure and∕or properties. The wavelet analysis also showed that the malignant cell layer reflections contained a very weak valley preceding the initial peak that was not detectable in the time-domain waveforms [Fig. 4b].
Figure 4.
Wavelet analysis of (a) Day 9 of normal culture well, and (b) Day 9 of malignant culture well. The wavelet analysis highlights the differences in frequency content between the reflections of the normal cell monolayer and the malignant cell monolayer.
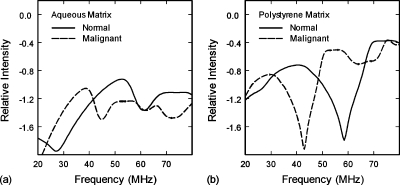
Multipole simulations were performed to verify that changes in cell structure such as size could produce the observed frequency pattern. Both normal and malignant cells were given the same acoustic properties.2 Matrix properties were those of the growth media (water at37 °C). The modeled diameters of the normal and malignant cells were 22 and30 μm, respectively. The diameters of the normal and malignant cell nuclei were 11 and15 μm, respectively.
The simulation results, Fig. 5a, were qualitatively consistent with the wavelet results. The primary spectral peak for the normal cell monolayers was shifted 14 MHz higher in frequency as compared to the malignant cell monolayers due to the smaller size of the normal cells. The simulated spectra, however, produced peak frequencies that were 1.3–1.9 times higher than those observed in the wavelet results. These differences may be attributable to inaccurate estimates for the cell stiffness properties, the flattening of spherical cells in monolayer cultures, or multiple-scattering interactions with the well surface. Since roughly half of the cell’s surface is attached to the well, the effects of the well surface were estimated by replacing the properties of the matrix (growth media) with those of polystyrene. The resulting spectra, Fig. 5b, showed a downward shift in the primary spectral peaks from 53 to 40 MHz for the normal cells and from 39 to 31 MHz for the malignant cells. Additional simulations revealed that the spectra were also sensitive to the shear properties of the cytoplasm.
Figure 5.
(a) Computed ultrasonic backscatter spectra of normal and malignant cell monolayers in aqueous growth media. The peaks for malignant cells display a shift to lower frequencies due to their greater cell and nucleus size. (b) Computed ultrasonic backscatter spectra of normal and malignant cell monolayers in a polystyrene matrix to estimate the effects of the well surface on cell scattering.
The experimental results demonstrate that hf ultrasonic measurements can be used to detect cell monolayers and monitor their growth in vitro. Furthermore, the results show that hf ultrasound combined with wavelet analysis and numerical simulation can discriminate between normal and malignant breast epithelial cells. The multipole simulations predicted spectral shifts between normal and malignant cell scattering that qualitatively agreed with the wavelet analysis. A first-order approximation to account for the effects of the well surface also provided good quantitative agreement for the peak frequency of the normal cell monolayer.
These results are an initial step in developing a rapid, non-imaging method that differentiates between normal and malignant breast epithelial cells in tissues. Such a method would be valuable to breast cancer surgeons for determining margin status intra-operatively. The current research is limited, however, by the 2D nature of monolayer cultures versus the 3D structures of centrifuged cell packings, ex vivo tissue specimens, and in vivo tissues. Further research on 3D cell and tissue systems is therefore required to better understand the effects of cell packing, tissue structure, and multiple scattering on ultrasonic propagation and backscatter.1, 2
Improvements to the simulations, such as incorporating interactions between the spherical cells and the planar well surface, or the effects of cell flattening on the well surface, may provide more accurate predictions for the ultrasonic responses of the monolayers.14 Work is currently in progress to model flattening effects in nucleated cells by using oblate spheroidal wave functions incorporated into the multipole approach.
Conclusions
As a first step to developing an ultrasonic method for detecting microscopic breast cancer in vivo, normal and malignant breast epithelial cells were grown in monolayer cultures in vitro, experimentally tested with hf ultrasound, and numerically simulated with both a multilayer pulse-reflection model and a multipole-based cell scattering model. The experimental technique provides a nondestructive method for detecting and monitoring monolayer growth in cell cultures that may prove useful in many areas of bioscience research. Furthermore, the results demonstrate that normal and malignant epithelial cells can be distinguished by isolating and identifying their spectral signatures with the use of wavelet analysis and numerical simulation.
Acknowledgment
This work was supported by NIH Grant No. 5R21CA131798-02.
References and links
- Doyle T. E., Warnick K. H., and Carruth B. L., “Histology-based simulations for the ultrasonic detection of microscopic cancer in vivo,” J. Acoust. Soc. Am. 122, EL210–EL216 (2007). 10.1121/1.2800894 [DOI] [PubMed] [Google Scholar]
- Doyle T. E., Tew A. T., Warnick K. H., and Carruth B. L., “Simulation of elastic wave scattering in cells and tissues at the microscopic level,” J. Acoust. Soc. Am. 125, 1751–1767 (2009). 10.1121/1.3075569 [DOI] [PubMed] [Google Scholar]
- Oelze M. L. and Zachary J. F., “Examination of cancer in mouse models using high-frequency quantitative ultrasound,” Ultrasound Med. Biol. 32, 1639–1648 (2006). 10.1016/j.ultrasmedbio.2006.05.006 [DOI] [PubMed] [Google Scholar]
- Baddour R. E., Sherar M. D., Hunt J. W., Czarnota G. J., and Kolios M. C., “High-frequency ultrasound scattering from microspheres and single cells,” J. Acoust. Soc. Am. 117, 934–943 (2005). 10.1121/1.1830668 [DOI] [PubMed] [Google Scholar]
- Baddour R. E. and Kolios M. C., “The fluid and elastic nature of nucleated cells: Implications from the cellular backscatter response,” J. Acoust. Soc. Am. 121, EL16–EL22 (2007). 10.1121/1.2401224 [DOI] [PubMed] [Google Scholar]
- Taggart L. R., Baddour R. E., Giles A., Czarnota G. J., and Kolios M. C., “Ultrasonic characterization of whole cells and isolated nuclei,” Ultrasound Med. Biol. 33, 389–401 (2007). 10.1016/j.ultrasmedbio.2006.07.037 [DOI] [PubMed] [Google Scholar]
- Brand S., Solanki B., Foster D. B., Czarnota G. J., and Kolios M. C., “Monitoring of cell death in epithelial cells using high frequency ultrasound spectroscopy,” Ultrasound Med. Biol. 35, 482–493 (2009). 10.1016/j.ultrasmedbio.2008.09.014 [DOI] [PubMed] [Google Scholar]
- Czarnota G. J., Kolios M. C., Abraham J., Portnoy M., Ottensmeyer F. P., Hunt J. W., and Sherar M. D., “Ultrasound imaging of apoptosis: High-resolution non-invasive monitoring of programmed cell death in vitro, in situ, and in vivo,” Br. J. Cancer 81, 520–527 (1999). 10.1038/sj.bjc.6690724 [DOI] [PMC free article] [PubMed] [Google Scholar]
- Banihashemi R., Vlad R., Debeljevic B., Giles A., Kolios M. C., and Czarnota G. J., “Ultrasound imaging of apoptosis in tumor response: Novel preclinical monitoring of photodynamic therapy effects,” Cancer Res. 68, 8590–8596 (2008). 10.1158/0008-5472.CAN-08-0006 [DOI] [PubMed] [Google Scholar]
- Vlad R. M., Kolios M. C., Moseley J. L., Czarnota G. J., and Brock K. K., “Evaluating the extent of cell death in 3D high frequency ultrasound by registration with whole-mount tumor histopathology,” Med. Phys. 37, 4288–4297 (2010). 10.1118/1.3459020 [DOI] [PubMed] [Google Scholar]
- Bruno I., Kumon R. E., Heartwell B., Maeva E., and Maev R. Gr., “Ex vivo breast tissue imaging and characterization using acoustic microscopy,” in Acoustical Imaging, edited by André M. P. (Springer, Dordrecht, 2007), Vol. 28, pp. 279–287. 10.1007/1-4020-5721-0_29 [DOI] [Google Scholar]
- Soule H. D., Maloney T. M., Wolman S. R., W. D.Peterson, Jr., Brenz R., McGrath C. M., Russo J., Pauley R. J., Jones R. F., and Brooks S. C., “Isolation and characterization of a spontaneously immortalized human breast epithelial cell line, MCF-10,” Cancer Res. 50, 6075–6086 (1990). [PubMed] [Google Scholar]
- Cailleau R., Olivé M., and Cruciger Q. V. J., “Long-term human breast carcinoma cell lines of metastatic origin: Preliminary characterization,” In Vitro 14, 911–915 (1978). 10.1007/BF02616120 [DOI] [PubMed] [Google Scholar]
- Gaunaurd G. C. and Huang H., “Acoustic scattering by a spherical body near a plane boundary,” J. Acoust. Soc. Am. 96, 2526–2536 (1994). 10.1121/1.410126 [DOI] [Google Scholar]


