

Abstract
It is becoming increasingly common to use gold nanoparticles (AuNPs) protected by a heterogeneous mixture of thiolate ligands, but many ligand mixtures on AuNPs cannot be properly characterized due to the inherent limitations of commonly used spectroscopic techniques. Using ion mobility-mass spectrometry (IM-MS), we have developed a strategy which allows measurement of the relative quantity of ligands on AuNP surfaces. This strategy is used for the characterization of three samples of mixed-ligand AuNPs: tiopronin:glutathione (avg. diam. 2.5 nm), octanethiol:decanethiol (avg. diam. 3.6 nm), and tiopronin:11-mercaptoundecyl(poly ethylene glycol) (avg. diam. 2.5 nm). For validation purposes, the results obtained for tiopronin:glutathione AuNPs were compared to parallel measurements using nuclear magnetic resonance (NMR) spectroscopy and mass spectrometry (MS) without ion mobility separation. Relative quantitation measurements for NMR and IM-MS were in excellent agreement, with an average difference of less than 1% relative abundance. IM-MS and MS without ion mobility separation were not comparable, due to a lack of ion signals for MS. The other two mixed-ligand AuNPs provide examples of measurements which cannot be performed using NMR spectroscopy.
Introduction
Monolayer-protected gold nanoparticles (AuNPs) have become important scaffolds for many applications, ranging from mimetics,1 imaging,2 and sensing3 to molecular electronics.4 These nanoparticles are distinct from “bare” AuNP colloids, since these AuNPs are protected by a monolayer of gold-thiolate complexes rather than being stabilized by relatively weak electrostatic interactions with organic molecules. The gold atoms within the core are distinct from the gold atoms of the protecting monolayer, with thiolate ligands covalently bonded to the gold atoms in the monolayer.5, 6 Original ligands in the protecting gold-thiolate monolayer can be exchanged for different ligands to generate multifunctional AuNP surfaces.7 The inclusion of multiple functionalities within the same monolayer is becoming increasingly important for AuNP applications.
The most common route to mixed-monolayer AuNPs involves synthesizing monolayer-protected AuNPs with a given ligand X, followed by a ligand exchange reaction in which an alternate ligand Y is added. In the simplest cases, ligand X is chosen for reproducible syntheses and nanoparticle solubility, while ligand Y bears a functionality chosen specifically for the desired application. For example, peptides,7 glycans,8 and DNA9 give specific biological functionality, poly(ethylene glycol) has been used for solubility modification,10 and ligands with conjugated functionality yield enhanced conductivity.11 The rate, extent of exchange, and even the placement of exchanged ligands on the AuNP surface12 can be controlled through a number of experimental parameters: exchange time, choice of initial and alternate ligands, AuNP and ligand concentrations,13 temperature, and AuNP oxidation state.14 Other modification routes for monolayer-protected AuNPs involve ligand coupling reactions, such as those involving amide bond formation.7
Efficient analytical characterization strategies are a necessary counterpoint to these advanced synthetic and modification techniques,15 providing experimental feedback for protocol fine-tuning and ensuring that the final AuNP product is ready for use. Unfortunately, the rapid development of synthesis and modification methodologies has highlighted the weaknesses of current characterization strategies. Most of these methods, such as high-performance liquid chromatography (HPLC), infrared (IR) spectroscopy, and nuclear magnetic resonance (NMR) spectroscopy, measure based on ligand functionalities. This dependency makes each of these techniques impracticable for ligand mixtures which do not have extremely different functionalities. Furthermore, in the case of HPLC and IR, resolution and sensitivity limit the relative quantitation to rough estimates.16, 17
Among these three, NMR has the most quantitative capacity, and therefore is the dominant technique in the characterization of mixed-ligand AuNPs. After identifying at least one fully-resolved and ligand-specific peak for each ligand in the mixture, the relative peak areas can be compared to obtain the relative quantity of each ligand.18 However, in some cases, peak assignment can be complicated by interactions between the ligand and the gold core.19 Specifically, characteristic peaks for an unbound ligand become shifted, broadened, and in some cases split when the same peak is bound to an AuNP.20–22 The shifting and splitting of peaks increases the potential for erroneous assignments. The broadening of peaks leads to increased signal convolution, especially for large, complex, or structurally similar ligands. One way to enhance the deconvolution of the peaks is to oxidize the monolayer-protected AuNPs by the addition of iodine, which results in dissociation of all ligands as disulfide species. However, peak convolution still remains for many ligand combinations, and the proton signals closest to the disulfide linkage will be shifted yet again. Thus even under optimal conditions for NMR measurements – dissociative oxidation and ligands with sufficiently unique functionalities – precise quantitation can be difficult.
One alternative strategy to NMR for the analysis of mixed monolayer-protected AuNPs is mass spectrometry (MS). Two different approaches have been reported: the ionization of thiols and disulfides dissociated from the AuNP surface,23–25 and the ionization of intact AuNPs.13, 26–29 The ionization of thiols and disulfides from AuNPs follows on a large body of work using LDI to study self-assembled monolayers on two-dimensional gold surfaces.30 This appears to be an effective method to identify the presence of an AuNP bearing a given thiol by observing certain “mass barcodes,” 23 but this strategy is only semi-quantitative.25 Moreover, the presence of any residual disulfides from AuNP synthesis or modification can bias quantitative measurement of the bound ligands. The low mass of these molecules places the signal in an inherently noisy portion of the mass spectrum and effectively prohibits any potential use of an assisting matrix. This matrix, while not necessary for these analyses, provide a softer ionization technique with greater sensitivity and less ligand fragmentation, which is prone to take place at the carbon-sulfur bond of the thiol.31
The MS analysis of intact AuNP ions is a powerful method for the absolute quantitation of ligands on the AuNP surface, with the ability to simultaneously analyze the ligands and the core without population averaging. Each distinct population of AuNPs with different amounts of ligand exchange (e.g., Aun(SR)x(SR′)y, Aun(SR)x+1(SR′)y-1…) can be observed and quantified directly, enabling the measurement of exchange dispersity.13 Unfortunately, this strategy is predicated upon the ability to obtain intact, unfragmented AuNP ions. This is a severe limitation, since the ionization of intact AuNPs has only been accomplished for small (<1.7 nm core diameter) monolayer-protected clusters (MPCs).31 Water-soluble AuNPs are particularly prone to fragmentation, perhaps due to increased Coulombic forces. Because of these problems, mass spectrometric analysis of intact AuNPs is not currently a viable strategy for the characterization of the larger AuNPs (> 1.7 nm) which are used in many applications, particularly those which are water-soluble.
In this report we describe the use of structural separations by ion mobility-mass spectrometry (IM-MS) for the relative quantitation of ligands on AuNPs, a rapid and facile strategy for the characterization of mixed-ligand AuNPs. As with other MS-based methods, each ion has a unique mass depending on the number and identities of the thiolate ligands within the ion. However, there are distinct advantages of our strategy over NMR and other MS quantitation strategies. With regards to NMR spectroscopy, this method is not limited to ligand mixtures with different functionalities, since measurements are based on ligand mass. This strategy is therefore useful for a wide range of hydrophobic and hydrophilic ligand mixtures, from peptides and poly(ethylene glycol) to small molecules. Compared to MS techniques, the addition of IM separation appears to have two beneficial effects. The first, the separation of gold-thiolate ions from organic ions confirms the identities of observed ligands as being bound to the AuNP surface, enhancing the signal-to-noise ratio and eliminating quantitative measurement bias from free thiols or disulfides.32 The second is an apparent preservation of diverse gold-thiolate ions from disintegration, perhaps through greater collisional cooling of the gold-thiolate ions.33 Since gold-thiolate ions are generated from small MPCs and larger AuNPs (>1.7 nm) alike,32 this quantitation strategy is useful for the characterization of AuNPs which cannot be ionized intact for MS analysis.
Experimental Section
Reagents
Methanol (Fisher, 99.9%), ethanol (Optima, Fisher), acetone (>99.5%, Sigma-Aldrich), acetonitrile (>99.5%, Sigma-Aldrich), toluene (HPLC grade, Fisher), chloroform (≥99.8%, Sigma-Aldrich), acetic acid (glacial, Fisher), L-glutathione (reduced, Sigma-Aldrich, 99%), N-(2-mercaptopropionyl)glycine (tiopronin, Sigma-Aldrich), glacial acetic acid (certified ACS, Fisher), sodium chloride (certified ACS, Fisher), sodium borohydride (98+%, Acros), tetraoctylammonium bromide (TOABr, Fluka), octanethiol (98.5+%, Aldrich), decanethiol (96%, Aldrich), 11-mercaptoundecylpoly(ethylene glycol) (MUPEG, Sigma-Aldrich), trans-2-[3-(4-tert-butyl-phenyl)-2-methyl-2-propenylidene]malononitrile (DCTB, Fluka), 2 nm “bare” AuNPs (nanoComposix), and α-cyano-4-hydroxycinnamic acid (CHCA, Sigma-Aldrich) were used as received.
Tiopronin AuNP Synthesis.34
Tetrachloroauric acid (HAuCl4•3H2O) was combined with three equivalents of tiopronin in 85:15 MeOH:acetic acid at 0 °C. The solution was stirred for 3 hours, after which sodium borohydride was added in a 10:1 NaBH4:Au molar ratio. The nanoparticles were dialyzed for 3 days until observed to be clean by NMR spectroscopy, that is, free of any narrow peaks indicative of unbound tiopronin or other organic molecules.
Octanethiol AuNP Synthesis.35
Tetrachloroauric acid (HAuCl4•3H2O) was dissolved in deionized water and combined with a slight molar excess of TOABr in toluene. Once the gold was completely transferred to the organic layer (evidenced by a red organic layer and clear aqueous layer), the aqueous layer was removed and three equivalents of octanethiol were added. After the solution became clear, 10 equivalents of NaBH4 were dissolved in cold deionized water and added to the solution. The generated nanoparticles were precipitated in methanol. The methanol was filtered off, and the product was washed three times each with water, ethanol, and acetone, followed by sonication in acetonitrile.
Ligand Exchange
For mixed tiopronin:glutathione monolayer-protected AuNPs (Tio:GS AuNPs), unexchanged Tio AuNPs were combined with glutathione in deionized water or borate buffer, depending on the solubility of the product. For tiopronin:11-mercaptoundecylpoly(ethylene glycol) (Tio:MUPEG) AuNPs, unexchanged Tio AuNPs were combined with MUPEG in deionized water. Octanethiol (OT) AuNPs were combined with decanethiol in chloroform. For each experiment, the time scale of the ligand exchange and the concentrations of the AuNPs and alternate ligand were varied in order to produce AuNPs with a wide range of ligand:ligand ratios (Table S2).
Characterization
Transmission electron microscopy (TEM) images were obtained on a Phillips CM20 electron microscope. Thermal gravimetric analysis (TGA) was performed on an ISI TGA 1000 (Instrument Specialists Inc., Twin Lakes, WI). UV-Vis spectra were obtained on a Cary 100 Bio UV-Vis spectrophotometer in the range of 350–700 nm. Four samples of Tio:GS AuNPs were analyzed on an Applied Biosystems Voyager DE-STR with equipped a nitrogen laser (337 nm). Average molecular formulas were calculated as described elsewhere.34 Briefly, the number of gold atoms per AuNP is calculated from the average diameter as measured by TEM, and the number of ligands is calculated from the percent mass lost measured by TGA.
Quantitative NMR Analysis
Tio:GS AuNPs were dissolved in D2O and analyzed on a 400 MHz Bruker NMR, collecting at least 40 scans with a d1 delay of 1.5 seconds. A double WATERGATE pulse program was used for water suppression. The amount of tiopronin and glutathione present on the nanoparticles was measured by comparing deconvoluted peak areas (Figure S4).
Sample Preparation and IM-MS Analysis
Eight samples of Tio:GS AuNPs with different degrees of ligand exchange were obtained. A saturated sample of each in 10 μL deionized H2O was combined with 100 μL of saturated CHCA and 1% NaCl in MeOH or an H2O:MeOH mixture, depending on AuNP solubility. Six of these samples were soluble in these solutions, and were independently prepared and analyzed in duplicate to estimate preparation and instrumental variability. The remaining two samples, those with the highest glutathione abundance, were poorly soluble together with the matrix, and were thus prepared and spotted as slurries. A 1 μL portion of each was deposited on a stainless steel plate using the dried droplet method,36 with sonication immediately prior for the poorly soluble samples. Tio:MUPEG AuNPs were prepared in the same manner.
For OT:DT AuNPs, the sample was dissolved in acetone and combined with DCTB matrix in an approximately 400:1 matrix/analyte ratio. All MALDI-IM-MS analyses were performed using a Synapt HDMS (Waters Corp., Manchester, UK), equipped with a frequency-tripled Nd:YAG (355 nm) laser operated at a pulse repetition frequency of 200 Hz. All spectra were acquired in the positive ion mode at laser energy settings approximately 10% above threshold values.
Peak Identification and Assignment
Gold-containing ion signals were extracted and identified using the MassLynx 4.1 (Waters Corp.) software package. Processed spectra were exported to Microsoft Excel, in which a custom spreadsheet was constructed for the remainder of the data processing. A template of this spreadsheet is available in Supporting Information. Each spectrum was compared to a list of possible m/z values constructed from expected gold-thiolate peaks. This list contained monoisotopic ions following the three stoichiometries identified previously, namely: Aux+1Lx, AuxLx, and AuxLx+1.32 Within these stoichiometries, an appropriate list of permutations was constructed with every possible combination of ligands and modifications such as sodium coordination and methyl esterification. Protons were added or subtracted as necessary to achieve a +1 charge state. Each processed spectra was filtered by abundance, with any signal below 1% relative abundance with respect to the base peak discarded in order to reduce false positive identification. The remaining peaks were compared to the expected gold-thiolate ion list. Any observed peak within 30 ppm mass accuracy of an expected peak were matched and used for quantitation.
As with any automatic peak matching strategy, there can be some erroneous assignments for samples which are more complex, such as those with more diverse ligand mixtures, multiple alkali metals, or more possible modifications. As such, making the expected peak list as parsimonious as possible reduces false positive identifications. For AuNPs with hydrophobic ligands, the gold-thiolate complexes can undergo apparent electron loss rather than proton or sodium coordination leading to ionization, yielding radical cationic species. Thus it is useful to check the results of the matching against the original IM-MS spectrum when first attempting to quantify the ligands. The number of gold atoms in any given ion can be rapidly assessed,32 providing a simple method to check the accuracy of most assignments. Once any necessary adjustments have been made to the expected gold-thiolate ion list, subsequent analyses can generally be performed in a few minutes.
Data Processing for Quantitation
Since the expected peak list was generated with monoisotopic ions, matched peaks were normalized to the expected monoisotopic abundance for each respective ion. This method was chosen since isotopic resolution was achieved throughout each spectrum, and for more complex samples the isotopic patterns were regularly convoluted by multiple peaks within several m/z units of each other. After this normalization, Eqn. 1 was used:
For a nanoparticle with a binary ligand mixture, X and Y, the term on the left denotes the mole fraction of ligand X on the entire nanoparticle. On the right, the numerator is the sum of the multiples of the ion count (CX,Y) and the number of X ligands present in each respective peak. The denominator is the sum of the multiples of the ion count (CX,Y) and the total number of ligands (X+Y) present in each respective peak. Together, these represent a mole fraction of the ligand X present on the nanoparticles. For example, if only two ions are observed corresponding to Au4X1Y3 and Au4X2Y2 species, having an ion count of 200 and 300, respectively:
The calculated overall percent coverage of ligand X would be 40%. In the spreadsheet, this was performed by calculating the sum of the numerator and denominator of the fraction separately, then dividing to obtain the final percent coverage. A sample spreadsheet is available in the Supporting Information.
Results and Discussion
Nanoparticles with tiopronin (Tio) and octanethiol (OT) protecting ligands were synthesized and characterized by TEM (Figure S1), UV-Vis (Figure S2), and TGA (Figure S3) in addition to IM-MS as described here. Tio AuNPs had an average core diameter of 2.5 ± 0.6 nm and a calculated average molecular composition of Au482Tio318. OT AuNPs had an average core diameter of 3.6 ± 1.5 nm and a calculated average molecular composition of Au1440(SC8H17)798. Six samples of mixed octanethiol:decanethiol (OT:DT) AuNPs with various OT:DT coverage ratios were characterized, in addition to unexchanged OT AuNPs (Table 1). This set of ligands was chosen for two reasons. The first is to illustrate the effect of varying ligand ratios on the mass spectrum of the gold-thiolate ions. The second is to demonstrate the use of IM-MS for a sample in which NMR cannot effectively distinguish between the two ligands. In such cases, NMR cannot be used for quantitation measurements.
Table 1.
Table of all mixed monolayer-protected AuNPs characterized for this report and the ligand composition of each as measured by NMR or MALDI-IM-MS. For all IM-MS measurements, relative ligand abundances were measured using all observed gold-thiolate ions. The structures of tiopronin and glutathione are shown in the bottom portion.
| Octanethiol (OT): Decanethiol (DT) | Tiopronin (Tio): Glutathione (GS) | Tiopronin (Tio): (MUPEG) | |||
|---|---|---|---|---|---|
| IM-MS | IM-MS | NMR | IM-MS | ||
| 100:0 | 99:1 | 100:0 | 100:0 | ||
| 78:22 | 86:14 | 85:15 | 86:14 | ||
| 53:47 | 83:17 | 83:17 | 60:40 | ||
| 42:58 | 78:22 | 79:21 | 33:67 | ||
| 38:62 | 56:44 | 54:46 | |||
| 28:72 | 56:44 | 53:47 | |||
| 16:84 | 46:54 | 44:56 | |||
| 10:90 | 12:88 | ||||
| 4:96 | 5:95 | ||||
| Tiopronin (Tio) | 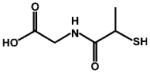 |
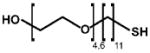 |
11-Mercapto-Undecyl-PEG (MUPEG) | ||
| Glutathione (GS) | |||||
Figure 1A presents a typical two-dimensional IM-MS plot, generated from 38:62 OT:DT AuNPs. As described in our previous report,32 the two dimensions of ion drift time (ordinate axis) and m/z (abscissa) roughly form a density plot, in which large, lighter ions appear higher and to the left, while smaller, heavier ions appear lower and to the right. Because of the high mass and relatively low cross-section of gold atoms, gold-thiolate ions appear in a high-density portion of the two-dimensional plot, separate from the lower-density organic ions. In the mass range investigated here, the organic ions visible in Figure 1A have not been identified, but the regular spacing of the ions suggests that the ions are large clusters of free ligands, disulfides, and/or matrix molecules which have undergone fragmentation or rearrangement processes. The number of possible permutations for these ions is indicated by the continuous nature of the organic ion signal in Figure 1A, in which very few ions stand out. The separation of gold-thiolate ions from these organic ions, which can be termed chemical noise, markedly increases the signal-to-noise ratio for the extracted gold-thiolate mass spectra.32 This separation of gold-thiolate ions from organic contaminants is particularly significant for the routine characterization of AuNPs, since it virtually eliminates interference due to matrix, residual reagents, or modification materials. Thus extensive sample purification is not required as it is for other characterization methods.
Figure 1.

Two-dimensional ion mobility-mass spectrum (panel A) of 38:62 OT:DT AuNPs, revealing the separation of gold-thiolate ion signal from organic chemical noise. Panel B shows a portion of the extracted mass spectra, highlighting the Au4L4 stoichiometry, for four AuNP samples with varying OT:DT ligand coverage. The five peaks, corresponding to different numbers of OT and DT (x), roughly form a binomial distribution which reflects the overall coverage of OT and DT on the AuNP.
The most abundant gold-thiolate ions in Figure 1A are species with the Au4L4 stoichiometry, as seen in previous MALDI and ESI analyses of low-mass AuNP fragments.28, 32, 37, 38 These ions are shown after extraction in Figure 1B. The lowest mass spectrum in Figure 1B is that of unexchanged OT AuNPs, and those above represent AuNPs with higher DT abundance (shown along the ordinate axis). The transition from homogeneous to heterogeneous ligand mixtures can be observed in the emergence of serial, uniformly spaced peaks within the Au4L4 stoichiometry, reflecting the five permutations of OT:DT mixtures in the four ligands of the ion. The increased amount of DT leads to the emergence of higher-mass peaks with increased numbers of DT ligands indicated across the top of the panel. The abundance of each peak varies with the overall abundance of OT and DT on the AuNP surface, forming a distribution which roughly follows the binomial model in a similar fashion to that found in intact AuNP ions by Murray and coworkers.13
A second experiment using tiopronin:glutathione (Tio:GS) AuNPs allows for experimental validation with a more complex, and therefore potentially more error-prone sample. Since tiopronin and glutathione can be easily distinguished in an NMR without iodine-induced ligand dissociation, the same sample can be characterized by NMR and MALDI-IM-MS. In this case, the many permutations of possible ion modifications, namely cation coordination and esterification,32 make the spectra much more complex than that shown in Figure 1. Eight samples of Tio:GS AuNPs were characterized in addition to unexchanged Tio AuNPs (Table 1). The results from the analysis of 56:44 Tio:GS AuNPs are shown in Figure 2. The upper portion is the mass spectrum of the extracted gold-thiolate ion region after software processing as described in the experimental section. The mass spectrum is shown after this processing in order to clearly differentiate between ions used in the quantitation calculations (black) and those which are not (red). Even in a relatively complex mass spectrum, a large majority of the ion signals can be identified. Many of the ions which were not considered were products of C-S thiolate bond cleavage, thereby being rendered unusable in quantitation calculations.
Figure 2.

Ion mobility-mass spectrum of 56:44 Tio:GS AuNPs, and a mass spectrum showing the peaks from the extracted gold-containing region (above). Black peaks represent ions which were used for the quantitative calculations, red peaks were disregarded. The Au4L4 ions with different numbers of tiopronin and glutathione (x) are indicated by brackets.
By using the calculations detailed in the experimental section, the spectrum for each Tio:GS AuNP was used to calculate the Tio:GS ratio in the protecting monolayer. Each spectrum was processed identically by comparing the extracted and calibrated mass spectrum to a peak list generated from all expected gold-thiolate ions. The tiopronin AuNP sample served as a control, since any peaks which were identified as containing glutathione would be erroneous. This allows for a rough estimate of error estimated in the abundance ratios that are obtained due to false identifications, in this case 1.4%. A parallel NMR experiment was performed using the same samples, by measuring the integrated intensity of peaks corresponding to tiopronin and glutathione in the 1H NMR spectrum (Figure S4).
Two methods were used to compare the NMR and MALDI-IM-MS measurements. In the first (Figure 3A), a regression plot measures the amount of correlation between the two strategies. The closeness of the regression to a line of equality (slope of 1, intercept of 0) is remarkable. The second and more useful method is a Bland-Altman plot,39 which is used to compare a new measurement strategy against an existing standard. As one might expect from the regression plot, the average difference between NMR and IM-MS measurement is less than 1% in terms of glutathione abundance. The limits of agreement for the two techniques are −3.0 to 3.5% molar percentage. The good agreement between these two techniques is particularly striking since the two quantitation strategies focus on different physical properties: proton magnetic moment and angular momentum for NMR, and the abundance of fragmented and ionized gold-thiolate complexes for MALDI-IM-MS.
Figure 3.

Two plots comparing NMR and MALDI-IM-MS measurements of Tio:GS ratios, expressed as a molar percentage of glutathione. Panel A is a simple regression plot comparing IM-MS results (ordinate) to those obtained by NMR spectroscopy (abscissa). The measurements are closely correlated regression is near the line of equality (slope of 1, intercept of 0), the dashed lines indicate the 98% confidence interval. Error bars represent ±1σ (n = 2). Panel B is a Bland-Altman plot showing the difference between the IM-MS and NMR measurements (ordinate) for each sample against the average between the two measurements (abscissa). The average difference between the two measurements and their limits of agreement (± 1.96σ) are shown as lines.
The ions with Au4L4 stoichiometry were the most abundant for all the AuNPs characterized in this study (Figures 1 & 2). It was observed that roughly similar quantitative results could be obtained from these ions alone, raising the possibility of using this limited data set to match with greater speed and lower false identification probability. Regression and Bland-Altman plots were generated for comparison of NMR measurements and IM-MS measurements using only Au4L4 ions (see Figure S5). Briefly, the correlation between the two measurements was poorer (R2 = 0.988) and the limits of agreement were broader (−4.0% to 10.2%, 3.1% average difference between NMR and IM-MS).
In addition to OT:DT and Tio:GS AuNPs, tiopronin:11-mercaptoundecylpoly(ethylene glycol) (Tio:MUPEG) AuNPs were quantitatively analyzed in order to demonstrate the use of this technique with PEGylated ligands (Figure S6), which are commonly used in vivo.40, 41 The results of the quantitative analysis are shown in Table 1. Since the diagnostic NMR spectroscopic peaks were convoluted, validation experiments could not be successfully performed for the OT:DT and Tio:MUPEG AuNPs. It is also relevant to note here that corrections for ionization efficiency cannot be made, but differences in ionization efficiencies are not expected to be significant.13 The best method for validation will be an entirely different technique which functions independently of these complexities, namely NMR spectroscopy, which showed no evidence of ionization efficiency differences for the comparison using Tio:GS AuNPs. During the course of these experiments, it was observed that the relative abundance of the alternate ligand increased with greater exchange time, higher AuNP concentrations, and greater alternate:original ligand feed ratios as expected, with no anomalous behavior (Table S2).
It is worthwhile to compare these results to those obtained using MS without ion mobility separation. In a parallel experiment, some of the Tio:GS AuNPs were analyzed in a mass spectrometer using the same preparative protocol. Gold-thiolate ions were not observed for the 46:54 and 4:96 Tio:GS AuNPs, and only a single gold-thiolate ion species was observed for 14:86 and 56:44 Tio:GS AuNPs (Figure S7). This is a strong difference from our IM-MS strategy, for which every monolayer-protected AuNP studied has produced a significant amount of gold-thiolate ions. One possible cause for this difference may be the higher pressures utilized in the source and travelling wave regions of the IM-MS instrument. The operating source pressure was on the order of 10−2 Torr in the Synapt IM-MS instrument, compared to <10−6 Torr for the Voyager. At higher source pressures the collisional cooling of ions is increased,33 dissipating the internal energy of the gold-thiolate complexes and reducing the tendency towards ion fragmentation or decay. To ensure that the additional pressure did not produce gold-thiolate ions in a gas-phase reaction, a control experiment was performed in which bare gold AuNPs and free tiopronin ligand were spotted together on the stainless steel plate and immediately dried, preventing any significant amount of gold-ligand binding in solution. Analysis of the dried mixture by IM-MS revealed no gold-thiolate ion signal (Figure S8).
It is also possible to investigate gold-thiolate ions generated by tandem MS without ion mobility separation, as demonstrated by Murray and coworkers.28 However, the use of tandem MS requires precursor ion selection, at which point the absolute ligand abundances would likely already be known. Furthermore, in this approach the fragmentation product ions do not appear to accurately reflect the relative ligand abundances of the precursor MPC ion.28 This may be due to differences between MALDI in-source decay and CID-promoted fragmentation pathways, the differences between the fragmentation of small, “magic-sized” clusters and larger AuNPs, or the difference in pressure and collisional cooling leading to the preferential decay of some ions, as suggested by our MS results (Figure S7).
As a final note, while in revision an AuNP sample with a quaternary ligand mixture (cysteamine:glutathione:para-mercapobenzoic acid:3-mercaptopropanesulfonic acid) used by Feldheim and coworkers to identify antibiotics42 was successfully analyzed and quantified using the protocol described here for Tio:GS AuNPs (Figure S9). Due to the complex nature of this ligand mixture, quantitation could not be performed by any other analytical method.
Conclusion
In this report we have demonstrated the use of MALDI-IM-MS for the relative quantitation of AuNP- bound thiolate ligands for AuNPs with three different binary ligand mixtures (Tio:GS, OT:DT, and Tio:MUPEG). Results for Tio:GS AuNPs are validated by NMR spectroscopy, revealing less than 1% deviation in relative abundance between the two techniques. AuNPs with OT:DT and Tio:MUPEG ligand mixtures were analyzed by MALDI-IM-MS for quantitation purposes, an analysis that is difficult or impossible using NMR quantitation strategies. Comparison with a normal MS platform reveals that the diverse gold-thiolate ions observed here are not observable by MS. Thus, a strategy based on MALDI-IM-MS is uniquely capable of discriminating for a wide variety of gold-bound ligands and measuring their relative abundances. This general mixed-ligand AuNP characterization strategy should be scalable to the synthesis and characterization of a broader class of complex mixed monolayer-protected AuNPs, as evidenced by a preliminary examination of quaternary ligand mixtures.
Supplementary Material
Acknowledgments
The authors thank Jamee Bresee, and Prof. Dan Feldheim for providing samples, as well as Whitney B. Ridenour and Richard M. Caprioli (Vanderbilt University Medical Center) for the use of the Synapt HDMS which is supported by the VU Mass Spectrometry Research Core. Financial support for this work was provided by a Vanderbilt Chemistry-Biology Interface (CBI) training program (T32 GM065086) and the Warren Fellowship in support of K.M.H., NIH GM076479 to D.E.C., the Vanderbilt College of Arts and Sciences, the Vanderbilt Institute of Chemical Biology, the Vanderbilt Institute of Nanoscale Science and Engineering, and the Vanderbilt Institute of Integrative Biosystems Research and Education.
Footnotes
Supporting Information Available
A sample spreadsheet demonstrating the use of Microsoft Excel software for data processing and quantitation, a peak list from the validation experiment with molecular formula assignments and quantitation calculations, AuNP characterization data, analysis of quantitation using only Au4L4 ions, mass spectra of Tio:GS AuNPs without ion mobility separation, IM-MS of Tio:MUPEG AuNPs, IM-MS of a control sample of bare gold AuNPs with free tiopronin, and place exchange reaction parameters. This material is available free of charge at http://pubs.acs.org.
References
- 1.Cliffel DE, Turner BN, Huffman BJ. In: Wiley Interdiscipl Rev: Nanomed and Nanobiotechnol. Baker JR, editor. Vol. 1. John Wiley & Sons, Inc; Hoboken, New Jersey: 2009. pp. 47–59. [DOI] [PMC free article] [PubMed] [Google Scholar]
- 2.Eck W, Craig G, Sigdel A, Ritter G, Old LJ, Tang L, Brennan MF, Allen PJ, Mason MD. ACS Nano. 2008;2:2263–2272. doi: 10.1021/nn800429d. [DOI] [PubMed] [Google Scholar]
- 3.Wilson R. Chem Soc Rev. 2008;37:2028–2045. doi: 10.1039/b712179m. [DOI] [PubMed] [Google Scholar]
- 4.Cervera J, Manzanares JA, Mafe S. J Appl Phys. 2009;105:074315–074314. [Google Scholar]
- 5.Jadzinsky PD, Calero G, Ackerson CJ, Bushnell DA, Kornberg RD. Science. 2007;318:430–433. doi: 10.1126/science.1148624. [DOI] [PubMed] [Google Scholar]
- 6.Heaven MW, Dass A, White PS, Holt KM, Murray RW. J Am Chem Soc. 2008;130:3754–3755. doi: 10.1021/ja800561b. [DOI] [PubMed] [Google Scholar]
- 7.Templeton AC, Hostetler MJ, Warmoth EK, Chen S, Hartshorn CM, Krishnamurthy VM, Forbes MDE, Murray RW. J Am Chem Soc. 1998;120:4845–4849. [Google Scholar]
- 8.Fuente JMdl, Barrientos AG, Rojas TC, Rojo J, Cañada J, Fernández A, Penadés S. Angew Chem Int Ed. 2001;40:2257–2261. doi: 10.1002/1521-3773(20010618)40:12<2257::AID-ANIE2257>3.0.CO;2-S. [DOI] [PubMed] [Google Scholar]
- 9.Ackerson CJ, Jadzinsky PD, Sexton JZ, Bushnell DA, Kornberg RD. Bioconjugate Chem. 2010;21:214–218. doi: 10.1021/bc900135d. [DOI] [PMC free article] [PubMed] [Google Scholar]
- 10.Wuelfing WP, Gross SM, Miles DT, Murray RW. J Am Chem Soc. 1998;120:12696–12697. [Google Scholar]
- 11.Wuelfing WP, Murray RW. J Phys Chem B. 2002;106:3139–3145. [Google Scholar]
- 12.DeVries GA, Brunnbauer M, Hu Y, Jackson AM, Long B, Neltner BT, Uzun O, Wunsch BH, Stellacci F. Science. 2007;315:358–361. doi: 10.1126/science.1133162. [DOI] [PubMed] [Google Scholar]
- 13.Dass A, Holt K, Parker JF, Feldberg SW, Murray RW. J Phys Chem C. 2008;112:20276–20283. [Google Scholar]
- 14.Song Y, Huang T, Murray RW. J Am Chem Soc. 2003;125:11694–11701. doi: 10.1021/ja0355731. [DOI] [PubMed] [Google Scholar]
- 15.Grainger DW, Castner DG. Adv Mater (Weinheim, Ger) 2008;20:867–877. [Google Scholar]
- 16.Reyes E, Madueno R, Blazquez M, Pineda T. J Phys Chem C. 2010 doi: 10.1021/jp9122387. [DOI] [Google Scholar]
- 17.Jimenez VL, Leopold MC, Mazzitelli C, Jorgenson JW, Murray RW. Anal Chem. 2002;75:199–206. doi: 10.1021/ac0260589. [DOI] [PubMed] [Google Scholar]
- 18.Hostetler MJ, Templeton AC, Murray RW. Langmuir. 1999;15:3782–3789. [Google Scholar]
- 19.Terrill RH, Postlethwaite TA, Chen CH, Poon CD, Terzis A, Chen AD, Hutchison JE, Clark MR, Wignall G, Londono JD, Superfine R, Falvo M, Johnson CS, Samulski ET, Murray RW. J Am Chem Soc. 1995;117:12537–12548. [Google Scholar]
- 20.Templeton AC, Cliffel DE, Murray RW. J Am Chem Soc. 1999;121:7081–7089. [Google Scholar]
- 21.Badia A, Singh S, Demers L, Cuccia L, Brown GR, Lennox RB. Chem-Eur J. 1996;2:359–363. [Google Scholar]
- 22.Song Y, Harper AS, Murray RW. Langmuir. 2005;21:5492–5500. doi: 10.1021/la0503606. [DOI] [PubMed] [Google Scholar]
- 23.Zhu ZJ, Ghosh PS, Miranda OR, Vachet RW, Rotello VM. J Am Chem Soc. 2008;130:14139–14143. doi: 10.1021/ja805392f. [DOI] [PMC free article] [PubMed] [Google Scholar]
- 24.Zhu ZJ, Rotello VM, Vachet RW. Analyst. 2009;134:2183–2188. doi: 10.1039/b910428c. [DOI] [PubMed] [Google Scholar]
- 25.Yan B, Zhu ZJ, Miranda O, Chompoosor A, Rotello V, Vachet R. Anal Bioanal Chem. 2010;396:1025–1035. doi: 10.1007/s00216-009-3250-6. [DOI] [PubMed] [Google Scholar]
- 26.Tracy JB, Crowe MC, Parker JF, Hampe O, Fields-Zinna CA, Dass A, Murray RW. J Am Chem Soc. 2007;129:16209–16215. doi: 10.1021/ja076621a. [DOI] [PubMed] [Google Scholar]
- 27.Dass A, Stevenson A, Dubay GR, Tracy JB, Murray RW. J Am Chem Soc. 2008;130:5940–5946. doi: 10.1021/ja710323t. [DOI] [PubMed] [Google Scholar]
- 28.Fields-Zinna CA, Sampson JS, Crowe MC, Tracy JB, Parker JF, deNey AM, Muddiman DC, Murray RW. J Am Chem Soc. 2009;131:13844–13851. doi: 10.1021/ja905787y. [DOI] [PubMed] [Google Scholar]
- 29.Fields-Zinna CA, Sardar R, Beasley CA, Murray RW. J Am Chem Soc. 2009;131:16266–16271. doi: 10.1021/ja906976w. [DOI] [PubMed] [Google Scholar]
- 30.Mrksich M. ACS Nano. 2008;2:7–18. doi: 10.1021/nn7004156. [DOI] [PMC free article] [PubMed] [Google Scholar]
- 31.Harkness KM, Cliffel DE, McLean JA. Analyst. 2010;135:868–874. doi: 10.1039/b922291j. [DOI] [PMC free article] [PubMed] [Google Scholar]
- 32.Harkness KM, Fenn LS, Cliffel DE, McLean JA. Anal Chem. 2010;82:3061–3066. doi: 10.1021/ac100251d. [DOI] [PMC free article] [PubMed] [Google Scholar]
- 33.Medzihradszky KF, Campbell JM, Baldwin MA, Falick AM, Juhasz P, Vestal ML, Burlingame AL. Anal Chem. 1999;72:552–558. doi: 10.1021/ac990809y. [DOI] [PubMed] [Google Scholar]
- 34.Templeton AC, Chen S, Gross SM, Murray RW. Langmuir. 1999;15:66–76. [Google Scholar]
- 35.Brust M, Walker M, Bethell D, Schiffrin DJ, Whyman R. J Chem Soc, Chem Commun. 1994:801–802. [Google Scholar]
- 36.Karas M, Hillenkamp F. Anal Chem. 1988;60:2299–2301. doi: 10.1021/ac00171a028. [DOI] [PubMed] [Google Scholar]
- 37.Gies AP, Hercules DM, Gerdon AE, Cliffel DE. J Am Chem Soc. 2007;129:1095–1104. doi: 10.1021/ja0639057. [DOI] [PubMed] [Google Scholar]
- 38.Tang Z, Xu B, Wu B, Germann MW, Wang G. J Am Chem Soc. 2010;132:3367–3374. doi: 10.1021/ja9076149. [DOI] [PubMed] [Google Scholar]
- 39.Bland JM, Altman DG. Lancet. 1986;327:307–310. [PubMed] [Google Scholar]
- 40.Qian X, Peng XH, Ansari DO, Yin-Goen Q, Chen GZ, Shin DM, Yang L, Young AN, Wang MD, Nie S. Nat Biotechnol. 2008;26:83–90. doi: 10.1038/nbt1377. [DOI] [PubMed] [Google Scholar]
- 41.Simpson CA, Huffman BJ, Gerdon AE, Cliffel DE. Chem Res Toxicol. 2010 doi: 10.1021/tx100209t. [DOI] [PMC free article] [PubMed] [Google Scholar]
- 42.Bresee J, Maier KE, Melander C, Feldheim DL. Chem Commun (Cambridge, U K) 2010 doi: 10.1039/C1030CC02663H. [DOI] [PubMed] [Google Scholar]
Associated Data
This section collects any data citations, data availability statements, or supplementary materials included in this article.