

Abstract
Many pathogenic bacteria are able to survive attack by the host's immune system because of antioxidant systems that mitigate the effects of reactive oxygen species. Dps is a hollow 12-subunit protein nanocage that prevents oxidative damage by oxidizing and sequestering intracellular Fe2+; the resulting Fe3+ forms an iron oxyhydroxide nanoparticle in the cage interior. Charged sites on the protein nanocage create an electrostatic gradient that guides ions through well-defined pores that connect the cage interior with the surrounding solution and toward nucleation sites on the cage interior. In this study, we use all-atom molecular dynamics to simulate the motion of simple cations into the dodecameric cage formed by the Dps protein from Listeria monocytogenes. Ion trajectories are analyzed by using a novel, to our knowledge, genetic algorithm to determine the temporal sequence of ion-protein interactions. Ions enter Dps through well-defined pores at the ferritinlike C3 axes, with negatively-charged residues on the outside of the cage forming a fairly well-defined entrance pathway. This method of trajectory analysis may be broadly applicable in situations where the spatial localization of ions or other small molecules is electrostatically driven by a biomolecule.
Introduction
Oxidative stress is an ever-present danger for biological systems. Radical oxygen species are highly reactive and can severely damage cellular components, particularly DNA (1,2). One source of damaging reactive oxygen species is the Fenton reaction, where hydroxyl radicals are generated by Fe2+-catalyzed disproportionation of H2O2. The electrostatic association of divalent cations with DNA makes this a particularly common and serious form of oxidative damage. Many bacteria and archaea utilize an antioxidative defense system involving the Dps protein (3–7), which derives its name from its initial characterization as a DNA-binding protein in starved cells. Dps forms a symmetric, hollow 12-subunit cage with an inner diameter of ∼5 nm and internal catalytic sites that promote the oxidation of Fe2+ to Fe3+ by H2O2. Although Fe2+ is highly soluble in aqueous solution, Fe3+ is insoluble and precipitates inside the protein cage as an iron oxyhydroxide nanoparticle that is passivated by its protein shell. It is thought that Dps can help bacteria cope with sudden oxidative stress by eliminating both Fenton reactants in a manner that prevents the formation of ⋅OH; this may be important in helping pathogenic bacteria survive the reactive oxygen species produced by phagocytic cells in the host immune system (8–10). The virulence of the food-borne pathogen Listeria monocytogenes increases with the availability of iron, suggesting that the Dps system actively uses intracellular iron to combat peroxide stress (3).
The potential for controlled mineralization of monodisperse, biocompatible nanoparticles has made Dps, along with other protein cages such as ferritins and virus capsids, attractive platforms for bionanotechnology (11). Protein-encapsulated nanoparticles are being explored for applications in magnetic imaging (12,13) and renewable energy (14). There has also been significant work done on the details of nanomineral formation. The protein-inorganic composites are small enough that their mass can be measured with noncovalent mass spectrometry (15), allowing a detailed look at the process of mineral formation. The mass spectrometry data can be adequately described by a simple nucleation and growth model in which ions enter the protein cage, are bound and oxidized at well-defined sites on the cage interior, and then are added to a growing nanoparticle at a rate proportional to the particle's surface area.
The mechanistic details of ion entry and binding are difficult to characterize experimentally. Crystallographic studies have shown Fe3+ ions bound to a unique intersubunit ferroxidase site formed by E62 and D58 from one subunit, together with H43 and H31 from an adjacent subunit (16,17). In addition, mutagenesis studies have shown that D130, located near one of the C3 axes of the dodecamer, is essential for iron uptake. Mutation of this residue to a neutrally charged asparagine eliminates most of Dps's functional activity, even if the ferroxidase site is still intact (18).
This study aims to connect these two known functional sites—the entry point of solution ions into the cage and the catalytic site at which they are oxidized—using all-atom molecular dynamics (MD) simulations (19). All-atom MD is well suited to problems in which the motions of water molecules and ions need to be tracked explicitly. The trajectories created using MD are often very noisy due to the diffusive character of molecular motions. To extract a coherent picture of ion motion, a novel genetic algorithm (GA) (20) is used to extract probabilistic temporal interaction sequences from noisy data. The calculated ion pathways provide temporal sequences connecting the known interaction sites. This method for extracting temporal sequences may be applicable to other biomolecular systems that drive the motion of ions or small molecules, such as transmembrane channels and ion pumps.
The trajectory analysis scheme described below can be separated into four parts.
First, ion-protein distances are analyzed to obtain life histories that describe the sequential interactions of an individual ion with various sites on the protein.
Second, these interaction lists are used to build up a matrix of temporal correlations between protein residues; two residues are temporally correlated if ions typically interact with one residue before the other. These correlations form the basis of further claims about the order in which ions interact with different sites on the protein cage.
Third, a genetic algorithm is used to identify an ordered list of unordered sets of residues that describe a statistically ordered interaction of ions with protein residues. For example, long lists of single-residue sets give strictly-ordered interaction sequences, while short lists of larger sets can separate the protein into temporally correlated regions. Because an all-atom simulation of Dps is rather complex in its own right, the performance of the GA has also been benchmarked using a simple one-dimensional Markov model, as described in the Supporting Material.
Fourth, a method is presented for assessing the statistical significance of an interaction sequence.
Methods
Structure preparation
Starting coordinates were taken from the Dps crystal structure (PDB ID 2IY4) (16). MolProbity (21) was used to evaluate the stereochemical quality of the starting structure; unfavorable rotamers were corrected and the flexible N-termini (which were not fully resolved in the crystal structure) reconstructed using DeepView (22). The Fe3+ ions assigned in the crystal structure were replaced with Mg2+. A restrained minimization in NAMD (23) was used to further improve the starting structure geometry. Protonation states of titratable amino-acid side chains were calculated using H++ (24) and PropKa (25); protonation states were assigned based on a consensus between these two methods and subsequently adjusted so that the protein conformation near the active sites and the ferritinlike C3 axis remained stable in trial simulations. Buried H2O molecules were assigned using DOWSER (26), SOLVATE (27) was used to extend this to an optimized solvation shell, the solvate plug-in in VMD (28) was used to complete the solvent box, and cations (either Mg2+ or K+) were added to compensate the net negative charge of the protein. A more extensive description of the structure preparation process is available in the Supporting Material accompanying this article.
All-atom molecular dynamics (MD)
MD trajectories were calculated using NAMD version 2.6b (23), with the CHARMM27 force field (29). A Langevin piston was used to maintain constant pressure in a unit cell with periodic boundary conditions, and a Langevin thermostat was used to maintain constant temperature. Bonds to hydrogen atoms were kept rigid using the RATTLE algorithm, allowing a simulation timestep of 2 fs. Both the Mg2+ and K+ simulations were run for 50 ns, with trajectory frames recorded every 10 ps. Simulations were run using 128 CPUs on the TACC Lonestar cluster, accessed via the TeraGrid computing infrastructure (30).
Targeted molecular dynamics (TMD)
The 50-ns time window used for the initial MD simulations was too short for substantial ion entry, especially in the case of the Mg2+ simulation, where no ions entered the cage at all during 50 ns. To produce trajectories in which more cage-entry events were observed and therefore get stronger correlations for use in the GA, TMD (31) was used to bias atom motion toward the center of the cage. In TMD, an additional force is applied to targeted atoms as determined by the gradient of the potential
where N is the number of atoms being targeted, Rfit is the instantaneous best-fit RMSD between these atoms and their target position, Rinitial is the initial RMSD, τ is the targeting time frame, and k is a spring constant. Reasonable trajectories were obtained for τ = 10 ns and k = 20 kcal/mol/Å2; higher values of k often led to trajectories in which ions would force their way through by disrupting the cage structure. In a typical simulation, ions initially dispersed in solution would be targeted toward a single point at the center of the protein cage; some ions would enter through the ferritinlike pores whereas others would remain stuck at the surface of the cage. The simulation would be terminated before t = τ (typically ∼5.5 ns) to avoid extremely large forces. To give the ions that had become trapped at the surface a chance to reorient and enter, they were briefly targeted to points near the periphery of the water box and then allowed to equilibrate without targeting for 2 ns. After three repetitions of this cycle, 27 ions had entered the cage in K+ simulation and 11 in the Mg2+ simulation, compared to and 7 K+ and no Mg2+ in the nontargeted simulations.
It should be noted that, despite the ability of TMD to roughly reproduce optimal free energy pathways (31), it inevitably introduces some bias and leads to trajectories that may differ from what would be observed in longer unbiased simulations. Given the qualitative agreement between the entry trajectories in the TMD simulations and the unbiased K+ simulation, the TMD results probably yield plausible results but should still be interpreted with caution.
Temporal correlations and ion life histories
To understand the pathways of ion entry into or exit from the protein cage, we developed a method of calculating temporal correlations between ion interactions with different sites (amino-acid side chains) on the protein cage. This was done first by calculating ion life histories—for each ion, a one-dimensional array was constructed containing the nearest amino-acid residue (if one could be found within 5 Å) at each recorded frame in the MD trajectory. The 12-fold symmetry of the cage was exploited so that an interaction with a residue on a particular subunit is equivalent to interaction with any of the other 11 symmetry-related sites.
Once a life history has been calculated, it can be examined to determine whether the interactions of ion i with a given pair of residues (rA,rB) contains a temporal bias. Given a defined sequence of interaction with the residues rA and rB, we desire a metric of temporal correlation C(i,rA,rB) with the following characteristics:
-
1.
Symmetry: C(i,rA,rB) = −C(i,rB,rA). In addition, if the order of the interaction sequence is reversed (i.e., AAABBB compared to BBBAAA), the sign of C(i,rA,rB) should change. It follows that C(i,rA,rB) = 0 for palindromic sequences, and C(i,rA,rA) = 0 for all sequences.
-
2.
Extensivity: If the sampling frequency in the trajectory is changed, C(i,rA,rB) should be scaled by the same factor.
-
3.
For a trajectory with fixed length, C(i,rA,rB) should be larger if interactions are strictly sequential than if they are not. For example, C(i,rA,rB) for the sequence AAAAABBBBB should be higher than AAABABABBB, which should be, in turn, higher than ABABABABAB.
These characteristics can be satisfied for a correlation that is computed as follows:
-
1.
For a pair of residues A and B, assemble a sequence with length N of their interactions with the ion.
-
2.
A sequence of length N will contain N(N-1)/2 nonconsecutive ordered pairs; place these in categories such that nAA is the number of A-A pairs, nAB the number of A-B pairs, etc. For example, the sequence AAABABBB has nAA = 6, nAB = 15, nBA = 1, nBB = 6. Count up the ordered pairs so that nAA + nAB + nBA + nBB = N(N-1)/2.
-
3.
C(i,rA,rB) = nAB − nBA.
-
4.
Finally, average the correlations over all ions to obtain
| (1) |
Analyzing correlations with a genetic algorithm
Our goal is to arrive at an idealized sequence of events: one which may not be precisely followed by any ion, but which will be approximated by many of them. To extract such a sequence from the calculated temporal correlations, we seek ordered sequences of sets of residues {r}1→{r}2→…→{r}d (referred to below as solution S) that maximize the setwise temporal correlation
| (2) |
while keeping the size nj of each set large enough to provide information about several sites on the protein (i.e., more than a single strong correlation). If a total of N protein residues can be included in solutions, then the number of possible solutions is
| (3) |
This value rapidly becomes too large to search exhaustively, requiring approximate analysis using a GA. The steps of the algorithm are as follows:
-
1.
For a given solution depth d ≥ 2, define a pool of m randomly-generated solutions {Si}, where each solution consists of d disjoint, nonempty sets of residues.
-
2.
For each solution, calculate a fitness function
| (4) |
where w is a weighting factor that controls the relative importance of set size and setwise correlation. The natural logarithm of ni is used rather than a simple sum of ni so that the fitness function is biased in favor of balanced solutions where the total number of residues is more evenly distributed between the different {r}i. Due to the shape of the fitness landscape (see Results), it was usually necessary to set w = 0 and specify a minimal value for the first term in f(S) to enforce a minimal solution size,
-
3.
Solutions are ranked in order of f(S), and the lowest-ranking m/2 solutions are discarded.
-
4.The population is replenished through a breeding process in which:
- a. Two solutions S1 and S2 are selected at random.
- b. For each residue set {r}i in the offspring solution S12, elements are selected with a probability P from the corresponding set {r}i in the parent solutions S1 and S2. A choice of P = 1/2 ensures that changes in set size are not biased by the breeding process, and overall changes in set size are driven by their impacts on f(S).
- c. For each residue set {r}i in the offspring solution S12, any duplicate elements are discarded. In addition, elements that are present in {r}i will not be included in {r}j>i, ensuring that each residue appears, in S12, at most, once.
-
5.
Steps 2–4 are repeated until the optimization process saturates and the average f(S) in the population has remained constant for longer than a specified cutoff (200 steps typically worked well).
Significance test
Because the algorithm applied above allows d, w, and ncutoff to be set arbitrarily, it is possible to obtain solutions that are not significant, in the sense that a large number of other solutions would describe the temporal correlation patterns equally well. To test the significance of a (presumably) optimal solution S, ensembles of nearly-optimal solutions {S′} were generated by replacing a randomly-chosen residue r in a randomly-chosen set {r}i with another residue not contained in S. A large number of derived solutions {S′} were calculated from S and a significance score
| (5) |
was calculated. The denominator of Z is the standard deviation of the fitnesses of {S′}; a large value of Z indicates that the solution S has a significantly higher fitness than the ensemble {S′}.
Results
MD simulations
In the untargeted simulations, entry into the cage was slow; none of the 27 Mg2+ ions entered the cage during the 50-ns simulation, while seven K+ ions (out of 52) entered the cage during 50 ns (Fig. 1 A). The two ion types showed very different solvation properties; H2O molecules coordinating K+ ions routinely detached and were replaced by other H2O molecules within the 10-ps time window of simulation snapshots, while Mg2+ ions typically maintained the same six H2O neighbors throughout the 50-ns simulation. From the protein's point of view, fully solvated Mg2+ ions appear to be larger than K+ ions, despite their smaller van der Waals radius (see Fig. S1 in the Supporting Material). In initial simulations, Mg2+ ions that began too close to the protein surface for complete solvation became irreversibly bound to protein oxygen atoms, prohibiting cage entry on the simulation timescale. For this reason, the initial simulation setup placed free Mg2+ ions near the periphery of the solvent box, to ensure that they remained mobile. More ions were induced to enter the cage during the TMD simulations; 11 Mg2+ and 27 K+ ions had entered the cage before the targeting process was completed.
Figure 1.
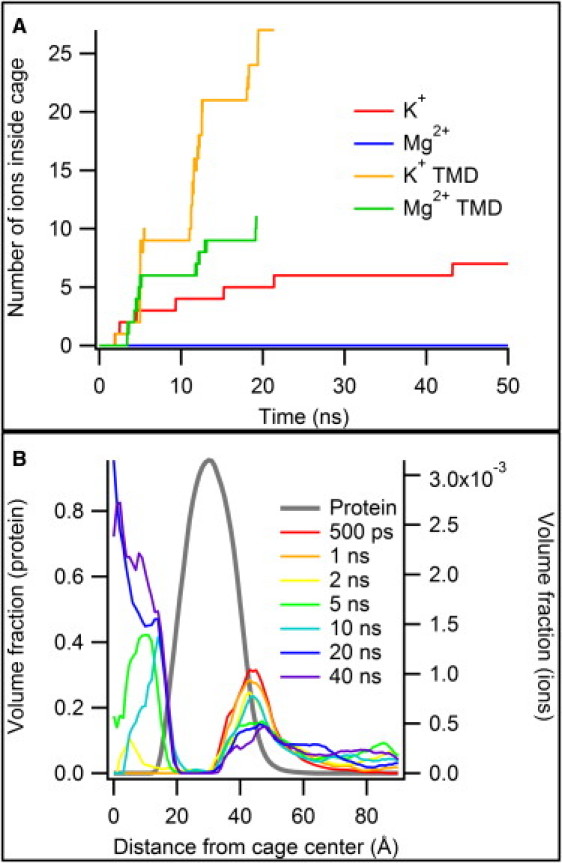
(A) Time course of ion entry into Dps. The two TMD simulations show three regions of steep increase (inward targeting) separated by plateaus. (B) Radial distribution of protein and ions. These distributions were drawn from the untargeted K+ simulation; a similar plot for the Mg2+ simulation can be found in the Supporting Material. The population of ions associated with the outer surface of the cage decreases steadily with time, while ions accumulate inside the cage.
More insight into the process of ion entry into the cage can be gained by looking at radial distributions of the protein and ion contents. The roughly spherical shape of the cage means that the distribution of protein and ions can be approximated by finding the density of each type of atom as a function of distance from the cage center (Fig. 1 B). Initially, all ions are outside the protein cage. As the simulation continues, a population of ions inside the cage grows steadily relative to the outer population.
To assess the roles of particular residues in creating this bimodal distribution of ion positions, we can monitor ion neighbors through the course of the simulation by calculating sequences of ion-residue interactions (as described above in Methods) and determining what fraction of the time ions spend in the vicinity of a particular residue (Fig. 2). Most interactions are fairly transient; the strongest interaction observed was with residue D121, which forms a sort of holding area just outside the entry to the cage; ions in the untargeted simulations spent as much as 25% of their time in its vicinity.
Figure 2.
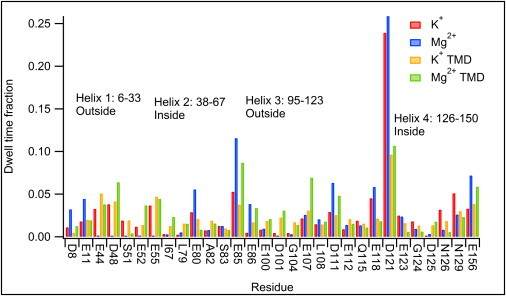
Ion associations with specific residues in Dps. Only the 30 strongest-interacting residues are shown. Note the particularly strong interactions with D121, which forms a sort of waiting area outside the narrow pore formed by D130, which interacts with ions more transiently.
Other strong interactions (particularly with the more highly-charged Mg2+ ions) are with E85 and E156, which extend far into the solution and are not associated with a pore region. Residues inside the cage (such as E44, E52, and E55) show stronger interactions in the TMD simulations because more ions spend time inside the cage.
Correlation calculations
The temporal correlation C(rA,rB) was calculated for each pair of residues as described above. Most pairs of residues show no significant correlation, and the majority of values found were close to zero. The correlations follow a power-law distribution (Fig. 3 A) with a scaling exponent of ∼2.1. The handful of residue pairs with very high correlations dominate the temporal dynamics of the system. Table S1 lists the strongest correlations, many involving residues in the vicinity of the ferritinlike C3 axis such as D121 and D129. The significance of these correlations can be assessed by comparing the values obtained for different simulations, as well as by restricting the analysis to disjoint subsets of ions within a single simulation and comparing the correlations obtained (Fig. S2). The K+, K+ TMD, and Mg2+ TMD simulations all gave matrices that were similar, within the limits imposed by stochasticity, whereas the untargeted Mg2+ simulation yielded a dramatically different matrix, consistent with its qualitative different ion entry behavior (i.e., a complete lack thereof). When the ion sets in each simulation were divided into two subsets and the resulting correlation matrices compared, the three similar simulations were internally consistent while the Mg2+ simulation lacked this consistency. This strongly suggests that the untargeted Mg2+ simulation does not supply a set of correlations that give a robust picture of ion motion around Dps.
Figure 3.
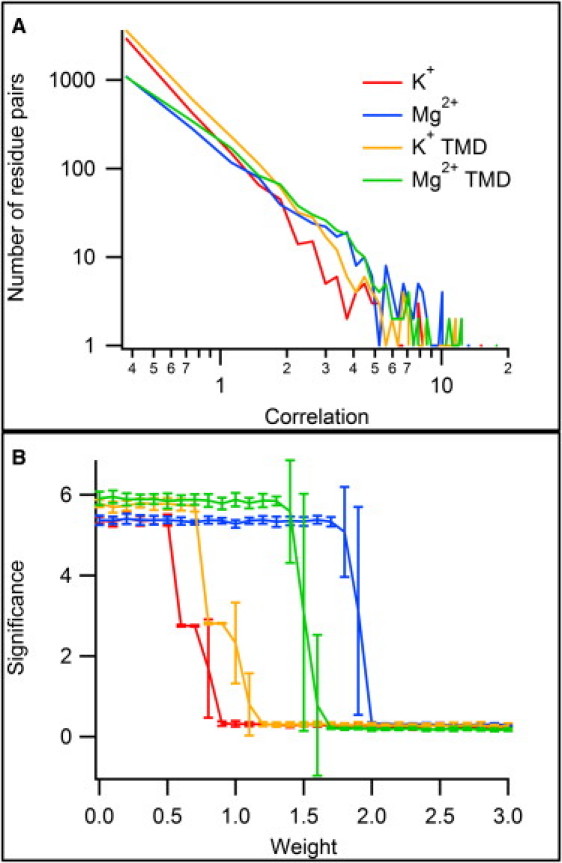
(A) Distribution of temporal correlation values. The power-law distribution means that highly-correlated residue pairs are infrequent but describe the most prominent features of the overall correlation landscape. (B) Effects of varying w around wcrit. The relative weight of the size and correlation contributions to the solution fitness function f(S) were varied for solutions of depth 2 with each of the MD trajectories. At low values of w, the solutions consisted of the most strongly-correlated pair of residues; see the first line in Table S1. Around a critical value of w, the substitution significance drops dramatically, signaling a transition from small solutions with high correlation values to very large solutions with marginal correlation values.
Genetic algorithm benchmarking
Before being applied to the MD simulation results, the GA was benchmarked using a simple one-dimensional Markov chain model. This model consisted of a series of N states, with transition rates kij between these states such that kij = 0 unless i = j ± 1. Three simple cases were examined: unbiased diffusion (kij = kji equal for all i,j), uniform bias (kij = b/(1+b), kji = 1/(1+b) for i < j and b ≥ 1), and a kinetic bottleneck where the bias is applied at only one site in the chain. All simulations began with the state at one end of the chain (i = 0); this localization imposed an ordering on the initial stages of the simulation, similar to an MD trajectory in which all ions begin outside the protein cage. Transitions between states were simulated using a kinetic Monte Carlo algorithm (32), with the state of the system being recorded at constant intervals, similar to the evenly-spaced snapshots in an MD simulation. Temporal correlations between states were evaluated using the same methods described above for MD simulations.
The complete benchmarking results are described in the Supporting Material accompanying this article; a few relevant points will be mentioned here. First, the GA gives the best performance for simulation lengths that are comparable to the mean first passage time from one end of the chain (i = 0) to the other (i = N). Shorter simulations tend to be undersampled at high values of i and sometimes do not order correctly; in longer simulations, the system equilibrates and no temporal correlations persist. This result is unaffected by kinetic biases discussed above; in general; kinetic biases affect the GA results only through their effect on the mean first passage time. The GA is robust against low sampling rates—even if the sampling rate is lower than the typical transition rate (so that some transitions are missed entirely), the correct ordering of states is still returned. The MD sampling rate (10 ps) is fast enough that the average distance covered by an ion within this sampling time (2.5 ± 1.2 Å for K+, 1.4 ± 0.8 Å for Mg2+) is less than the spacing between adjacent protein residues (∼3.8 Å) and therefore well within the limits of optimal GA performance. The GA could correctly order states in the Markov simulation for solutions with length up to ∼7; longer sequences often contained some errors. Most significantly, the benchmarking studies showed that the GA was far more reliable at returning correctly-ordered solutions than at returning optimal solutions. This suggests that the best usage of the GA with MD simulations is to give a qualitative description of the sequence of ion-protein interactions; this description is reliable as long as the ordering of interactions within the set of solutions returned over numerous GA runs remains fairly consistent.
Genetic algorithm analysis of MD trajectories
The power-law distribution of the temporal correlations has important consequences for the solution fitness landscape. The weighting parameter w in Eq. 4, which controls the relative importance of solution size and residue correlations, can be used to obtain two very different solution regimes. A critical value of w can be found (Fig. 3 B) such that for w < wcrit one obtains very small solutions (typically one or two residues per set {r}i), containing residues that tend to be drawn from the very highly-correlated residues listed in Table S1. These solutions tend to be fairly consistent across numerous evaluations of the GA. For w > wcrit, one obtains very large solutions containing a sizable fraction of the total residue set. Average correlations in this case are near zero and the contents of the optimal solution vary dramatically between evaluations of the GA. This indicates that these solutions are not strongly constrained by the data returned by the MD simulation and are therefore not a reliable source of information about the temporal ordering of events in the simulations. Fig. 3 B illustrates the performance of the significance metric as w is varied around wcrit. In each case, the significance shows a dramatic drop-off around a critical value, corresponding to the transition between small and large solutions.
Moderately-sized solutions with significant correlation values were not observed—adjusting w proved to be an ineffective way of controlling the solution size. In the results described below, w was always set to zero. To provide some control over the solution size, a parameter ncutoff was introduced (as described in Methods) to place a lower bound on the solution size.
Part of the power of GAs comes from a large, diverse initial solution population. To find an optimal balance between solution diversity and computational cost, the GA was run with d = 2, ncutoff = 10, and also with d = 20, ncutoff = 1. These two sets of parameters span the limiting cases of large residue sets and long temporal chains. The population size was varied from 10 to 1000, and the GA optimization repeated 50× for each population size (Fig. 4). In the case of shallow solutions with large residue sets (Fig. 4 A), the performance of the algorithm improved most dramatically as the population size increased from 10 to 200, and all of the statistics remained unchanged for populations larger than ∼500. For the deep solutions (Fig. 4 B), however, performance continued to improve as the population size increased. In all cases, the computational cost scaled linearly with population size. The calculations presented used a population size of ∼400 is optimal for shallow solutions and ∼1000 for deep solutions.
Figure 4.
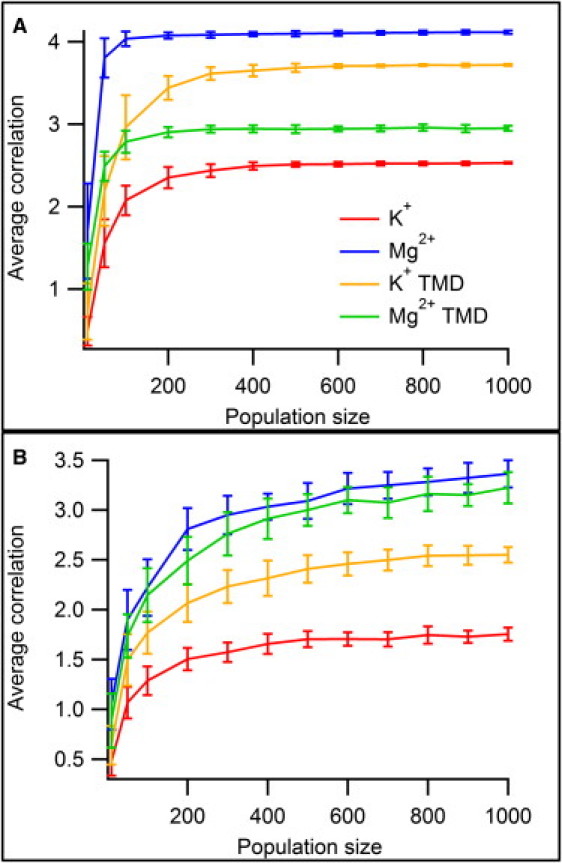
Effects of varying population size on GA performance. Tests were conducted for d = 2, ncutoff = 10 (A), and d = 20, ncutoff = 1 (B). The shallow solutions (A) showed a clear asymptotic behavior with no significant improvement for N > 400; the deep solutions (B) also appear to approach an asymptote, but do so more slowly. Note that the average correlation values obtained are higher for the Mg2+ simulations because of their stronger ion-protein interactions, and that targeting significantly improves the correlation values obtained for K+.
Long temporal chains
By increasing the simulation depth d, long temporal chains can be calculated in which ions are likely to interact with residues early in the chain before interacting with those near the end. Fig. 5 A shows the effects of increasing d, with w = 0 and ncutoff = 1. These parameters ensure that the set size at each level of the solution will be minimal, placing residues in a well-defined order. The fairly smooth decrease in the significance suggests that there is no critical value of d at which the GA results suddenly become unreliable as was seen when varying w. Instead, one can compare the results from calculations at different values of d to obtain a consensus sequence that persists across different values of d. Calculations were repeated 40× for each value of d, and the highest-ranking solutions found are listed in Table S2. Although some inconsistencies are present, a consensus sequence can be established for ion entry,
where groups of residues in parentheses do not show consistent ordering in Table S2. The spatial relationship of these residues is shown in Fig. 6.
Figure 5.
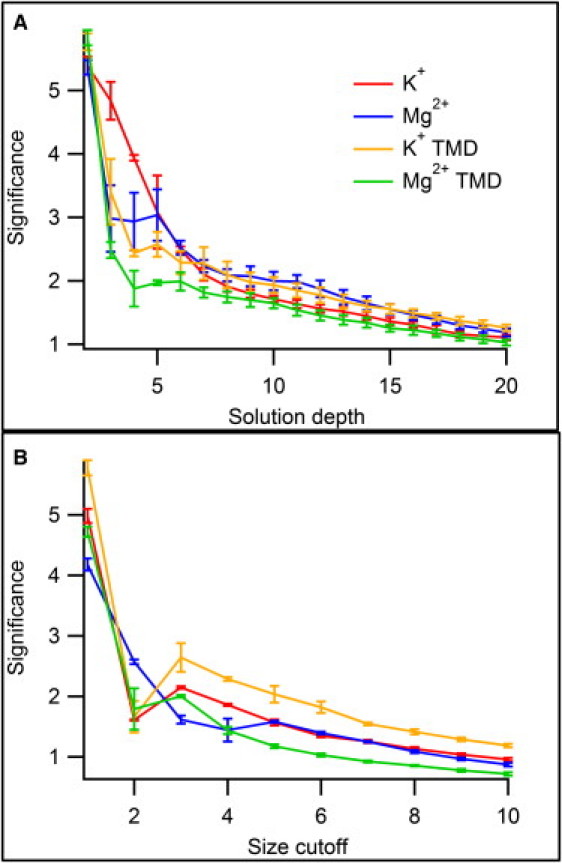
GA performance for solutions with varying depth d (A) and minimal set size ncutoff (B). The significance of solutions decreases steadily with increasing d. Unlike the average correlation (Fig. 4), the significance values show little variation between simulations.
Figure 6.
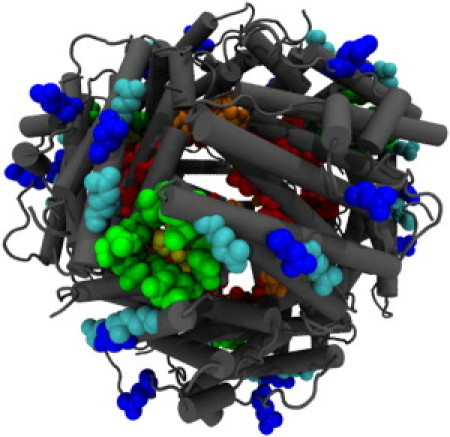
Residues prevalent in long temporal chain sequences (see Table S2), colored according to the consensus interaction sequence. (Blue, E85, D111; cyan, E107, E118; green, D121, N126, N129, I133; yellow, D130; orange, E44; and red, D48, S51, E52, E55.)
Large clusters
Alternatively, the GA can be run with d = 2, w < wcrit, and a large ncutoff. This yields solutions containing two large sets, where ions are likely to interact with residues out of the first set before those out of the second set. Fig. 5 B shows the effects of increasing ncutoff. Like the long temporal chains, these calculations show a fairly steady decrease in significance as ncutoff increases, with no clear critical value. As a result, there is no clear way to identify an optimal value for ncutoff, and GA results obtained at a single cutoff value should not be interpreted in isolation. One useful comparative approach can be illustrated in Table S3, which lists the highest-ranking solutions for each MD simulation at various ncutoff values. Solutions are printed in boldface if the division of residues between the two solution sets was consistent among all the results obtained in 40 evaluations of the GA algorithm; inconsistencies were typically observed when ncutoff became >4–6, and this can be taken (in this case) as a rough upper limit for the method's reliability.
The GA appears to be more effective at finding large clusters than long chains; when the results of 40 GA runs were compared, the highest-ranking solution always appeared several times (even for the largest values of ncutoff), whereas the long temporal chain calculations often struggled to consistently find the optimal solution. This can easily be understood using Eq. 3; there are ∼1013 times as many ways of arranging a solution containing 20 residues into an ordered chain (20!) as of separating it into two groups of 10 residues (20!/10!2); the larger number of possibilities creates a harder optimization problem.
Discussion
Dps is a member of the ferritin superfamily (4), and shares many features with the better-studied ferritin proteins. Ferritin and Dps exhibit a similar four-helix bundle structure, although the functional form of ferritin consists of a 24-subunit cage with octahedral symmetry, in contrast to the tetrahedral symmetry of the 12-subunit Dps cage. Calculations of the electrostatic potential around human H-chain ferritin (33) have shown an electrostatic gradient that would direct ambient cations inward through the pore at the C3 axis, and the ferroxidase and nucleation sites all show highly negative values of the electrostatic potential. The electrostatic gradient is directed out of the protein cage through a smaller pore at the C4 axis, suggesting that this might be the preferred route of cation exit during nanoparticle dissolution. Dps exhibits two C3 axes; the one near D130 has been referred to as ferritinlike and is structurally conserved between Dps and ferritin, while the C4 axis in ferritin is replaced by a non-ferritinlike C3 axis near T41. In light of these structural similarities, it is not surprising that Dps also takes in cations through its ferritinlike C3 axis.
It should be noted that the dynamics of K+ and Mg2+ near the Dps cage are of limited biological interest. Although the cellular environment of Dps contains these ions, its chief biological role is to oxidize and mineralize Fe2+, for which these simpler ions have served as proxies in this study. Aqueous Fe ions are significantly more complicated (34) than simpler Group 1 and Group 2 ions and have not yet been parameterized for MD force fields. As a result, K+ and Mg2+ were chosen as simple ions whose properties differ enough to allow comparisons to be made that could be extended to more complex species. Behaviors that are common to these two ions are likely to be fairly insensitive to ion properties and can be (cautiously) extrapolated to more complex transition metal ions.
Support for this view can be found in the analysis shown in Fig. S2, which shows that the correlation matrix values obtained for the three simulations in which ion entry was observed (K+, K+ TMD, and Mg2+ TMD) are roughly as similar to each other as the correlation matrices obtained by examining two subsets of ions in a single simulation. If the detailed properties of K+ and Mg2+ cannot be distinguished at the level of the correlation matrix (and therefore even less so at subsequent stages of the analysis), then any changes in the GA results that would have (hypothetically) arisen from the unique features of Fe2+ would likely be minimal.
The results of our GA calculations should be considered in light of a recent study (18) in which three aspartate residues lining the ferritinlike pore at the C3 axis of Listeria innocua Dps (D121, D126, and D130) were mutated to asparagine, attenuating their interactions with solution cations. The D121N and D126N mutants showed no significant reduction in the initial rate of Fe2+ oxidation by H2O2 or the rate of Fe3+OOH mineral formation in the presence of O2, while the D130N mutant showed a 2.4-fold reduction in the initial Fe2+ oxidation rate and a 213% increase in the t1/2 of mineral formation. These effects were compounded in the D121N/D126N/D130N triple mutant, which showed rates of Fe2+ reduction indistinguishable from the protein-free bulk solution; i.e., all catalytic activity was abolished.
Fig. 2 shows that, in our simulations, D130 does not participate in strong protein-ion interactions. As a result, the temporal correlations involving D130 are not particularly strong; it makes only a modest showing in the high-ranking correlations and solutions listed in Table S1, Table S2, and Table S3. The mutagenesis result is also troubling in light of the inconsistent pKa values predicted for D130 based on the crystal structure; these predictions required D130 to be protonated on at least some subunits, making it rather similar to asparagine. In our simulations, the protonation state for D130 was never fully satisfactory—fully unprotonated D130 is improbable based on the calculated pKa values and led to disruption of the quaternary structure because of charge repulsion, while asymmetric protonation (i.e., protonating D130 on only some subunits) led to a loss of the symmetry observed in the crystal structure. Complete protonation was chosen as the least-problematic option, despite its failure to produce strong interactions between ions and D130. It is possible that any assignment of a static protonation state to D130 is an oversimplification; translocation of Fe2+ through the pore may involve dynamic changes in its protonation state which would be impossible to capture using traditional all-atom MD.
While the location of the ferroxidase site in Dps is well known, uncertainty persists about the nucleation site for Fe oxide nanoparticle formation. The situation is somewhat clearer in ferritin (35), where E61, E64, and E67 form a negatively-charged nucleation site distinct from the ferroxidase site. These residues are located on an interior α-helix near the C2 axis; a position homologous to the location of residues E55-E62 in Dps. Cations inside the cage tend to associate strongly with E55 in particular and its proximity to the C2 axis leads to the formation of large negatively-charged patches that could serve as nucleation sites. Another possible nucleation site is E44 and E48; their proximity to the non-ferritinlike C3 axis similarly leads to the formation of a large negative patch.
In summary, we were able to use a novel, to our knowledge, genetic algorithm to extract substantial amounts of information about the temporal sequence of ion-protein interactions from all-atom MD simulations. Our results yield insight into which residues are particularly important for Dps function, and illustrate some of the advantages and limitations of this analytical method. In particular, negatively-charged residues on the cage exterior (Fig. 6) help to funnel ions toward the narrow pore formed by the D130 residues from adjacent subunits, and ions associate with a defined set of residues on the cage interior, which may form a nucleation site for mineral growth (see Table S2 and Table S3). This application of GA to the analysis of MD trajectories may prove to be useful in a variety of other biomolecular systems where a small solute interacts sequentially with sites on a larger biomolecule, such as transmembrane ion channels or pumps.
Acknowledgments
NAMD was developed by the Theoretical and Computational Biophysics Group of the Beckman Institute for Advanced Science and Technology at the University of Illinois at Urbana-Champaign. The authors thank the anonymous reviewers whose comments provoked dramatic improvements in this study.
This work was supported in part by the NASA Astrobiology Institute-Montana State University Astrobiology Biogeocatalysis Research Center (grant No. NNA08CN85A), the Human Frontier Science Program (grant No. RGP61/2007), and the National Science Foundation (grant No. CBET-0709358). High-performance computing was supported by the National Science Foundation through TeraGrid resources provided by the Texas Advanced Computing Center.
Supporting Material
References
- 1.Beckman K.B., Ames B.N. The free radical theory of aging matures. Physiol. Rev. 1998;78:547–581. doi: 10.1152/physrev.1998.78.2.547. [DOI] [PubMed] [Google Scholar]
- 2.Imlay J.A., Linn S. DNA damage and oxygen radical toxicity. Science. 1988;240:1302–1309. doi: 10.1126/science.3287616. [DOI] [PubMed] [Google Scholar]
- 3.Chiancone E., Ceci P., Stefanini S. Iron and proteins for iron storage and detoxification. Biometals. 2004;17:197–202. doi: 10.1023/b:biom.0000027692.24395.76. [DOI] [PubMed] [Google Scholar]
- 4.Liu X., Theil E.C. Ferritins: dynamic management of biological iron and oxygen chemistry. Acc. Chem. Res. 2005;38:167–175. doi: 10.1021/ar0302336. [DOI] [PubMed] [Google Scholar]
- 5.Wiedenheft B., Mosolf J., Douglas T. An archaeal antioxidant: characterization of a Dps-like protein from Sulfolobus solfataricus. Proc. Natl. Acad. Sci. USA. 2005;102:10551–10556. doi: 10.1073/pnas.0501497102. [DOI] [PMC free article] [PubMed] [Google Scholar]
- 6.Gauss G.H., Benas P., Lawrence C.M. Structure of the DPS-like protein from Sulfolobus solfataricus reveals a bacterioferritin-like dimetal binding site within a DPS-like dodecameric assembly. Biochemistry. 2006;45:10815–10827. doi: 10.1021/bi060782u. [DOI] [PMC free article] [PubMed] [Google Scholar]
- 7.Maaty W.S., Wiedenheft B., Bothner B. Something old, something new, something borrowed; how the thermoacidophilic archaeon Sulfolobus solfataricus responds to oxidative stress. PLoS ONE. 2009;4:e6964. doi: 10.1371/journal.pone.0006964. [DOI] [PMC free article] [PubMed] [Google Scholar]
- 8.Yamamoto Y., Poole L.B., Kamio Y. An iron-binding protein, Dpr, from Streptococcus mutans prevents iron-dependent hydroxyl radical formation in vitro. J. Bacteriol. 2002;184:2931–2939. doi: 10.1128/JB.184.11.2931-2939.2002. [DOI] [PMC free article] [PubMed] [Google Scholar]
- 9.Ishikawa T., Mizunoe Y., Yoshida S. The iron-binding protein Dps confers hydrogen peroxide stress resistance to Campylobacter jejuni. J. Bacteriol. 2003;185:1010–1017. doi: 10.1128/JB.185.3.1010-1017.2003. [DOI] [PMC free article] [PubMed] [Google Scholar]
- 10.Ueshima J., Shoji M., Nakayama K. Purification, gene cloning, gene expression, and mutants of Dps from the obligate anaerobe Porphyromonas gingivalis. Infect. Immun. 2003;71:1170–1178. doi: 10.1128/IAI.71.3.1170-1178.2003. [DOI] [PMC free article] [PubMed] [Google Scholar]
- 11.Young M., Willits D., Douglas T. Plant viruses as biotemplates for materials and their use in nanotechnology. Annu. Rev. Phytopathol. 2008;46:361–384. doi: 10.1146/annurev.phyto.032508.131939. [DOI] [PubMed] [Google Scholar]
- 12.Uchida M., Terashima M., Douglas T. A human ferritin iron oxide nano-composite magnetic resonance contrast agent. Magn. Reson. Med. 2008;60:1073–1081. doi: 10.1002/mrm.21761. [DOI] [PubMed] [Google Scholar]
- 13.Uchida M., Willits D.A., Douglas T. Intracellular distribution of macrophage targeting ferritin-iron oxide nanocomposite. Adv. Mater. 2009;21:458–462. [Google Scholar]
- 14.Kang S., Lucon J., Douglas T. Monitoring biomimetic platinum nanocluster formation using mass spectrometry and cluster-dependent H2 production. Angew. Chem. Int. Ed. Engl. 2008;47:7845–7848. doi: 10.1002/anie.200802481. [DOI] [PubMed] [Google Scholar]
- 15.Kang S., Jolley C.C., Douglas T. From metal binding to nanoparticle formation: monitoring biomimetic iron oxide synthesis within protein cages using mass spectrometry. Angew. Chem. Int. Ed. Engl. 2009;48:4772–4776. doi: 10.1002/anie.200900437. [DOI] [PubMed] [Google Scholar]
- 16.Bellapadrona G., Chiaraluce R., Chiancone E. The mutations Lys 114 → Gln and Asp 126→ Asn disrupt an intersubunit salt bridge and convert Listeria innocua Dps into its natural mutant Listeria monocytogenes Dps. Effects on protein stability at Low pH. Proteins. 2007;66:975–983. doi: 10.1002/prot.21305. [DOI] [PubMed] [Google Scholar]
- 17.Ilari A., Latella M.C., Chiancone E. The unusual intersubunit ferroxidase center of Listeria innocua Dps is required for hydrogen peroxide detoxification but not for iron uptake. A study with site-specific mutants. Biochemistry. 2005;44:5579–5587. doi: 10.1021/bi050005e. [DOI] [PubMed] [Google Scholar]
- 18.Bellapadrona G., Stefanini S., Chiancone E. Iron translocation into and out of Listeria innocua Dps and size distribution of the protein-enclosed nanomineral are modulated by the electrostatic gradient at the 3-fold “ferritin-like” pores. J. Biol. Chem. 2009;284:19101–19109. doi: 10.1074/jbc.M109.014670. [DOI] [PMC free article] [PubMed] [Google Scholar]
- 19.Karplus M., McCammon J.A. Molecular dynamics simulations of biomolecules. Nat. Struct. Biol. 2002;9:646–652. doi: 10.1038/nsb0902-646. [DOI] [PubMed] [Google Scholar]
- 20.Forrest S. Genetic algorithms: principles of natural selection applied to computation. Science. 1993;261:872–878. doi: 10.1126/science.8346439. [DOI] [PubMed] [Google Scholar]
- 21.Davis I.W., Leaver-Fay A., Richardson D.C. MolProbity: all-atom contacts and structure validation for proteins and nucleic acids. Nucleic Acids Res. 2007;35(Web Server issue):W375–W383. doi: 10.1093/nar/gkm216. [DOI] [PMC free article] [PubMed] [Google Scholar]
- 22.Guex N., Peitsch M.C. SWISS-MODEL and the Swiss-PDBViewer: an environment for comparative protein modeling. Electrophoresis. 1997;18:2714–2723. doi: 10.1002/elps.1150181505. [DOI] [PubMed] [Google Scholar]
- 23.Phillips J.C., Braun R., Schulten K. Scalable molecular dynamics with NAMD. J. Comput. Chem. 2005;26:1781–1802. doi: 10.1002/jcc.20289. [DOI] [PMC free article] [PubMed] [Google Scholar]
- 24.Gordon J.C., Myers J.B., Onufriev A. H++: a server for estimating pKas and adding missing hydrogens to macromolecules. Nucleic Acids Res. 2005;33(Web Server issue):W368–W371. doi: 10.1093/nar/gki464. [DOI] [PMC free article] [PubMed] [Google Scholar]
- 25.Li H., Robertson A.D., Jensen J.H. Very fast empirical prediction and rationalization of protein pKa values. Proteins. 2005;61:704–721. doi: 10.1002/prot.20660. [DOI] [PubMed] [Google Scholar]
- 26.Zhang L., Hermans J. Hydrophilicity of cavities in proteins. Proteins. 1996;24:433–438. doi: 10.1002/(SICI)1097-0134(199604)24:4<433::AID-PROT3>3.0.CO;2-F. [DOI] [PubMed] [Google Scholar]
- 27.Grubmüller, H. 1996. SOLVATE: a program to create atomic solvent models. http://www.mpibpc.mpg.de/home/grubmueller/downloads/solvate/index.html.
- 28.Humphrey W., Dalke A., Schulten K. VMD: visual molecular dynamics. J. Mol. Graph. 1996;14:33–38. doi: 10.1016/0263-7855(96)00018-5. [DOI] [PubMed] [Google Scholar]
- 29.MacKerell A.D., Bashford D., Karplus M. All-atom empirical potential for molecular modeling and dynamics studies of proteins. J. Phys. Chem. B. 1998;102:3586–3616. doi: 10.1021/jp973084f. [DOI] [PubMed] [Google Scholar]
- 30.Catlett C., Allcock W., Beckman P. HPC and Grids in Action. IOS Press; Amsterdam, The Netherlands: 2007. TERAGRID: analysis of organization, system architecture, and middleware enabling new types of applications. [Google Scholar]
- 31.Apostolakis J., Ferrara P., Caflisch A. Calculation of conformational transitions and barriers in solvated systems: application to the alanine dipeptide in water. J. Chem. Phys. 1999;110:2099–2108. [Google Scholar]
- 32.Young W.M., Elcock E.W. Monte Carlo studies of vacancy migration in binary ordered alloys: I. Proc. Phys. Soc. London. 1966;89:735–746. [Google Scholar]
- 33.Douglas T., Ripoll D.R. Calculated electrostatic gradients in recombinant human H-chain ferritin. Protein Sci. 1998;7:1083–1091. doi: 10.1002/pro.5560070502. [DOI] [PMC free article] [PubMed] [Google Scholar]
- 34.Richens D.T. J. Wiley; Chichester and New York: 1997. The Chemistry of Aqua Ions: Synthesis, Structure, and Reactivity: a Tour through the Periodic Table of the Elements. [Google Scholar]
- 35.Chasteen N.D., Harrison P.M. Mineralization in ferritin: an efficient means of iron storage. J. Struct. Biol. 1999;126:182–194. doi: 10.1006/jsbi.1999.4118. [DOI] [PubMed] [Google Scholar]
Associated Data
This section collects any data citations, data availability statements, or supplementary materials included in this article.