

Abstract
Many amoeboid cells move by extending pseudopods. Here I present a new stochastic model for chemotaxis that is based on pseudopod extensions by Dictyostelium cells. In the absence of external cues, pseudopod extension is highly ordered with two types of pseudopods: de novo formation of a pseudopod at the cell body in random directions, and alternating right/left splitting of an existing pseudopod that leads to a persistent zig-zag trajectory. We measured the directional probabilities of the extension of splitting and de novo pseudopods in chemoattractant gradients with different steepness. Very shallow cAMP gradients can bias the direction of splitting pseudopods, but the bias is not perfect. Orientation of de novo pseudopods require much steeper cAMP gradients and can be more precise. These measured probabilities of pseudopod directions were used to obtain an analytical model for chemotaxis of cell populations. Measured chemotaxis of wild-type cells and mutants with specific defects in these stochastic pseudopod properties are similar to predictions of the model. These results show that combining splitting and de novo pseudopods is a very effective way for cells to obtain very high sensitivity to stable gradient and still be responsive to changes in the direction of the gradient.
Introduction
Eukaryotic cells extend pseudopods for movement (1). Pseudopods are actin-filled protrusions of the cell surface. The size, frequency, position, and directions of the pseudopods form the basis of cell movement, because they determine the speed and trajectory of the cells. Internal or external cues may modify the extension of pseudopods and thereby change the trajectory. Internal cues such as starvation may increase pseudopod frequency (2). The position of the microtubule organizing center may enhance the probability to extend pseudopods nearby (3,4). In addition, external cues such as chemoattractants may induce a bias so that pseudopods are extended more often in the direction of the chemoattractant than in other directions (5,6).
The molecular mechanism for chemotaxis has been studied in detail, mainly starting from the signal: identification of the receptors for the chemoattractant and the temporal and spatial characterization of the signaling responses, and how they modulate the cytoskeleton resulting in directed movement (5). Recently we and others (7–9) have adopted another, complementary, approach that characterizes the end-product of signaling, the pseudopod.
Can we understand cell movement and chemotaxis from the perspective of the extension of pseudopods?
Superficial observations suggest that, in the absence of external cues, pseudopods are extended in random directions (6), but analysis of larger data sets has uncovered a highly ordered pattern of pseudopod extensions (10). Dictyostelium cells, like many other eukaryotic cells, extend two types of pseudopods: de novo at regions devoid of recent pseudopod activity, or by splitting of an existing pseudopod (7,11). Pseudopod splitting occurs very frequently alternating to the right and left at a small angle of ∼55° (10,12). Therefore, a longer series of pseudopod splittings leads to a zig-zag trajectory with strong persistence of direction. In contrast, de novo pseudopods are extended in all directions, have no right/left bias, and effectively induce a random turn of the cells. The presence of pseudopods by splitting and de novo explains very well, both experimentally (2) and theoretically (13), the notion that amoeboid movement in the absence of external cues is described by a so-called correlated random walk (14–18). This tendency to move in the same direction is called persistence, and the duration of the correlation is the persistence time. Wild-type cells extend mainly splitting pseudopods and move with strong persistence, whereas mutants defective in pseudopod splitting extend mostly de novo pseudopods and exhibit a nearly Brownian random walk (2).
The mechanism by which cells use pseudopods to navigate in cAMP gradients is based on this ordered extension of pseudopods in the absence of external cues (7,8,19). In a cAMP gradient, the cell obtains information on the concentration around the cell, which causes a specific bias in the extension of pseudopods. The size and frequency of pseudopod extension is not altered by the cAMP gradient. In contrast, the position on the cell surface where splitting pseudopods emerge is slightly biased toward the side of the cell facing the cAMP gradient. Because pseudopods are extended perpendicular to the cell surface, this bias of position implies that more pseudopods are extended in the direction of cAMP than in other directions. These observations suggest that chemotaxis depends on the probability distributions of pseudopod directions. To understand how chemotaxis is governed by pseudopods we obtained quantitative data on the bias of pseudopod extensions that are induced by cAMP gradients with different steepness. The observed bias by the cAMP gradient is then combined with the intrinsic ordered extension of pseudopods to formulate a new stochastic angular model for chemotaxis.
Methods
Cells
Wild-type AX3 and mutants sgc/pla2-null (20), pkbA/pkbR1-null (21), and sgc/pla2/pkbR1-null cells were grown in HG5 medium (contains per liter: 14.3 g oxoid peptone, 7.15 g bacto yeast extract, 1.36 g Na2HPO4·12H2O, 0.49 g KH2PO4, 10.0 g glucose). The sgc/pla2/pkbR1-null cells were obtained by inactivation of the pkbR1 gene in sgc/pla2-null cells. Cells were harvested in PB (10 mM KH2PO4/Na2HPO4, pH 6.5). Wild-type cells were allowed to develop in 1 mL PB in a well of a six-well plate (Nalge Nunc, Rochester, NY) until the first streams were observed (∼6 h). Mutant cells were starved in suspension, and development was stimulated with pulses of 100 nM cAMP applied each 5 min between 2 and 6 h of starvation.
Chemotaxis in stable spatial gradients
Starved cells were exposed to a cAMP gradient in a modified Zigmond chamber with a bridge of 2-mm width and 1 μM cAMP in the source agar block (22). Cells were observed ∼700 μm from the source for 15 min starting at ∼10 min after the start of the gradient. At these conditions a stable spatial cAMP gradient is established with an absolute spatial gradient of ▿C = 0.5 nM/μm, a relative spatial gradient of ▿C = 0.7% concentration difference across the cell, and a mean concentration of C = 650 nM cAMP.
Chemotaxis in steeper gradients was measured with micropipettes filled with 100 μM cAMP at a pressure of 50 hPa. Within 10 s, a stable spatial gradient is formed with a steepness that depends on the distance x from the pipette according to ▿C = 35,000/x2 nM/μm (23). Chemotaxis data were collected for cells at a distance of ∼25 μm where ▿C = 50 nM/μm and C = 1400 nM, and at a distance of ∼80 μm from the pipette where ▿C = 5 nM/μm and C = 450 nM cAMP.
For chemotaxis to natural waves, AX3 cells were starved in a well of a six-well plate (Nalge Nunc) at a density of 2.5 × 10⁹ cells/m2 submerged with 1 mL of PB. The appearance of cAMP waves was deduced from the surges in speed that are induced by sudden increases of the cAMP concentration (24). The spatial cAMP gradient of natural waves has been estimated from cAMP fluorographs to be ▿C = 7 nM/μm and C = 500 nM (23,24).
Pseudopod analysis
Movies were recorded with an inverted light microscope (model No. CK40 with 20× objective; Olympus, Melville, NY) and images were captured at a rate of 1 frame/s with a charge-coupled device camera (JVC, Wayne, NJ). Images were analyzed with the fully automatic pseudopod-tracking algorithm Quimp3, which is described in detail in Bosgraaf and van Haastert (25). In short, the program uses an active contour analysis to identify the outline of the cell as ∼150 nodes (26). With the convexity and area change of the nodes, extending pseudopods were identified that fulfill the requirement of user-defined minimal number of adjacent convex nodes and minimal area change. The x, y, and time coordinates of the central convex node of the convex area at the start and end of growth were recorded, which identifies the direction of the extending pseudopod. The tangent to the surface at the node where the pseudopod started was calculated by using the position of the adjacent nodes. The automated algorithm annotates each pseudopod as de novo versus splitting using the criterion that the convex area of the new pseudopod exhibits overlap with the convex area of the current pseudopod, or is within a user-defined distance; this annotation also assigns the parental pseudopod from which the new pseudopod was split. The pseudopods were detected using the default parameters of the Quimp3 macro (25).
Statistical analysis of pseudopod angles
The probability density functions of the angles cannot be analyzed as the common distribution on a line, but belong to the family of circular distributions, which are constructed by wrapping the usual distribution on the real line around a circle. The von Mises distribution (vMD), which is the circular analog of the normal distribution, describes reasonably well the probability distributions of the pseudopod angles extended by Dictyostelium cells in buffer (13). The vMD was used in this study on chemotaxis to estimate, by least-square method, the expected mean angle ϕ and its variance σϕ2 (κ = 1/σϕ2), and is given by
| (1) |
where I0(κ) is the modified Bessel function of the first kind of order zero,
| (2) |
Results
The chemotaxis index (Ψ) of cells is defined as the distance moved in the direction of the gradient, divided by the total distance moved, i.e., as the cosine of the angle ϕ of the cell's direction with the gradient. The chemotaxis index of a population of cells is the average of these cosines, Ψ = 〈cosϕ〉. The aim of this study is to find out how cells extend pseudopods in cAMP gradients and how the chemotaxis index depends on these pseudopod extensions.
Maximal possible chemotaxis is related to variance of pseudopod extensions
Previously we have shown that pseudopods are extended perpendicular relative to the tangent to the cell surface (19). Therefore, pseudopods that are extended at the side of the cell facing the highest concentration of the gradient will direct the cell toward the attractant (Fig. 1). Now, consider the point at the cell surface that is closest to source of cAMP. Pseudopods that are extended from this point will have an average angle relative to the gradient of 〈ϕ〉 ≈ 0°. However, the population of pseudopods will exhibit some variance of pseudopod angles (σϕ2), which will lead to a reduction of the forward movement to the gradient. Therefore, the maximal obtainable chemotaxis index is described by the product of cosϕ and observed occurrence of ϕ, i.e.,
where fvMD (0,κ) is the von Mises probability distribution of ϕ with zero expected mean and variance κ = 1/σϕ2 (see Methods). Previously, we have obtained a very good approximation for fvMD (0,κ) cos ϕ if σϕ <40°, yielding
| (3) |
Figure 1.
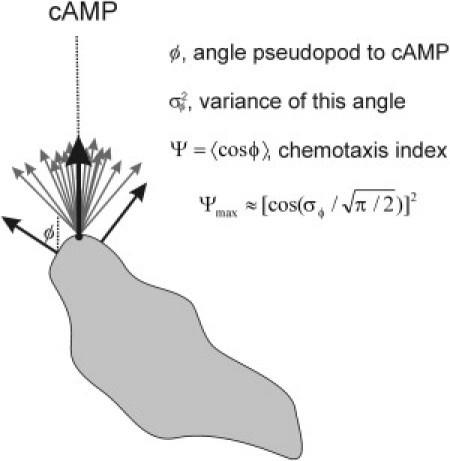
Pseudopod extension and optimal chemotaxis. Pseudopods (see arrows) are extended perpendicular to the cell surface. Therefore, pseudopods at the point of the cell closest to the cAMP source have the highest probability to be extended in the direction of the cAMP gradient. Because the surface curvature at this point is not always exactly perpendicular to the gradient, and because not all pseudopods are extended exactly perpendicular to the surface, some variance of pseudopod direction will be present, σϕ2. This variance reduces the maximal chemotaxis response. With the observed σϕ ∼ 20°, the maximal chemotaxis index is ∼0.9.
For cells in buffer we obtained for splitting and de novo pseudopodia σϕ = 28° (10,13). We observed for splitting pseudopods σϕ = 20° in a shallow cAMP gradient (8) and σϕ = 18° in a steep gradient (data not shown), and for de novo pseudopods σϕ = 26° in a steep gradient (see Fig. 3 B). The observed weighted average is ∼σϕ = 20° for all pseudopodia in steep gradients, which according to Eq. 3 predicts that the maximal obtainable chemotaxis index is Ψ ≈ 0.92. This value is close to the observed maximal chemotaxis index of 0.93 (see Fig. 5 A).
Figure 3.
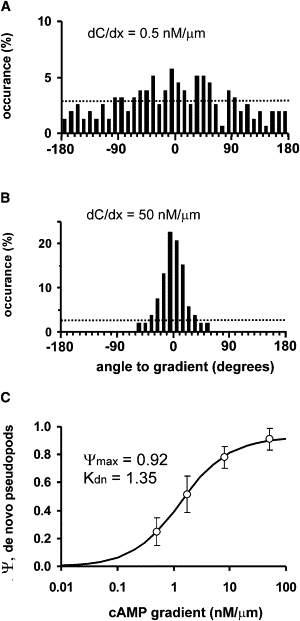
Determination of directional bias of de novo pseudopods. Cells were exposed to a cAMP gradient in a Zigmond chamber (A) or using a micropipette (B). The direction ϕ of the first pseudopod was measured. (A and B) Probability distribution of the angle ϕ of de novo pseudopods relative to the position gradient. The dashed line represents the expected random distribution of angles. (C) Chemotaxis index defined as Ψ = 〈cos ϕ〉, measured in different cAMP gradients. (Data points) Means and 95% confidence limits of ∼150 de novo pseudopods for each cAMP gradient. (Line) Fitted dose-response Eq. 4 with Kdn = 1.35 ± 0.34 nM/μm and maximal chemotaxis ΨmaxAdn = 0.925 ± 0.026. In Fig. 1 it was shown that Ψmax = 0.92, indicating that the maximal bias of de novo pseudopods Adn is close to 1.0.
Figure 5.
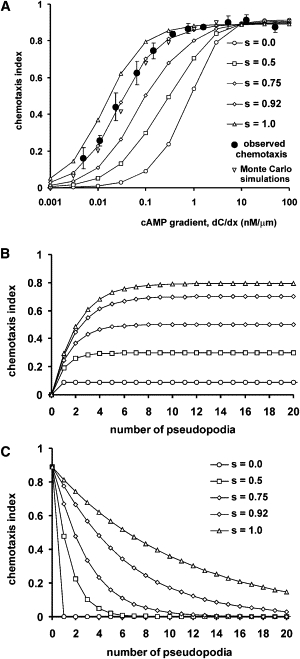
Kinetics and dose-dependency of chemotaxis. (A) The chemotaxis index was calculated with Eq. 5 for cells with different fractions of splitting pseudopods. (Solid symbols) Experimentally observed chemotaxis index for cells (which have s = 0.92 ± 0.02). (Triangle) Chemotaxis index obtained by Monte Carlo simulations (see Fig. S1). (B) Predicted chemotaxis index of cells that are exposed to a new gradient. (C) Predicted chemotaxis index of cells after removal of the gradient.
Analytical stochastic model for chemotaxis
The analytical model is based on the observation of alternating right/left pseudopod splitting, which leads to persistence of direction. Chemotaxis describes the movement of a population of cells over a longer timescale during which several pseudopods are extended. Thus, on a longer timescale, a cell with splitting pseudopods has the tendency to retain the direction of movement, with some deviations due to the variance of pseudopod angles. Fig. 2 presents the basics of the stochastic model for chemotaxis. The current pseudopods are extended with angle ϕn toward the gradient. A fraction (s) of the next pseudopod is splitting, and fractions (1-s) are de novo. In buffer, splitting pseudopods would be extended in the same direction as the previous pseudopod, but the cAMP gradient will impose a bias on this direction. De novo pseudopods are extended in random directions in buffer (〈ϕ〉 = 90°), and also experience a bias by the gradient. As will be shown below in Figs. 3 and 4, the bias is given by the dose-response equation
| (4) |
where ▿C is the steepness of the gradient, Aj is the maximal bias, Kj is the magnitude of the gradient inducing half-maximal bias, and the subscript j indicates splitting (s) or de novo (dn) pseudopods. Finally, the pseudopods are extended with some variance σϕ2, leading to a reduction of the chemotaxis index according to Eq. 3. Therefore, the chemotaxis index after the next pseudopod is given by
| (5) |
With Ψn+1 = cosϕn+1, Eq. 5 describes the evolution of the chemotaxis index at subsequent pseudopods. The values for As, Adn, Ks, and Kdn are obtained below in Figs. 3 and 4.
Figure 2.

Stochastic model for chemotaxis. The current nth pseudopod is extended at an angle ϕn relative to the gradient. The extension of the next pseudopod is conceptually divided in three steps. In the first step, a splitting pseudopod is extended in the same direction as the current pseudopod, while a de novo pseudopod is extended in a random direction. In the second step, the splitting or de novo pseudopod gets a bias of direction due to the cAMP gradient; the bias is different for splitting and de novo pseudopods (see Figs. 3 and 4, and Eq. 4). In the third step, extending pseudopods have a variance of direction. Chemotaxis of a cell population is given by the combined effect of these three steps, as described in Eq. 5.
Figure 4.
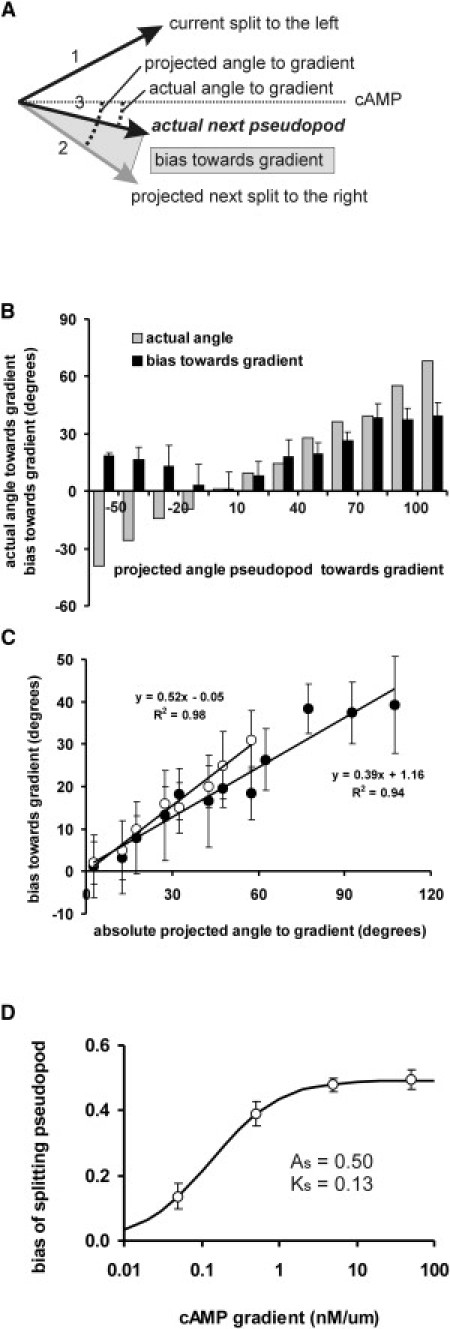
Determination of directional bias of splitting pseudopods. (A) Scheme of measurements. In buffer, splitting pseudopods have a strong tendency to be extended alternating right/left at an angle of 55°. The present pseudopod, 1, is a split to the left, at an angle of x° relative to the gradient. Therefore, the next projected pseudopod, 2, is expected to be extended at an angle of x + 55° relative to the gradient. We measured the angle of actual pseudopod, 3, relative to the gradient, and define the bias as the difference between projected and actual pseudopod. (B) Pseudopod data were binned for the projected angles to the gradient. Measured was the actual angle to the gradient (shaded bars) and the difference with projected angle is the bias (solid bars). (C) The figure shows the bias for a shallow gradient (0.5 nM/μm, solid symbols) and steep gradient (50 nM/μm, open symbols). Linear regression analysis reveals that the intercepts with the y axis are close to zero, which means that the bias is zero if the projected angle is in the direction of the gradient. The slopes are smaller than 1, indicating that the gradient cannot fully bias splitting pseudopods in the direction of the gradient. (D) The bias was measured for different cAMP gradients. (Data points) Means and 95% confidence levels for ∼200 splitting pseudopods for each cAMP gradient. (Line) Fitted dose-response Eq. 4 with Ks = 0.13 ± 0.02 nM/μm and maximal bias As = 0.494 ± 0.007.
Bias of de novo pseudopod extension in a cAMP gradient
In buffer, de novo pseudopods are extended in random directions (10). To deduce the bias imposed by the cAMP gradient, we measured the direction of the first pseudopod that is extended to a new gradient. Fig. 3 A shows that, in a shallow cAMP gradient, de novo pseudopods are extended in many different directions with a somewhat higher probability in the direction of the cAMP gradient. In a steep cAMP gradient, the majority of de novo pseudopods are extended rather well in the direction of the gradient (Fig. 3 B). The population mean and standard deviation of all de novo pseudopods is –0.13 ± 26° in the direction of the steep cAMP gradient. The direction of these pseudopods can also be expressed as the chemotaxis index, Ψ = 〈cosϕ〉, yielding Ψ = 0.9 for this steep gradient. Thus, the bias that is applied by the steep gradient is very strong, such that nearly all de novo pseudopods are extended well in the direction of the cAMP gradient. Experiments were performed in gradients with different steepness (Fig. 3 C). The parameters of the dose-response equation (Eq. 4) were fitted to the data, yielding a half-maximal chemotaxis of de novo pseudopods at a gradient of Kdn = 1.35 ± 0.34 nM/μm (mean and 95% confidence level). The maximal observed chemotaxis index is 0.925 ± 0.026; with the theoretical maximum of Ψmax = 0.92 (compare to Fig. 1), this yields the maximal bias of de novo pseudopods of Adn = 1.0.
Bias of splitting pseudopod extension in a cAMP gradient
In buffer, splitting pseudopods are not extended in random directions, but at a small angle of ∼55° and preferentially alternating to the right and left relative to the previous pseudopod (10). Therefore, the bias of splitting pseudopods cannot be determined by direct measurement of pseudopod directions relative to the gradient, as was done for de novo pseudopods, but can be deduced by comparing the expected direction in buffer with the observed direction in a cAMP gradient. The scheme for the analysis of splitting pseudopods is presented in Fig. 4 A. When the current pseudopod is extended to the left, the next split in buffer is expected to occur to the right at an average angle of 55°. Because we know the angle of the current pseudopod toward cAMP, we can calculate the projected angle of the next pseudopod in buffer. The difference between this projected angle in buffer and the actual angle in a gradient is defined as the bias induced by the cAMP gradient. The results presented in Fig. 4 B show that the bias depends on the angle of the projected pseudopod to cAMP. For instance, when this projected angle is very large to the right relative to the cAMP gradient (e.g., +100°), the actual pseudopod is extended not so far to the right at +60°, implying that it is extended by 40° better toward cAMP. On the other hand, if the projected pseudopod is already in the direction of the gradient, the actual pseudopod is extended in that direction. The data are summarized in Fig. 4 C, demonstrating a linear relationship between the projected angle and the bias induced by the gradient, with a slope of 0.39. This indicates that this shallow cAMP gradient corrects the direction of projected pseudopod such that the actual pseudopod is extended on average ∼40% better toward the cAMP gradient.
In this shallow cAMP gradient of 0.5 nM/μm, cells have suboptimal chemotaxis (the chemotaxis index is ∼0.70). We also measured the extension of splitting pseudopods in very steep cAMP gradient of 50 nM/μm delivered by micropipettes where cells have a chemotaxis index of ∼0.90. The data set presented in Fig. 4 C reveals a linear curve with a slope of 0.52. The experiments were repeated with different cAMP gradients. The parameters of Eq. 4 were fitted to data, yielding As = 0.494 ± 0.007 and Ks = 0.13 ± 0.02 nM/μm (Fig. 4 D).
Comparing de novo and splitting pseudopods, the experiments reveal that splitting pseudopods are biased by ∼10-fold shallower gradients than de novo pseudopods. Furthermore, in very steep gradients de novo pseudopods are positioned well in the direction of the gradient, but the projected angle of splitting pseudopods is biased by maximally 50% in the direction of the gradient. In the Discussion, I comment on the observation that splitting pseudopods are more sensitive to shallow gradients, but have a maximal bias of only 50%.
Model predictions
The model describes cell movement and chemotaxis as a stochastic process that depends on the probabilities of pseudopod extensions in the absence of external cues, and the bias imposed by the cAMP gradient. Because these probabilities have been determined in previous (8,13) and current experiments, Monte Carlo simulations can be used to calculate many trajectories, all equally likely to occur (see the Supporting Material). Fig. S1 in the Supporting Material shows some of these tracks in buffer and in cAMP gradients, revealing better orientation of the cells in steeper gradients. The chemotaxis index was determined using 10,000 simulated tracks for cells in gradients with different steepness. The results reveal that the chemotaxis index predicted by Monte Carlo simulations and by analytical model of Eq. 5 are in excellent agreement with each other (Fig. 5 A and Fig. S1). The analytical model was investigated in further detail.
The sensitivity to different cAMP gradients at steady state is presented in Fig. 5 A for cells with different proportion of splitting and de novo pseudopods. At the experimentally observed value of s = 0.92 (see (8)), the calculated curve closely matches the observed chemotaxis index. In addition, the observed maximal chemotaxis index in steep gradients (Ψ = 0.92) is identical to the theoretical maximum defined by noise Eq. 4 with the observed variance (σϕ = 20°). When cells would extend exclusively de novo pseudopods, the model shows that rather steep cAMP concentrations are required to induce a strong response, and half-maximal chemotaxis is induced at ▿C ∼ 1 nM/μm. With increasing proportion of splitting pseudopods, chemotaxis is induced by more shallow gradients. With only splitting pseudopods, half-maximal chemotaxis is induced by a gradient with ▿C ∼ 0.01 nM/μm. Thus, chemotaxis by splitting pseudopods will occur at ∼100-fold smaller cAMP gradients than by de novo pseudopods. In Figs. 3 C and 4 D, it was shown that splitting pseudopods are biased by ∼10-fold smaller cAMP gradients than de novo pseudopods. The additional ∼10-fold increase of sensitivity is due to the nonlinear relationship of each bias in a series of pseudopod splittings.
The kinetics of the response at a gradient with ▿C = 0.1 nM/μm reveals that the chemotaxis index slowly increases at each subsequent pseudopod to a maximum (Fig. 5 B). This maximum is higher and reached later when more pseudopods are extended by splitting. Because the next splitting pseudopod is extended in a similar direction as its parental pseudopod—with a moderate bias toward the gradient—each subsequent pseudopod becomes better oriented toward the gradient until a steady state is reached.
Upon removal of the chemoattractant, the chemotaxis index decreases (Fig. 5 C). When cells extend only de novo pseudopods, the chemotaxis index immediately drops to zero, because, in the absence of chemoattractant, de novo pseudopods are extended in random directions. In contrast, splitting pseudopods continue to be extended in the direction of the previous pseudopod and therefore the chemotaxis index declines slowly. With the observed fraction of splitting pseudopods in wild-type cells (s = 0.92), it takes ∼6 pseudopods to lose 50% of the initial chemotactic response. A mutant with less splitting, e.g., guanylyl cyclase null cells with s = 0.75 (10), will lose 50% of its initial chemotaxis response after extending two pseudopods. Experiments have shown that wild-type cells will continue movement in the direction of the aggregation center during ∼3 min after passing the cAMP wave, whereas guanylyl cyclase null cells continue only during 1 min (8,27).
Dictyostelium cells in their natural habitat are exposed every ∼5 min to a wave of cAMP. Initially these waves may come from different directions and cells are exposed to successive gradients with unrelated directions. Later, aggregation centers become stabilized and cells are exposed to successive gradients that all come from the same direction. Fig. S2 in the Supporting Material reveals that de novo pseudopodia equally detect gradients from random or established directions, whereas splitting pseudopods have problems to detect random gradients, but are able to detect established gradients very well. This analysis reveals that splitting pseudopodia enhance the sensitivity to chemotax to shallow gradients and increase the period of directional movement after removal of the gradient. The fraction of splitting pseudopods determines the memory of the chemotactic system. However, the penalty of splitting pseudopodia is a slow response to detect fluctuating gradients with different directions.
Signaling mutants with defects in pseudopod splitting and gradient sensing
Four signaling enzymes participate in chemotaxis, PI3K, TorC2, PLA2, and sGC, a soluble guanylyl cyclase (5,20,28,29). Mutants with defects in these pathways were used to inspect the analytical model with respect to the fraction s of splitting pseudopods and the bias induced by the gradient. Previously we have shown that the proteins PI3K and TorC2 enhance the bias of pseudopod extension in the direction of the cAMP gradient, whereas cGMP and PLA2 strongly stimulate pseudopod splitting (8). Chemotaxis and pseudopod formation was analyzed in wild-type cells and three mutants (Table 1). The mutants are generally less polar than wild-type cells with a less pronounced front, leading to a small increase of σϕ from 20° in wild-type cells to ∼25° in most mutants. Mutant sgc/pla2-null cells have strongly reduced pseudopod splitting, but nearly normal Ks and Kdn.
Table 1.
Pseudopod properties and chemotaxis of Dictyostelium mutants
| Wild-type | sgc/pla2-null | pkbA/pkbR1-null | sgc/pla2/pkbR1-null + LY | |
|---|---|---|---|---|
| Observed pseudopod | ||||
| Fraction splitting | 0.92 ± 0.02 | 0.61 ± 0.04 | 0.93 ± 0.02 | 0.55 ± 0.03 |
| σϕ (°) | 20 | 25.5 | 23 | 27 |
| Ks (nM/μm) | 0.13 ± 0.02 | 0.23 ± 0.02 | 1.51 ± 0.27 | 2.85 ± 0.61 |
| Kdn (nM/μm) | 1.35 ± 0.34 | 2.51 ± 0.36 | 8.51 ± 2.13 | 15.61 ± 3.33 |
| Chemotaxis (dC/dx)50 | ||||
| Calculated (pM/μm) | 26 ± 4 | 299 ± 80 | 311 ± 57 | 3231 ± 661 |
| Observed (pM/μm) | 22 ± 4 | 283 ± 1290 | 296 ± 134 | 3588 ± 712 |
Pseudopod properties were measured as described in Bosgraaf and van Haastert (25) and Figs. 1, 3, and 4. The concentration inducing half-maximal chemotaxis (dC/dx)50 was calculated using Eq. 5 with these observed pseudopod parameters. The gradient inducing the observed half-maximal chemotaxis was derived from data presented in Fig. 6. The data show the expected values and 95% confidence levels.
In contrast, mutant pkbA/pkbR1-null cells, which have deleted PI3K and TorC2 targets, exhibit opposite properties with normal pseudopod splitting, but reduced gradient sensing reflected in the increased values of Ks and Kdn. All four signaling pathways are inhibited in the third mutant, sgc/pla2/pkbR1-null in the presence of PI3K inhibitor LY294002; this mutant shows the combination of reduced pseudopod splitting and reduced gradient sensing. Using the experimentally determined pseudopod parameters for s, Ks, and Kdn, Eq. 5 predicts that chemotaxis of the splitting mutant sgc/pla2-null and the gradient sensing mutant pkbA/pkbR1-null will both require ∼10-fold steeper gradients than wild-type. Equation 5 predicts that chemotaxis of the splitting mutant sgc/pla2-null and the gradient sensing mutant pkbA/pkbR1-null will both require ∼10-fold steeper gradients than wild-type cells, exactly as was observed experimentally (Fig. 6). Moreover, mutant sgc/pla2/pkbR1-null with LY294002 with both defects is expected to chemotax only in very steep gradients, as was also observed.
Figure 6.
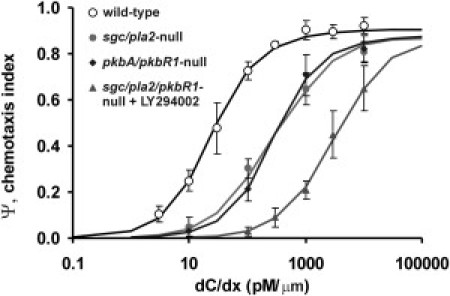
Expected and observed chemotaxis of signaling mutants. Pseudopod properties and chemotaxis was measured in wild-type AX3, mutant sgc/pla2-null with normal bias but reduced pseudopod splitting, mutant pkbA/pkbR1-null with reduced bias but normal pseudopod splitting, and mutant sgc/pla2/pkbR1 in the presence of 60 μM LY294002 with defects in both splitting and bias. The pseudopod properties of the mutants are presented in Table 1. The data points represent the chemotaxis index measured in different cAMP gradients; the lines are not fitted curves, but, instead, are the result of Eq. 5 using the measured pseudopod parameters.
Discussion
The model for chemotaxis, presented here, is firmly based on the ordered extension of pseudopods in the absence of chemoattractants. Cells in the absence of external cues do not extend pseudopods randomly in time or direction (7,9,10). A new pseudopod emerges preferentially just after the previous pseudopod has stopped growth. Furthermore, and importantly, the position at the cell surface where this new pseudopod emerges is highly biased. When the current pseudopod has been extended to the left relatively to the previous pseudopod, the next pseudopod emerges preferentially nearby the tip at the right side of the current pseudopod. The probability that a new pseudopod is extended de novo somewhere at the cell body is ∼20-fold lower than a pseudopod appearing at the present pseudopod by splitting (probability calculated per μm circumference of the cell). We have shown that cGMP inhibits pseudopod formation in the cell body, while PLA2 signaling stimulated pseudopod splitting (10).
The gradient of chemoattractant induces a positional bias of pseudopod formation, but has no effect on pseudopod size or frequency (7,8). This suggests that the gradient affects the position on the surface where the pseudopods emerge, but that the emerging pseudopods follow their endogenous repertoire of extension, growth termination, and start of a new pseudopod. Such a behavior is typical for self-organizing structures, in which an external signal may trigger the onset reaction but has no effects on the subsequent processes of the structure that are organized by internal control mechanisms (30). It has been suggested that Dictyostelium cells chemotax by pseudopod-splitting through bifurcation in random directions, followed by retraction of the pseudopod that is oriented in the worst direction relative to the gradient (7). Our previous and current data suggest that this model is correct for only a small fraction of pseudopodia (∼10% of the pseudopodia in our experiments). However, polarized cells have often only one extending pseudopod that was formed at the side of an existing pseudopod. Our data clearly demonstrate that these new pseudopods are not extended in a random direction but exhibit a directional bias that is imposed by the gradient of chemoattractant. The small fraction of orientation mediated by selective retraction has not been incorporated in this model.
The cAMP gradient has different effects on splitting pseudopods and on pseudopods formed de novo. The cAMP gradient can, on average, bias the direction of pseudopod splitting by maximally ∼50% toward the gradient, and this bias occurs at very shallow cAMP gradients (half-maximal effect at ∼0.13 nM cAMP/μm). In contrast, a cAMP gradient can bias the direction of a de novo pseudopod splitting maximally 100% toward the gradient, but this requires a much steeper cAMP gradient (half-maximal effect at ∼1.4 nM cAMP/μm).
These differences in sensitivity between splitting and de novo pseudopods may be inherent to the part of the cell where these pseudopods are formed: A de novo pseudopod is extended from the cell body, an area in which pseudopod extension is generally inhibited by cGMP signaling. Therefore, steep gradients are required to overcome this inhibition. In contrast, a splitting pseudopod emerges in an activated region of the cell. The cAMP gradient induces the formation of local signaling molecules such as PIP3 that combine with these endogenous activators, which may explain why very shallow cAMP gradients can already bias the direction of a splitting pseudopod. The reason why the bias of pseudopod splitting is maximally only 50% in the direction of the gradient is most likely related to the geometry of a pseudopod-containing cell and the fact that pseudopods are extended always perpendicular to the surface, by which an average splitting pseudopod cannot be extended at an angle >∼70°.
When the present pseudopod is not well oriented (e.g., at 120°), there are two possibilities.
First, the next pseudopod is extended correctly in the direction of the gradient, which is only possible when the pseudopod emerges from the cell body, and is thus a de novo pseudopod.
Second, the next pseudopod is a splitting pseudopod that emerges at the base of the present pseudopod, and is then oriented not exactly toward the gradient (in other words, it is no longer perpendicular to the surface).
In very steep gradients the chemotaxis index reaches a maximum of ∼0.9. Even though the mean direction of pseudopod formation may be exactly in the direction of the gradient, pseudopod extension has a significant variance σϕ2, which reduces the chemotactic index. The maximal chemotaxis index is
The variance of pseudopod direction is σϕ = 28° in buffer, which is mainly caused by the somewhat irregular shape of the cell by which pseudopods perpendicular to the cell surface at some point on the cell are positioned in somewhat different directions. We expected that the variance of pseudopod angles may become smaller in a cAMP gradient, because chemotaxing cells have a more regular spherical shape. Indeed, we observed σϕ = 20° for splitting pseudopods in a shallow cAMP gradient (▿C = 0.1 nM/μm), and σϕ = 18° in a steep cAMP gradient (▿C = 50 nM/μm), which, according to Eq. 4, improves chemotaxis by ∼10%.
Recently we have shown that Dictyostelium ddia2-null cells have a very irregular shape leading to a large variance (σϕ = 46°) and diminished chemotaxis (19). The model reveals two additional important components for chemotaxis in addition to this variance of pseudopod extension—the fraction of splitting pseudopods and the bias of pseudopod extension. Chemoattractant suppresses de novo pseudopodia, thereby enhancing splitting pseudopods, with the benefit for chemotaxis. Mutants suggest that suppression of de novo pseudopods is caused by cGMP-mediated myosin filament formation in the rear and at the sides of the cell, whereas pseudopod splitting is stimulated by PLA2 signaling through an unknown mechanism. These signaling molecules are probably formed in the cytoplasm and contain mainly temporal information.
Three other signaling proteins, sGC, PI3K, and TorC2 are localized or activated at the side of the cell facing the chemoattractant, and increase the probability that a new pseudopod is formed at those locations. This new pseudopod can be either splitting or de novo, depending upon whether the cell body or the current pseudopod is facing the gradient. Mutants with deletions in these genes need steeper gradients for chemotaxis, both for de novo and for splitting pseudopods. The model suggests that identification of the effects of these signaling pathways on the fraction of splitting pseudopods and the bias of pseudopod extension is sufficient to explain their effects on chemotaxis. The current model is based on the ordered extension of pseudopodia in buffer, which must have an underlying mechanism not investigated here. The experimental observations on the stochastic extension of pseudopodia in buffer and cAMP gradients presented here and elsewhere (7,8,10,13) can be used to evaluate fundamental models describing the self-organization of pseudopodia.
The sensitivity of spatial sensing depends on the ability of the cell to accurately detect small differences of cAMP concentration in space and to transduce this difference into the extension of a pseudopod in the direction of the gradient (5,31). Previously we proposed that the sensitivity of chemotaxis may improve when spatial sensing is averaged over space and time to reduce stochastic noise of cAMP-binding and transduction (32). We argued that the optimal integration area is ∼2–4 μm, the size of a pseudopod. This distance is reached in ∼10 s with a slow diffusing molecule such as PIP3. With a lifetime of the cAMP-receptor complex of ∼1 s, this implies that a cell can sample the concentration of extracellular cAMP ∼10-fold without losing spatial information. Longer averaging times would lead to excessive diffusion of PIP3 and loss of spatial information. Our analysis suggests that averaging can also take place at the level of the cytoskeleton through the extension of splitting pseudopods. Alternating right/left splitting pseudopods provide a mechanism for persistent migration. As was shown in Fig. 6 C, the directional memory of splitting pseudopods is ∼5 pseudopods, which are extended during ∼100 s. This suggests that Dictyostelium cells integrate spatial information over prolonged periods of time, ∼1 s for cAMP-receptor interaction, up to ∼10 s with diffusible transducers, and up to ∼100 s with pseudopod splitting. The receptor noise declines with the square-root of integration time (32). Therefore, these complementary integration mechanisms strongly reduce stochastic noise and enhance the sensitivity of the chemotactic system ∼10-fold.
In summary, the stochastic angular model for chemotaxis is based on:
-
1.
An intrinsic cycle of self-organizing pseudopods.
-
2.
The extension of alternating right/left splitting pseudopods, and the extension of de novo pseudopods in more random directions.
-
3.
A bias of the position and direction of pseudopod extension by the cAMP gradient.
-
4.
Integration of directional information using the memory of the splitting pseudopod.
-
5.
The ability to sense shallow gradients by the splitting pseudopod, due to its high sensitivity to induce a bias of direction and its memory to integrate spatial information.
If pseudopod splitting is so effective for chemotaxis, why do cells occasionally extend a de novo pseudopod?
Experiments on chemotaxis to natural cAMP waves may provide an answer. During the aggregation process, which lasts ∼2 h, cells are exposed to ∼20 cAMP waves. Initially, the positions of aggregation centers are not well defined, and a cell is often stimulated by successive cAMP waves that originate from different positions. These early cells are not strongly polarized; they easily extend de novo pseudopods, and use these de novo pseudopods to follow each cAMP wave. After ∼15 cAMP waves, aggregation centers are well established, by which a cell is exposed to ∼5 cAMP waves that all come from the same direction. These late cells have a strong internal polarity; they extend very few de novo pseudopods, and follow the gradient mainly by pseudopod splitting. This suggest that cells use pseudopod splitting to optimally respond to established gradients, while they use de novo pseudopods as a safeguard to respond with lower sensitivity to gradients with a new orientation.
Acknowledgments
I thank Rick Firtel for providing Dictyostelium mutant pkbA/pkbR1-null, Wouter Van Egmond for mutant sgc/pla2/pkbR1-null, and Ineke Keizer-Gunnink for recording movies.
Supporting Material
References
- 1.Pollard T.D. The cytoskeleton, cellular motility and the reductionist agenda. Nature. 2003;422:741–745. doi: 10.1038/nature01598. [DOI] [PubMed] [Google Scholar]
- 2.Van Haastert P.J.M., Bosgraaf L. Food searching strategy of amoeboid cells by starvation induced run length extension. PLoS ONE. 2009;4:e6814. doi: 10.1371/journal.pone.0006814. [DOI] [PMC free article] [PubMed] [Google Scholar]
- 3.Ueda M., Ogihara S. Microtubules are required in amoeba chemotaxis for preferential stabilization of appropriate pseudopods. J. Cell Sci. 1994;107:2071–2079. doi: 10.1242/jcs.107.8.2071. [DOI] [PubMed] [Google Scholar]
- 4.Takesono A., Heasman S.J., Ridley A.J. Microtubules regulate migratory polarity through Rho/ROCK signaling in T cells. PLoS ONE. 2010;5:e8774. doi: 10.1371/journal.pone.0008774. [DOI] [PMC free article] [PubMed] [Google Scholar]
- 5.Swaney K.F., Huang C.H., Devreotes P.N. Eukaryotic chemotaxis: a network of signaling pathways controls motility, directional sensing, and polarity. Annu. Rev. Biophys. 2010;278:20445–20448. doi: 10.1146/annurev.biophys.093008.131228. [DOI] [PMC free article] [PubMed] [Google Scholar]
- 6.Van Haastert P.J.M., Devreotes P.N. Chemotaxis: signaling the way forward. Nat. Rev. Mol. Cell Biol. 2004;5:626–634. doi: 10.1038/nrm1435. [DOI] [PubMed] [Google Scholar]
- 7.Andrew N., Insall R.H. Chemotaxis in shallow gradients is mediated independently of PtdIns 3-kinase by biased choices between random protrusions. Nat. Cell Biol. 2007;9:193–200. doi: 10.1038/ncb1536. [DOI] [PubMed] [Google Scholar]
- 8.Bosgraaf L., Van Haastert P.J.M. Navigation of chemotactic cells by parallel signaling to pseudopod persistence and orientation. PLoS ONE. 2009;4:e6842. doi: 10.1371/journal.pone.0006842. [DOI] [PMC free article] [PubMed] [Google Scholar]
- 9.Xiong Y., Kabacoff C., Iglesias P.A. Automated characterization of cell shape changes during amoeboid motility by skeletonization. BMC Syst. Biol. 2010;4:33. doi: 10.1186/1752-0509-4-33. [DOI] [PMC free article] [PubMed] [Google Scholar]
- 10.Bosgraaf L., Van Haastert P.J.M. The ordered extension of pseudopodia by amoeboid cells in the absence of external cues. PLoS ONE. 2009;4:e5253. doi: 10.1371/journal.pone.0005253. [DOI] [PMC free article] [PubMed] [Google Scholar]
- 11.Bosgraaf L., Keizer-Gunnink I., Van Haastert P.J. PI3-kinase signaling contributes to orientation in shallow gradients and enhances speed in steep chemoattractant gradients. J. Cell Sci. 2008;121:3589–3597. doi: 10.1242/jcs.031781. [DOI] [PubMed] [Google Scholar]
- 12.Li L., Nørrelykke S.F., Cox E.C. Persistent cell motion in the absence of external signals: a search strategy for eukaryotic cells. PLoS ONE. 2008;3:e2093. doi: 10.1371/journal.pone.0002093. [DOI] [PMC free article] [PubMed] [Google Scholar]
- 13.Van Haastert P.J.M. A model for a correlated random walk based on the ordered extension of pseudopodia. PLOS Comput. Biol. 2010;6:e1000874. doi: 10.1371/journal.pcbi.1000874. [DOI] [PMC free article] [PubMed] [Google Scholar]
- 14.Patlak C.S. Random walk with persistence and external bias. Bull. Math. Biophys. 1953;15:311–338. [Google Scholar]
- 15.Potel M.J., Mackay S.A. Preaggregative cell motion in Dictyostelium. J. Cell Sci. 1979;36:281–309. doi: 10.1242/jcs.36.1.281. [DOI] [PubMed] [Google Scholar]
- 16.Gail M.H., Boone C.W. The locomotion of mouse fibroblasts in tissue culture. Biophys. J. 1970;10:980–993. doi: 10.1016/S0006-3495(70)86347-0. [DOI] [PMC free article] [PubMed] [Google Scholar]
- 17.Codling E.A., Plank M.J., Benhamou S. Random walk models in biology. J. R. Soc. Interface. 2008;5:813–834. doi: 10.1098/rsif.2008.0014. [DOI] [PMC free article] [PubMed] [Google Scholar]
- 18.Hall R.L. Amoeboid movement as a correlated walk. J. Math. Biol. 1977;4:327–335. doi: 10.1007/BF00275081. [DOI] [PubMed] [Google Scholar]
- 19.Van Haastert P.J.M., Bosgraaf L. The local cell curvature guides pseudopodia towards chemoattractants. HFSP J. 2009;3:282–286. doi: 10.2976/1.3185725. [DOI] [PMC free article] [PubMed] [Google Scholar]
- 20.Veltman D.M., Keizer-Gunnik I., Van Haastert P.J.M. Four key signaling pathways mediating chemotaxis in Dictyostelium discoideum. J. Cell Biol. 2008;180:747–753. doi: 10.1083/jcb.200709180. [DOI] [PMC free article] [PubMed] [Google Scholar]
- 21.Meili R., Ellsworth C., Firtel R.A. A novel Akt/PKB-related kinase is essential for morphogenesis in Dictyostelium. Curr. Biol. 2000;10:708–717. doi: 10.1016/s0960-9822(00)00536-4. [DOI] [PubMed] [Google Scholar]
- 22.Veltman D.M., Van Haastert P.J.M. Guanylyl cyclase protein and cGMP product independently control front and back of chemotaxing Dictyostelium cells. Mol. Biol. Cell. 2006;17:3921–3929. doi: 10.1091/mbc.E06-05-0381. [DOI] [PMC free article] [PubMed] [Google Scholar]
- 23.Postma M., van Haastert P.J. Mathematics of experimentally generated chemoattractant gradients. Methods Mol. Biol. 2009;571:473–488. doi: 10.1007/978-1-60761-198-1_31. [DOI] [PubMed] [Google Scholar]
- 24.Tomchik K.J., Devreotes P.N. Adenosine 3′,5′-monophosphate waves in Dictyostelium discoideum: a demonstration by isotope dilution-fluorography. Science. 1981;212:443–446. doi: 10.1126/science.6259734. [DOI] [PubMed] [Google Scholar]
- 25.Bosgraaf L., van Haastert P.J.M. Quimp3, an automated pseudopod-tracking algorithm. Cell Adh. Migr. 2009;4:46–55. doi: 10.4161/cam.4.1.9953. [DOI] [PMC free article] [PubMed] [Google Scholar]
- 26.Bosgraaf L., van Haastert P.J.M., Bretschneider T. Analysis of cell movement by simultaneous quantification of local membrane displacement and fluorescent intensities using Quimp2. Cell Motil. Cytoskeleton. 2009;66:156–165. doi: 10.1002/cm.20338. [DOI] [PubMed] [Google Scholar]
- 27.Veltman D.M., van Haastert P.J.M. The role of cGMP and the rear of the cell in Dictyostelium chemotaxis and cell streaming. J. Cell Sci. 2008;121:120–127. doi: 10.1242/jcs.015602. [DOI] [PubMed] [Google Scholar]
- 28.Chen L., Iijima M., Devreotes P.N. PLA2 and PI3K/PTEN pathways act in parallel to mediate chemotaxis. Dev. Cell. 2007;12:603–614. doi: 10.1016/j.devcel.2007.03.005. [DOI] [PMC free article] [PubMed] [Google Scholar]
- 29.Kamimura Y., Xiong Y., Devreotes P.N. PIP3-independent activation of TorC2 and PKB at the cell's leading edge mediates chemotaxis. Curr. Biol. 2008;18:1034–1043. doi: 10.1016/j.cub.2008.06.068. [DOI] [PMC free article] [PubMed] [Google Scholar]
- 30.Karsenti E. Self-organization in cell biology: a brief history. Nat. Rev. Mol. Cell Biol. 2008;9:255–262. doi: 10.1038/nrm2357. [DOI] [PubMed] [Google Scholar]
- 31.Kay R.R., Langridge P., Hoeller O. Changing directions in the study of chemotaxis. Nat. Rev. Mol. Cell Biol. 2008;9:455–463. doi: 10.1038/nrm2419. [DOI] [PubMed] [Google Scholar]
- 32.van Haastert P.J.M., Postma M. Biased random walk by stochastic fluctuations of chemoattractant-receptor interactions at the lower limit of detection. Biophys. J. 2007;93:1787–1796. doi: 10.1529/biophysj.107.104356. [DOI] [PMC free article] [PubMed] [Google Scholar]
Associated Data
This section collects any data citations, data availability statements, or supplementary materials included in this article.