

Abstract
We investigated self-adhesion between highly negatively charged aggrecan macromolecules extracted from bovine cartilage extracellular matrix by performing atomic force microscopy (AFM) imaging and single-molecule force spectroscopy (SMFS) in saline solutions. By controlling the density of aggrecan molecules on both the gold substrate and the gold-coated tip surface at submonolayer densities, we were able to detect and quantify the Ca2+-dependent homodimeric interaction between individual aggrecan molecules at the single-molecule level. We found a typical nonlinear sawtooth profile in the AFM force-versus-distance curves with a molecular persistence length of lp = 0.31 ± 0.04 nm. This is attributed to the stepwise dissociation of individual glycosaminoglycan (GAG) side chains in aggrecans, which is very similar to the known force fingerprints of other cell adhesion proteoglycan systems. After studying the GAG-GAG dissociation in a dynamic, loading-rate-dependent manner (dynamic SMFS) and analyzing the data according to the stochastic Bell-Evans model for a thermally activated decay of a metastable state under an external force, we estimated for the single glycan interaction a mean lifetime of τ = 7.9 ± 4.9 s and a reaction bond length of xβ = 0.31 ± 0.08 nm. Whereas the xβ-value compares well with values from other cell adhesion carbohydrate recognition motifs in evolutionary distant marine sponge proteoglycans, the rather short GAG interaction lifetime reflects high intermolecular dynamics within aggrecan complexes, which may be relevant for the viscoelastic properties of cartilage tissue.
Introduction
The large aggregating chondroitin sulfate proteoglycan (aggrecan) is a member of the hyaluronan (HA)-binding proteoglycan family and a major structural component of the extracellular matrix (ECM) of all cartilaginous tissues (1). The proteoglycan monomer consists of a core protein (cp) of ∼300 kDa that is organized into three globular domains—G1 (amino terminus), G2, and G3 (carboxy terminus)—separated by a linear glycosaminoglycan (GAG) region to which chondroitin sulfate (CS) and keratan sulfate (KS) GAG chains are attached, thus giving rise to its characteristic bottle-brush structure (Fig. 1). Upon noncovalent association of its G1 domain with a ∼45 kDa linking protein (lp) and HA, large molecular networks form in the ECM. Due to its extreme content of negatively charged polysaccharide GAG chains, which contribute an excess of ∼104 negative charges to aggrecan and a couple of orders of magnitude more to the aggregate, an environment of high osmotic pressure is created that together with the robust collagen fibers is responsible for the extreme biomechanical properties of cartilage tissues with resistance to compressive and shear forces and high tensile strength (2,3).
Figure 1.
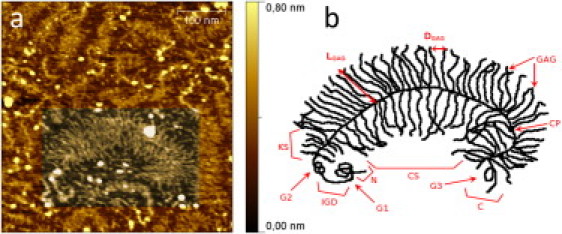
(a) High-resolution AFM image of isolated aggrecan monomers on a silanized mica surface, where the bottle-brush structure of the macromolecules is clearly visible. (b) Schematic diagram of aggrecan structure: N, amino-terminus; cp, core protein; G1, G2, G3, globular domains of cp; IGD, interglobular domain of cp (between G1 and G2); KS, keratan sulfate region; CS, chondroitin sulfate region; GAG, glycosaminoglycan chains; C, carboxy-terminus; DGAG = 5.22 ± 1.45 nm, average spacing between individual GAG chains; LGAG = 48.35 ± 11.85 nm, average GAG chain length.
Aggrecan, one of the most widely studied proteoglycans, has already been investigated in solution by numerous biophysical and biochemical ensemble methods (4–6). Electron microscopy (7,8) and atomic force microscopy (AFM) (9) have contributed considerably to our current knowledge about the molecular structure of aggrecan at nanometer resolution, with the latter method even providing data obtained under native conditions. To understand the unique (nano)mechanical properties of aggrecan, investigators have conducted experiments on its nanoscale conformation and compressibility (10), as well as interaction and self-adhesion experiments using microcontact printing preparative concepts and colloidal force spectroscopy (11,12). The latter approach provided distinct evidence that aggrecan undergoes a Ca2+-mediated self-adhesion even in the presence of strong electrostatic repulsion under physiological conditions, an effect that could be important for the integrity and function of cartilage tissue in vivo (13,14).
In this work, we used AFM single-molecule force spectroscopy (AFM-SMFS) to quantify the Ca2+-dependent homodimeric interaction between individual aggrecan molecules at the single-molecule level and under physiological conditions. In contrast to the work of Han et al. (12), in which a special emphasis was put on probing dense aggrecan surface layers, thus precluding the acquisition of single-molecule information, we investigated surface-immobilized bovine aggrecan macromolecules at low surface coverage, which allowed us to quantify the self-adhesive interaction at the single-molecule level. We were able to interpret the data obtained within the theoretical framework of the stochastic Bell-Evans model, in which the dissociation of a molecular complex is considered as the activated decay of a metastable state. We compare the extracted kinetic off-rate constant of the GAG-GAG interaction, as well as its lifetime and reaction length, with single-molecule data from another proteoglycan system, which is responsible for Ca2+-dependent cell adhesion in marine sponges (15,16). Finally, we discuss the possible biomechanical consequences with respect to the physiological role of this interaction in cartilage function.
Materials and Methods
Purified and lyophilized aggrecan from bovine articular cartilage with a molecular mass of >2.5 MDa (Sigma-Aldrich, Munich, Germany) was dissolved to a concentration of 0.3 mg/mL in Milli-Q water (18.2 MΩ⋅cm; Millipore, Eschborn, Germany). For the SMFS experiments we used a 100 mM NaCl + 10 mM calcium chloride solution at pH = 5.6. For control experiments we replaced the binding saline solution with Ca2+-free 100 mM NaCl + 15 mM EDTA/Tris buffer (pH = 5.6) that was allowed to equilibrate for 8 h at 4°C. To check the calcium specificity, we additionally used a 100 mM NaCl saline solution as well as a 100 mM NaCl solution supplemented with 10 mM magnesium chloride.
AFM imaging was done at a line scan rate of 1–2 Hz and 512×512 image resolution under ambient conditions in tapping mode of operation by using standard monolithic Si cantilevers with f∼300 kHz and k∼40 N/m (Tap300AI; NanoAndMore, Wetzlar, Germany) on a commercial instrument (Multimode Nanoscope IIIa; Veeco, Santa Barbara, CA). Substrate muscovite mica surfaces (Plano, Wetzlar, Germany) were gas-phase silanized with aminopropyltriethoxysilane (Sigma-Aldrich, Munich, Germany) in an exsiccator according to previously described procedures (17) and overlaid with 50 μL aggrecan solution (0.3 mg/mL) for 15 min at room temperature. Subsequently, the samples were washed with Milli-Q water and dried under N2 flow.
The SMFS experiments in saline solution were performed with a commercial AFM instrument (MFP-3D-BIO; Asylum Research, Santa Barbara, CA) at room temperature, using soft rectangular silicon nitride cantilevers with f∼37 kHz and k∼0.03 N/m (BL-RC150VB Biolevers; Olympus, Tokyo, Japan). Aggrecan molecules were attached presumably through their 14 cp disulfides contained in the three globular domains (18) to the gold-coated AFM cantilevers and to ultraflat gold surfaces prepared according to the template-stripped gold method (19) by incubating the surfaces with aggrecan solution (0.3 mg/mL) for 1 h. After incubation, the functionalized substrates and tips were rinsed several times with the respective saline solution to remove loosely bound molecules. The tips and surfaces were either used immediately or stored in saline solution at 4°C, allowing reproducible experiments for at least 96 h. The spring constants of every AFM cantilever were individually determined by means of the thermal noise method (20) with an absolute uncertainty of ∼5%. For better reproducibility, the same cantilever was used repeatedly for the different conditions assayed in each experiment. Typically, 1000–2000 force-distance curves were acquired under identical conditions and analyzed with custom-made MATLAB-based analysis software (The MathWorks, Natick, MA) to calculate molecular adhesion forces, elasticities, and adhesion energies.
For dynamic SMFS (DSMFS) experiments, the retraction velocities of the AFM cantilever were varied between 100 and 5000 nm/s, whereas the experimental approaching velocity was kept constant. The respective molecular loading rates were calculated by multiplying these experimental velocities by the measured molecular elasticities that were determined from the force curve graphs (21). All data were consecutively analyzed according to the stochastic Bell-Evans model of a forced dissociation under an external load (22,23).
Results and Discussion
AFM imaging of immobilized aggrecan molecules
To determine structural appearance and integrity, and to estimate the molecular density of the aggrecan molecules on the surface, we first imaged the immobilized molecules by AFM. In Fig. 1 a, several isolated aggrecan monomers can be observed in a 400 × 400 nm2 AFM top-view image. One single molecule from the lower half of the image is graphically highlighted and serves for the representative graphical sketch in Fig. 1 b. The image clearly shows the bottle-brush structure of the macromolecule, in agreement with the known aggrecan structure as determined by electron microscopy (1,24). From this image, an overall dimension of ∼500 × 100 nm2 (Laggrecan × Waggrecan) for the extended aggrecan molecule could be determined, with an average GAG chain length of LGAG = 48.35 ± 11.85 nm and an average spacing of DGAG = 5.22 ± 1.45 nm between individual GAG chains.
Force spectroscopy of aggrecan-aggrecan self-adhesion
The self-adhesion between the aggrecan macromolecules was then investigated by AFM-SMFS according to the scheme given in Fig. 2 a. Fig. 2, b and c, show two typical force-versus-distance curves that were measured in the calcium-containing binding solution. Both curves exhibit a nonlinear sawtooth force pattern while the aggrecan-functionalized cantilever is withdrawn from the aggrecan-functionalized gold surface. Very similar force-versus-distance curves have been reported for other proteoglycan systems. In a study of cell-adhesion aggregation factors in marine sponges (15), the observed sawtooth force pattern was attributed to the sequential dissociation of individual glycan bonds under an external force. The measured overall contour lengths, Lc, in the force-versus-distance curves for aggrecan were typically found in a range of 50–300 nm corresponding to about one to six GAG chain lengths, LGAG, and reflect the unknown and stochastic point of aggrecan fixation on the gold surface. The sawtooth force profile can therefore be explained as the stepwise elongation of the molecular contour length due to sequential dissociations of individual GAG-GAG pairs. The average distance between two adjacent peaks was analyzed and found to be ∼10–40 nm. In contrast to single-molecule protein unfolding experiments (25), where the individual force peaks are uniform in length and can be related unambiguously to the genetically fixed amino acid sequence, here the observed force peaks are somewhat nonuniform in length and display the slight size heterogeneity of the probed aggrecans (see also Fig. 1 a). Molecular elasticities were determined as a fit to the measured force curve just before the individual point of dissociation (see green line in Fig. 2 b) (21) and found to be within a range of 15.4–19.8 pN/nm. An overall fit of the individual nonlinear sawtooth-profiles to the worm-like chain elasticity model yielded a relatively narrow distribution of measured persistence lengths of lp = 0.31 ± 0.04 nm. This value compares favorably with published values from other proteoglycan systems (0.47 nm), such as the cell-adhesion aggregation factors in marine sponges (26).
Figure 2.
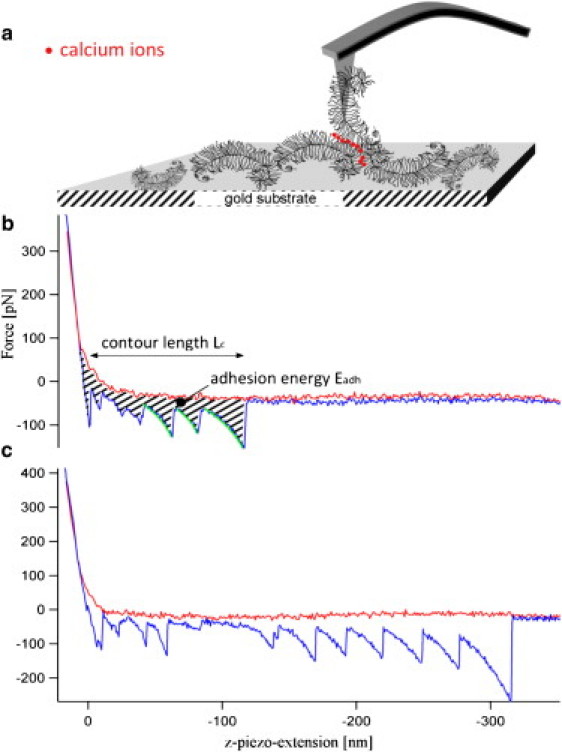
(a) Illustration of calcium-mediated self-adhesion interaction in an AFM-SMFS experiment between aggrecan monomers immobilized on a gold-coated tip and gold substrate surface. (b) Typical force-versus-distance curve of an aggrecan self-adhesion interaction obtained in calcium-containing solution. The red and blue parts of the force-versus-distance curve respectively show the approach and withdrawal of the tip with a sawtooth force pattern. The hatched area represents the adhesion energy Eadh, and the green part of the force-versus-distance curve corresponds to the fit of the respective molecular elasticities. Contour length Lc relates to the distance from surface contact to a force-free cantilever. (c) Another example of a typical force-versus-distance curve, with a longer contour length Lc. This difference is due to the random fixation of aggrecan on the gold surface.
The importance of Ca2+ for the self-adhesion interaction between aggrecan molecules was previously reported for nanopatterned and closely packed two-dimensional aggrecan ensembles in a study using colloidal force spectroscopy (12). We investigated this issue at the single-molecule level with our AFM-SMFS setup under different saline solution conditions to determine how the observed mesoscopic property translates to the level of molecular individuals. Fig. 3 a shows a histogram in which we plotted the probability of the adhesion energies measured in calcium-containing binding solution. The adhesion energy Eadh was determined by integrating the area under a single-molecule force-versus-distance curve (Fig. 2 b). We found typical single-molecule adhesion energies of Eadh = 3–15 aJ at a binding probability of >80%. These energies are about two orders of magnitude smaller than those observed by colloidal force spectroscopy (12) and reflect the fact that fewer molecules are probed in AFM-SMFS experiments. When we switch to EDTA buffer, which complexes all Ca2+ ions, we find a clear change in the measured Eadh histograms. The activity level or binding probability drops by 55% to a residual binding probability of 26% (Fig. 3 b). We were able to reactivate the aggrecan self-adhesion interaction to a binding probability of ∼50% by switching back again to the original binding solution after thoroughly washing the surfaces, thus proving the specificity of Ca2+-mediated self-adhesion at the single-molecule level. Here, it is important to note that the absolute binding probability numbers depend not only on the molecular binding activity, but also on the aggrecan surface and tip coverage. Therefore, control experiments must be conducted with identical sample surfaces and AFM tips to allow a proper estimate of the relative changes in binding probability. Of interest, this somewhat limited reduction of the measured activity level (from 81% to 26%) is conceptually similar to previous results obtained in sponge proteoglycan, where, in contrast to the macroscopic observation, only a very weak dependence of the force histograms on ionic strength could be verified at the single-molecule level (16). This fact, however, provides a deep insight into the powerful ability of nature to build a specific and selective macroscopic interaction by using parallelized and cooperative multibinding systems of molecular individuals that are of limited specificity and selectivity.
Figure 3.
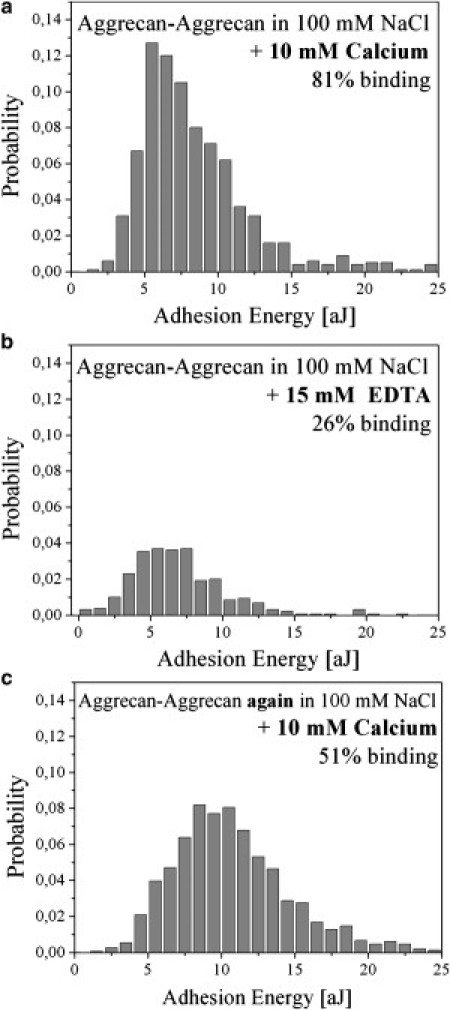
Ca2+ dependence of the self-adhesion interaction between aggrecan molecules. The histograms show the probabilities of the measured adhesion energies determined under different saline solution conditions. (a) Measurement in calcium-containing binding solution, leading to a binding probability of >80%. (b) Measurement in EDTA-containing buffer, in which the binding probability decreases to ∼25%. (c) After washing and switching back to the original calcium-containing binding solution, it is possible to reactivate the aggrecan self-adhesion, and the binding probability increases again to ∼50%.
To check the Ca2+ selectivity of GAG-mediated aggrecan self-adhesion at the single-molecule level, we performed further experiments using AFM-SMFS and identical sets of aggrecan-functionalized samples and tips. In Fig. 4, three different Eadh histograms are presented. Whereas in Fig. 4 a the aggrecan self-adhesion was measured in saline solution exhibiting an overall binding probability of ∼3% at an adhesion energy of ∼3 aJ, the addition of magnesium solution did not alter its binding probability and adhesion energy significantly (∼2% and 3 aJ, Fig. 4 b). However, when the original calcium-containing solution was introduced, a clear increase in binding probability (to ∼10%) and adhesion energy (∼5 aJ) could be recognized (Fig. 4 c). The reduced adhesion energies in the saline and magnesium environment coincide with the fact that no sawtooth force profiles could be detected in either of the nonspecific saline solution environments, as is typically found for the binding assay with calcium. Of interest, even in the presence of magnesium (another divalent ion), the GAG self-adhesion remained low, thus proving the selective requirement of Ca2+ for mediating the self-adhesion of the proteoglycan aggrecan at the single-molecule level that goes beyond pure electrostatic ion bridging. As an additional control, aggrecan-functionalized tips and bare gold surfaces were tested for interaction in calcium-binding solution. No significant interactions were detectable, with an ignorable binding probability of <0.7% (caused by unspecific interaction of aggrecan with the gold surface), further supporting the hypothesis of a homodimeric interaction between individual aggrecan molecules.
Figure 4.
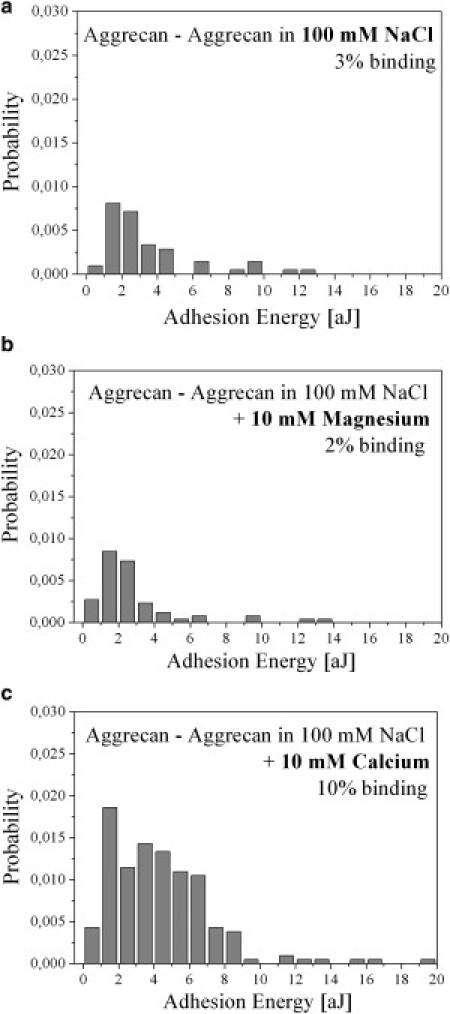
Aggrecan self-adhesion specifically requires Ca2+. The probabilities of the adhesion energies, as measured under different saline solution conditions, are plotted as histograms. (a) Measurement in 100 mM sodium chloride solution leads to a low binding probability of ∼3%. (b) Measurement after supplementing with 10 mM Mg2+ (binding probability ∼2%). (c) Measurement in original calcium binding solution increases the binding probability clearly to ∼10%. A typical force-versus-distance curve with a sawtooth profile, which leads to higher adhesion energies when measuring in calcium-binding solution, is observed only in panel c.
Aggrecan dissociation kinetics
Finally, we investigated the aggrecan interaction by DSMFS, i.e., by varying the retraction velocity of the AFM cantilever (from 100 nm/s to 5000 nm/s). From theory regarding the thermally activated decay of a metastable state under an external force (the Bell-Evans model), a shift of the averaged dissociation force Fmax with larger loading rates is expected (22,27) according to
where kBT and r denote the thermal energy and the loading rate, respectively (the loading rate can be obtained by multiplying the retraction velocity by the molecular elasticity of the system, which is determined by fitting the slope of every single force curve just before dissociation (21)), and xβ is the reaction length representing the distance between the minimum of the binding potential and the transition state that separates bound from free states. Because the dissociation process is stochastic by nature, many single-molecule dissociation events have to be recorded and plotted in a force histogram, where the maximum of the force distribution is commonly referred to as the averaged dissociation force Fmax (Fig. 5, a–d). In a dynamic force spectroscopy plot, the measured Fmax-values are plotted against the respective loading rates in a semilogarithmic way (Fig. 5 e). The thermal off-rate constant koff can therefore be deduced by linearly extrapolating the experimental data to zero external force (F = 0), and the slope of the linear fit can be assigned to the inverse reaction length xβ−1. This general scheme has been verified for many biomolecular interactions at the single-molecule level (28–30) and was also applied here to the phenomenon of aggrecan self-adhesion (Fig. 5 e). As a result, we estimated for the single GAG-GAG interaction in calcium-containing binding solution a reaction length of xβ = 0.31 ± 0.08 nm and a thermal off-rate constant of koff = 0.127 ± 0.08 s−1, which corresponds to a mean lifetime of τ = 7.9 ± 4.9 s (τ = 1/koff). It is interesting to compare these values with those measured for another calcium-specific cell adhesion process mediated by carbohydrate recognition motifs, such as those found in proteoglycans from the marine sponge Microciona prolifera. In our study, typical single-molecule bond lifetimes between carbohydrate moieties were measured to be on the order of 700 s with a bond reaction length of xβ = 0.35 nm. Although the aggrecan reaction length is very similar to that measured in the sponge, a clear difference of about two orders of magnitude is observed for the bond lifetimes (16). The short GAG bond lifetime of τ = 7.9 s may indicate a much faster biological response of the cartilage aggrecan with respect to physiological shear and bulk creep compliances, such that the biological tissue has to respond more quickly to external load changes to guarantee the integrity as well as the dynamic adaptiveness of the ECM architecture. Although further detailed viscoelastic investigations into the strain dependences of joint mechanics, especially for normal and degenerative tissues, are necessary (31), these experiments reveal novel (to our knowledge) and fascinating aspects relating macroscopic tissue architecture and physiology to molecular properties. In contrast, sponge cells are believed to undergo slower processes in aggregational control and cellular organization that hypothetically would be mirrored in the respective properties at the molecular level.
Figure 5.
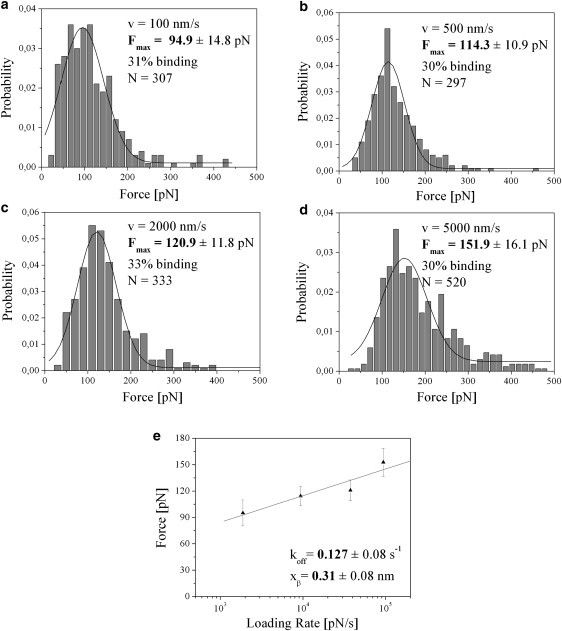
(a–d) DSMFS analysis of aggrecan macromolecular self-adhesion. The individual force histograms were obtained at retraction velocities varied between 100 nm/s and 5000 nm/s as indicated. (e) Dynamic force spectroscopy graph showing the measured average dissociation forces plotted against the respective loading rate in a semilogarithmic way.
Conclusions
In this work, we obtained quantitative data at the single-molecule level about Ca2+-specific self-adhesion of articular aggrecan, mediated by its negatively charged GAG chains. In addition to AFM experiments, which verified the structural integrity of the proteoglycans, we applied SMFS and statistically analyzed many individual AFM force-versus-distance curves. The characteristic sawtooth pattern of these curves could be explained by a sequential rupture of two adhering macromolecules. Further, we found a clear dependence of the averaged dissociation force on the loading rate, as proposed by the theoretical Bell-Evans model for thermally activated decay of a metastable state under an external force. Within this theoretical framework, we were able to measure dissociation forces, molecular elasticities, and adhesion energies of the GAG-GAG interaction that allowed determination of the respective reaction length, dissociation rate constant, and bond lifetime. In addition to the proposed and reported specificity and selectivity of this interaction on calcium at the mesoscale, we were also able to verify this important finding at the single-molecule level. In contrast to the Ca2+-specific interaction of sponge cell surface proteoglycans, a relatively short bond lifetime was determined for aggrecan, which may be attributed to the special biomechanical properties of the ECM in a tissue that has to respond in a dynamic and efficient way to changing loads. In addition, this example of a multiple-interaction phenomenon, where many molecular building blocks (GAGs) of relatively moderate self-affinity at the single-molecule level are the basis for the unique macroscopic, viscoelastic properties of articular cartilage, demonstrates the potential of novel single-molecule techniques to gain new insights into the underlying molecular processes and their associated mechanisms.
Acknowledgments
This study was supported by the Deutsche Forschungsgemeinschaft within the Collaborative Research Project (SFB 613). X.F.-B. was supported by grants BIO2008-01184 and CSD2006-00012 from the Ministerio de Ciencia e Innovación, Spain, which included FEDER funds, and by grant 2009SGR-760 from the Generalitat de Catalunya, Spain.
References
- 1.Roughley P.J. The structure and function of cartilage proteoglycans. Eur. Cell. Mater. 2006;12:92–101. doi: 10.22203/ecm.v012a11. [DOI] [PubMed] [Google Scholar]
- 2.Williamson A.K., Chen A.C., Sah R.L. Compressive properties and function-composition relationships of developing bovine articular cartilage. J. Orthop. Res. 2001;19:1113–1121. doi: 10.1016/S0736-0266(01)00052-3. [DOI] [PubMed] [Google Scholar]
- 3.Buschmann M.D., Grodzinsky A.J. A molecular model of proteoglycan-associated electrostatic forces in cartilage mechanics. J. Biomech. Eng. 1995;117:179–192. doi: 10.1115/1.2796000. [DOI] [PubMed] [Google Scholar]
- 4.Hascall V.C., Sajdera S.W. Physical properties and polydispersity of proteoglycan from bovine nasal cartilage. J. Biol. Chem. 1970;245:4920–4930. [PubMed] [Google Scholar]
- 5.Oldberg A., Antonsson P., Heinegård D. The partial amino acid sequence of bovine cartilage proteoglycan, deduced from a cDNA clone, contains numerous Ser-Gly sequences arranged in homologous repeats. Biochem. J. 1987;243:255–259. doi: 10.1042/bj2430255. [DOI] [PMC free article] [PubMed] [Google Scholar]
- 6.Seog J., Dean D., Ortiz C. Direct measurement of glycosaminoglycan intermolecular interactions via high-resolution force spectroscopy. Macromolecules. 2002;35:5601–5615. [Google Scholar]
- 7.Buckwalter J.A., Rosenberg L.C. Electron microscopic studies of cartilage proteoglycans. Direct evidence for the variable length of the chondroitin sulfate-rich region of proteoglycan subunit core protein. J. Biol. Chem. 1982;257:9830–9839. [PubMed] [Google Scholar]
- 8.Mörgelin M., Paulsson M., Engel J. Cartilage proteoglycans. Assembly with hyaluronate and link protein as studied by electron microscopy. Biochem. J. 1988;253:175–185. doi: 10.1042/bj2530175. [DOI] [PMC free article] [PubMed] [Google Scholar]
- 9.Ng L., Grodzinsky A.J., Ortiz C. Individual cartilage aggrecan macromolecules and their constituent glycosaminoglycans visualized via atomic force microscopy. J. Struct. Biol. 2003;143:242–257. doi: 10.1016/j.jsb.2003.08.006. [DOI] [PubMed] [Google Scholar]
- 10.Dean D., Han L., Grodzinsky A.J. Nanoscale conformation and compressibility of cartilage aggrecan using microcontact printing and atomic force microscopy. Macromolecules. 2005;38:4047–4049. [Google Scholar]
- 11.Dean D., Han L., Ortiz C. Compressive nanomechanics of opposing aggrecan macromolecules. J. Biomech. 2006;39:2555–2565. doi: 10.1016/j.jbiomech.2005.09.007. [DOI] [PubMed] [Google Scholar]
- 12.Han L., Dean D., Ortiz C. Cartilage aggrecan can undergo self-adhesion. Biophys. J. 2008;95:4862–4870. doi: 10.1529/biophysj.107.128389. [DOI] [PMC free article] [PubMed] [Google Scholar]
- 13.Dudhia J. Aggrecan, aging and assembly in articular cartilage. Cell. Mol. Life Sci. 2005;62:2241–2256. doi: 10.1007/s00018-005-5217-x. [DOI] [PMC free article] [PubMed] [Google Scholar]
- 14.Lindahl U., Höök M. Glycosaminoglycans and their binding to biological macromolecules. Annu. Rev. Biochem. 1978;47:385–417. doi: 10.1146/annurev.bi.47.070178.002125. [DOI] [PubMed] [Google Scholar]
- 15.Garcia-Manyes S., Bucior I., Fernàndez-Busquets X. Proteoglycan mechanics studied by single-molecule force spectroscopy of allotypic cell adhesion glycans. J. Biol. Chem. 2006;281:5992–5999. doi: 10.1074/jbc.M507878200. [DOI] [PubMed] [Google Scholar]
- 16.Fernàndez-Busquets X., Körnig A., Anselmetti D. Self-recognition and Ca2+-dependent carbohydrate-carbohydrate cell adhesion provide clues to the Cambrian explosion. Mol. Biol. Evol. 2009;26:2551–2561. doi: 10.1093/molbev/msp170. [DOI] [PubMed] [Google Scholar]
- 17.Lyubchenko Y., Shlyakhtenko L., Lindsay S. Atomic force microscopy of long DNA: imaging in air and under water. Proc. Natl. Acad. Sci. USA. 1993;90:2137–2140. doi: 10.1073/pnas.90.6.2137. [DOI] [PMC free article] [PubMed] [Google Scholar]
- 18.Sandy J.D., Flannery C.R., Neame P.J. Isolation and characterization of disulfide-bonded peptides from the three globular domains of aggregating cartilage proteoglycan. J. Biol. Chem. 1990;265:21108–21113. [PubMed] [Google Scholar]
- 19.Hegner M., Wagner P., Semenza G. Ultralarge atomically flat template-stripped Au surfaces for scanning probe microscopy. Surf. Sci. 1993;291:39–46. [Google Scholar]
- 20.Lévy R., Maaloum M. Measuring the spring constant of atomic force microscope cantilevers: thermal fluctuations and other methods. Nanotechnology. 2002;13:33–37. [Google Scholar]
- 21.Fuhrmann A., Anselmetti D., Reimann P. Refined procedure of evaluating experimental single-molecule force spectroscopy data. Phys. Rev. E. 2008;68:045103. doi: 10.1103/PhysRevE.77.031912. [DOI] [PubMed] [Google Scholar]
- 22.Evans E., Ritchie K. Dynamic strength of molecular adhesion bonds. Biophys. J. 1997;72:1541–1555. doi: 10.1016/S0006-3495(97)78802-7. [DOI] [PMC free article] [PubMed] [Google Scholar]
- 23.Merkel R., Nassoy P., Evans E. Energy landscapes of receptor-ligand bonds explored with dynamic force spectroscopy. Nature. 1999;397:50–53. doi: 10.1038/16219. [DOI] [PubMed] [Google Scholar]
- 24.Rosenberg L., Hellmann W., Kleinschmidt A.K. Macromolecular models of proteinpolysaccharides from bovine nasal cartilage based on electron microscopic studies. J. Biol. Chem. 1970;245:4123–4130. [PubMed] [Google Scholar]
- 25.Rief M., Gautel M., Gaub H.E. Reversible unfolding of individual titin immunoglobulin domains by AFM. Science. 1997;276:1109–1112. doi: 10.1126/science.276.5315.1109. [DOI] [PubMed] [Google Scholar]
- 26.Fritz J., Anselmetti D., Fernàndez-Busquets X. Probing single biomolecules with atomic force microscopy. J. Struct. Biol. 1997;119:165–171. doi: 10.1006/jsbi.1997.3887. [DOI] [PubMed] [Google Scholar]
- 27.Bell G.I. Models for the specific adhesion of cells to cells. Science. 1978;200:618–627. doi: 10.1126/science.347575. [DOI] [PubMed] [Google Scholar]
- 28.Eckel R., Wilking S.D., Anselmetti D. Single-molecule experiments in synthetic biology—a new approach to the affinity ranking of DNA-binding peptides. Angew. Chem. Int. Ed. 2005;44:3921–3924. doi: 10.1002/anie.200500152. [DOI] [PubMed] [Google Scholar]
- 29.Baumgarth B., Bartels F.W., Ros R. Detailed studies of the binding mechanism of the Sinorhizobium meliloti transcriptional activator ExpG to DNA. Microbiology. 2005;151:259–268. doi: 10.1099/mic.0.27442-0. [DOI] [PubMed] [Google Scholar]
- 30.Bartels F.W., McIntosh M., Becker A. Effector-stimulated single molecule protein-DNA interactions of a quorum-sensing system in Sinorhizobium meliloti. Biophys. J. 2007;92:4391–4400. doi: 10.1529/biophysj.106.082016. [DOI] [PMC free article] [PubMed] [Google Scholar]
- 31.Hayes W.C., Mockros L.F. Viscoelastic properties of human articular cartilage. J. Appl. Physiol. 1971;31:562–568. doi: 10.1152/jappl.1971.31.4.562. [DOI] [PubMed] [Google Scholar]