

Abstract
The interstitial matrix is comprised of cross-linked collagen fibers, generally arranged in nonisotropic orientations. Spatial alignment of matrix components within the tissue can affect diffusion patterns of drugs. In this study, we developed a methodology for the calculation of diffusion coefficients of macromolecules and nanoparticles in collagenous tissues. The tissues are modeled as three-dimensional, stochastic, fiber networks with varying degrees of alignment. We employed a random walk approach to simulate diffusion and a Stokesian dynamics method to account for hydrodynamic hindrance. We performed our analysis for four different structures ranging from nearly isotropic to perfectly aligned. We showed that the overall diffusion coefficient is not affected by the orientation of the network. However, structural anisotropy results in diffusion anisotropy, which becomes more significant with increase in the degree of alignment, the size of the diffusing particle, and the fiber volume fraction. To test our model predictions we performed diffusion measurements in reconstituted collagen gels and tumor xenografts. We measured fiber alignment and diffusion with second harmonic generation and multiphoton fluorescent recovery after photobleaching techniques, respectively. The results showed for the first time in tumors that the structure and orientation of collagen fibers in the extracellular space leads to diffusion anisotropy.
Introduction
The diffusion of macromolecules and nanoparticles through fibrous media is important in many fields of biological science. The phenomenon is relevant to separation processes such as electrophoresis and size exclusion chromatography, to therapeutic devices, and to delivery of drugs and naturally occurring macromolecules in normal and tumor tissues. The transport of these particles depends on their properties (size, charge, and configuration) as well as the fiber volume fraction and the structure of the tissue (1). Many experimental studies have examined the dependence of the diffusion coefficient on the fiber volume fraction both in vitro (2–6) and in vivo (6–14). However, there are only a few studies on the effect of tissue structure, and these reports are contradictory. Specifically, Leddy et al. (14) measured diffusion coefficients parallel and perpendicular to the primary fiber direction of agarose gels, ligaments, and cartilage and found a significant anisotropy in highly aligned tissues. In contrast, Erikson et al. (15) studied the diffusive transport of macromolecules in collagen gels and found no correlation between fiber network structure and macromolecule diffusivity. In our study, we seek to investigate this important issue with a mathematical model of diffusion which explicitly includes tissue structure as well as with direct measurements of the effect of tissue structure and organization on diffusion in collagen gels and tumors.
Mathematical modeling has been a valuable tool for studying the transport of molecules and particles in porous materials. Most models developed to date account only for collisions between the diffusing particles and the fixed obstacles of the medium (steric interactions) (e.g., (16–18)). These approaches use a random walk method, where computer representations of the tissue microstructure are generated and the trajectory of a large number of particles undergoing random walks is recorded for multiple time steps (17–21). The diffusion coefficient is calculated from the mean-square displacement of the particles, 〈MSD〉, according to the equation
| (1) |
where D is the overall diffusion coefficient, n is the spatial dimension, and t is the time.
These models work well, particularly when the hydrodynamic diameter of the diffusing molecule or nanoparticle is small compared to the fiber diameter. When the particle diameter is comparable or larger than the fiber diameter, the diffusivity is affected by hydrodynamic interactions. These interactions arise because the moving particle induces a flow field, which is reflected by the fibers back to the particle.
There are three published approaches that account for hydrodynamic interactions and have been used for the study of diffusion in fibrous media. The effective medium theory (22) provides the hydrodynamic hindrance as a function of the hydraulic permeability of the medium. This approach has been used extensively but its accuracy is not always good and the calculation of hydraulic permeabilities is generally challenging. In an alternative approach, Phillips et al. (22) also developed a two-dimensional methodology for diffusion in parallel arrays of fibers. The fibers were modeled as a set of spheres of the same diameter as the fibers, the hydrodynamic hindrance was determined by the solution of a Stokesian dynamics problem, and the overall diffusion coefficient was calculated using the generalized Taylor dispersion theory.
Three-dimensional calculations of diffusion coefficients in random isotropic media of noninteracting fibers have been performed by Clague and Phillips (23). They represented the diffusing particle as a set of point singularities and accounted for the fibers by using slender-body theory. None of these mathematical models, however, focused on the effect of fiber alignment on diffusion anisotropy.
Here, we present a mathematical framework for the diffusion of macromolecules and nanoparticles in three-dimensional networks of interconnecting fibers with varying degrees of alignment. We employ a random walk approach to simulate the diffusion of particles in computer-generated stochastic fiber networks and extend the Stokesian dynamics theory developed by Phillips et al. (22) to three dimensions to account for hydrodynamic hindrance. We use this model to study how the network structure affects the directional components of the diffusion coefficient tensor. Subsequently, we support our model predictions with experimental measurements. Previous studies have shown that diffusion of nanoparticles and macromolecules in the interstitial space of tumors is hindered by collagen fibers (11,12,24) and the removal or reorganization of these fibers has been shown to improve interstitial transport (11,25,26). We therefore investigate the effect of collagen fiber alignment on diffusion anisotropy in reconstituted collagen gels and tumors. We measure fiber alignment and diffusion with second harmonic generation (SHG) and multiphoton fluorescent recovery after photobleaching (MP-FRAP) techniques, respectively (26,27). These results show for the first time, in tumors, that the structure and orientation of collagen fibers in the extracellular space leads to diffusion anisotropy.
Methods
Generation of fiber networks
We used the same network generation algorithm described previously for the study of the mechanical properties (28–30) and the hydraulic permeabilities of soft biological tissues (31). Nucleation sites were generated randomly within a cubic space and allowed to grow segmentally in opposite directions along a randomly chosen vector. The segments grew progressively by a unit length until they collided with the network boundary or with another segment. In the former case, a boundary cross-link was generated, and in the latter case, an interior cross-link was generated at the point of collision. Collision between two segments was defined when their distance was less than a prescribed fiber diameter. A fiber was defined as the line between two cross-links associated with the same segment. Aligned networks were generated by selecting the directional vectors from an anisotropic distribution.
For the characterization of the degree of alignment, the second-order fiber orientation tensor, Ω, was employed (29,32)
| (2) |
where li is the length of the ith fiber, ltot is the total fiber length, and the sum is over all fibers. The value α is the angle formed between the fiber axis and the z axis, and ϑ is the angle formed between the projection of the fiber on the x-y plane and the x axis. The trace of Ω is always one. For the isotropic case,
while for aligned networks, the value of the diagonal components is a measure of fiber alignment in the coordinate directions.
Description of the mathematical model
Particles were randomly distributed inside the three-dimensional fiber network and they performed a random walk (Fig. 1 a). According to the random walk method, the diffusing particle moved stepwise inside the fiber medium and along a randomly chosen direction. At each elementary time step Δt the displacement, δ, of the particle in each coordinate direction, i, was determined by
where Dij is the local diffusion coefficient tensor.
Figure 1.
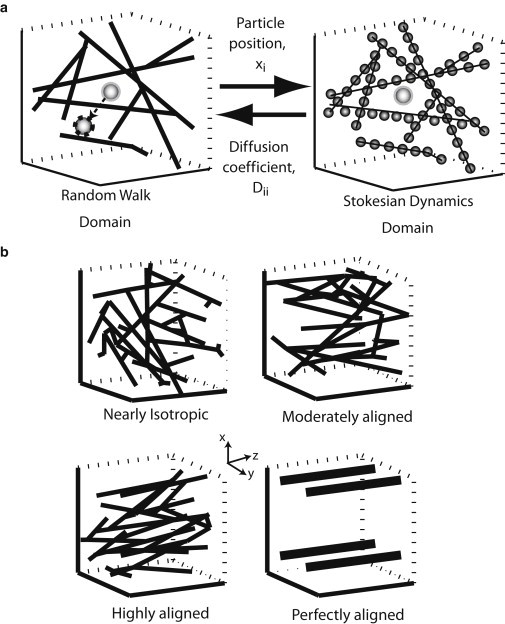
(a) Formulation of the mathematical model. Particles diffuse inside the fibrous medium (Random Walk Domain). A second computational domain is constructed for the calculation of hydrodynamic interactions (Stokesian Dynamics Domain). At each time step of the random walk, the position of the particle is mapped to the Stokesian dynamics domain and its diffusion coefficient is calculated by the solution of a Stokesian dynamics problem. The diffusion coefficient is returned to the random walk domain and the particle moves to a new, randomly-chosen position. Periodic boundary conditions are applied, and in the case of collision with a fiber, the displacement is rejected. (b) Typical fiber structures employed in this study.
The diffusion of the particle is hindered due to hydrodynamic interactions and is determined by Stokesian dynamics. For the Stokesian dynamics approach, a second computational domain was constructed where the fibers were represented as a set of spheres (bead and string model in (22)) with the same diameter as the diameter of the fibers. At each time step, the position of the particle, xi, was mapped from the random walk domain to the Stokesian dynamics domain. The Stokesian dynamics problem was solved (see details in the next section), and the local diffusion coefficient tensor of the particle, Dij, was determined based on the size of the particle and its position inside the network (Fig. 1 a). The diffusion coefficient decreases as the particle size increases or as the particle approaches the fibers. Finally, the diffusion coefficient was returned to the random walk domain and the particle was displaced to its new randomly chosen position.
At each time step, we checked whether the displacement resulted in collision with the fibers or crossing the boundary of the random walk domain. In the first case, the displacement was rejected and the position of the particle did not change, while in the second case periodic boundary conditions were applied (17,18).
By tracking the trajectory of the particle for 10,000 time steps and taking the average of 1000 particles, the overall diffusion coefficient, D, as well as the components of the main diagonal of the overall diffusion coefficient tensor (D∗xx, D∗yy, D∗zz) were determined from Eq. 1 as
| (3) |
while the mean-square displacements were calculated from
| (4) |
where n is the total number of walkers (a thousand in our case) and xi, yi, zi are the coordinate directions of the walker i. We determined the minimum required number of time steps as follows: in test simulations, we calculated the overall diffusion coefficient and its directional components (Eq. 3) at each time step to identify the iteration at which they stopped fluctuating. We found that by iteration 7000, changes in the overall diffusion coefficients were limited to 2–3%. Thus, the 10,000 time steps used for the presented simulations were more than sufficient to reach a steady state. Additionally, it was important that the particle be allowed to diffuse a sufficient distance so that it sampled a representative amount of the system geometry (i.e., it should diffuse for a distance much longer than the average pore size of the fiber network). At 1% fiber volume fraction, the average pore size of our networks ranged from 0.91 to 1.16 μm (Table S2 in the Supporting Material). The typical diffusion distance of a 20-nm particle after 10,000 time steps was 78 μm. Because the diffusion distance decreases as the particle size increases due to steric and hydrodynamic interactions, the diffusion distance of a 300-nm particle (the largest size in our study) was 30 μm. At 5% fiber volume fraction, the average pore size ranged from 0.37 to 0.48 μm. The diffusion distance of the 20-nm particle remained 78 μm, but because of the decrease in the pore size the diffusion distance of the 300-nm particle was 10 μm. For higher volume fractions, only particles of sizes <50 nm were used. Thus, we ensured that the diffusion distance was always more than an order-of-magnitude greater than the pore size. To calculate deviations in the solution of our mathematical model due to its stochastic nature, we repeated the simulations and found <3% variation.
We applied our model to three different network structures: a nearly isotropic network, a moderately aligned network, and a highly aligned network. Additionally, to better study the effect of network orientation, we also employed a spatially periodic square array of fibers (Fig. 1 b). If not otherwise stated, we chose the fiber diameter to be 100 nm to represent the diameter of a collagen fiber (28), while the diameter of the diffusing particle varied from 5 to 300 nm. Depending on the size of the diffusing particle the time step, Δt, was set in the range of 10−3–2 × 10⁻² s. Fiber volume fractions ranged from 1% to 40%, which are typical values of collagen content in native and engineered tissues (3,11). Finally, because of the stochastic nature of the network generation procedure, four network structures were generated for each set of conditions and values were averaged. Table S1 presents the diagonal components of the orientation tensor of the networks, while Table S2 presents the average pore size of the networks for three fiber volume fractions employed in the study.
Stokesian dynamics—calculation of local diffusion coefficient
To calculate the local diffusion coefficient tensor of the particle accounting for hydrodynamic hindrance, we applied the Stokesian dynamics methodology as described in Phillips et al. (Eqs. 6–10 in (22)). In a stagnant fluid, neglecting interactions between the diffusing particles, the local diffusion coefficient of each of the particles is given by
| (5) |
where k is the Boltzmann's constant, T is the absolute temperature, and Rii is the resistance matrix of the particle. For free diffusion in a solution, the diagonal components of the resistant matrix are equivalent and are determined from the well-known Stokes-Einstein relationship as 6πμrs, where μ is the fluid viscosity, and rs the radius of the particle.
In a fiber network, the resistant matrix is determined by short-range and long-range hydrodynamic interactions between the particle and the fibers. To calculate the resistant matrix we represented the fibers as lines of adjacent spheres and used theories developed for sphere-sphere interactions. For the long-range interactions, we employed the Ewald sum of the Rotne-Prager tensor (33) accounting only for the translational velocity of the particles. To incorporate short-range (lubrication) forces, we calculated the interaction between the particle and each of the spheres separately using the exact two-sphere results from the literature (34,35). Therefore, lubrication interactions were calculated in a pairwise additive fashion under the assumption that the other spheres in the periodic unit cell are negligible. This approach of including lubrication has been tested previously for ordered and disordered arrays of spheres and has been found to agree well with published theoretical and experimental studies (36–38). Addition of long-range and short-range interactions gives the complete approximation to the resistance matrix, Rij. For these calculations, the fluid viscosity was taken to be that of water at 20°C.
The incorporation of hydrodynamic forces increased the computational cost dramatically. To make the computations feasible we parallelized the algorithm, allowing the simulations to complete in ∼1 h using 28 processors.
Animal and collagen hydrogel models
Severe combined immunodeficient mice were used for all animal studies. Mice were implanted with human fibrosarcoma tumors (HSTS26T) in dorsal skin fold chambers. Imaging studies and diffusion measurements were done three weeks after tumor implantation to allow for adequate tumor progression and extracellular matrix production. All animal studies were done with approval from the Institutional Animal Care and Use Committee.
Collagen gels were prepared by reconstituting acid-soluble rat tail collagen (BD Biosciences, San Jose, CA) using previously described protocols (39). Gels were suspended on glass cover slides and incubated for 24 h at 37°C before imaging.
Second harmonic generation imaging and analysis
Second harmonic generation (SHG) imaging was done in dorsal chamber tumors and collagen gels with a custom-built multiphoton laser-scanning microscope (26). For SHG imaging, polarized light from a Ti:Sapphire laser (Mai-Tai Broadband; Spectra-Physics, Mountain View, CA) was converted to circularly polarized light with a zero-order quarter wave plate (Newport, Irvine, CA). The quarter wave plate was removed from the beam path during MP-FRAP measurements. An excitation wavelength of 810 nm was used and SHG signal was detected at 405 nm. SHG images were analyzed with custom-built MATLAB (The MathWorks, Natick, MA) code, which determined the volume fraction and alignment of the imaged collagen fibers. Fiber area fraction was determined by applying a threshold intensity to the SHG image and finding the fraction of pixels with intensity above the set threshold. The threshold was set as the median intensity of all the images in the experiment. Orientation/angle of collagen fibers was determined by performing a two-dimensional fast-Fourier transform on the SHG image. The fiber orientation was extracted from the phase component of the fast-Fourier transform.
Diffusion measurements
Single point multiphoton fluorescence recovery after photobleaching (MP-FRAP) measurements were made using 2 M fluorescein isothiocyanate (FITC)-conjugated dextran molecules (hydrodynamic radius: 20 nm) with previously described protocols (27). FITC dextran molecules were introduced into the tumor by intratumoral injection (1 μL of 1 mg/mL) using an already established protocol (27). We therefore avoid the uncertainty of concentration that occurs with intravenous injections. FRAP measurements were performed with a laser excitation wavelength of 810 nm. We measured a grid of 20 × 20 MP-FRAP points overlaid on the SHG image of the area under study (see Fig. 7 later in article). We obtained the relative diffusion coefficient for the bleached spot (D/Do) where D is the diffusion coefficient obtained at the spot from MP-FRAP analysis and Do is the diffusion coefficient of the bleached fluorophore in solution. We then compared the relative diffusion coefficient (D/Do) obtained by single point MP-FRAP with collagen network volume fraction and alignment. It should be noted that D/Do is a measure of the overall diffusion and does not contain any information on the directional components of it.
Figure 7.
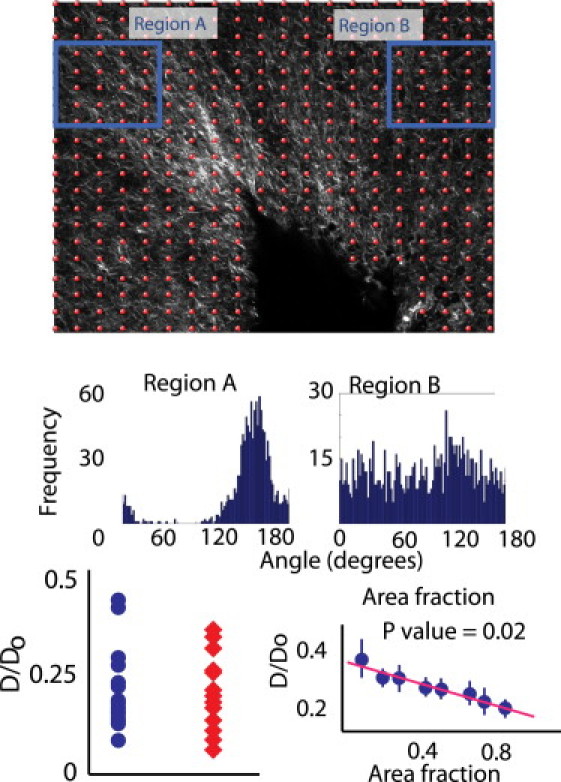
Effects of area fraction and fiber alignment on overall diffusion measured in collagen gels. The top panel shows an SHG image of the collagen gel overlaid with the points at which overall diffusion was measured. It also shows the regions that were sampled for fiber alignment studies. The histograms on the middle panel show the relative alignment of fibers in Regions A and B. The bottom-right panel shows the strong correlation between fiber area fraction and overall diffusion. The bottom-left panel shows that there is no significant difference between overall diffusion measurements obtained from the highly aligned Region A compared to the unaligned Region B.
To obtain information on diffusion anisotropy, we made line FRAP measurements overlaid on SHG images of aligned collagen networks in vivo (see Fig. 8 later in article) also using 2 M FITC-conjugated dextran molecules. We modified a previously described confocal laser scanning line FRAP model (9,40,41) for multiphoton FRAP. According to Meyvis et al. (42), the characteristic diffusion time should be at least 15× the bleached time to avoid diffusion during bleaching. We bleached the line for 80.56 μs. This is well below the characteristic diffusion time of 1.7 s for our experimental system. We approximated the bleached volume as a cylindrical tube. We also assumed the recovery kinetics to be similar to those expected for diffusion from a well-stirred limited volume into the cylindrical tube (43) and a linear relationship between the intensity of the fluorescent signal and the total amount of fluorophore in the cylinder. These approximations were tested by verifying that the diffusion of 2 M FITC dextran in free solution and in tumors agreed with previously obtained values (4,26). We fit the recovery curve using (43):
| (6) |
where acJ0(qn) + J1(qn) = 0, and α = A/πa2. The values F0 and F are the prebleach and postbleach fluorescent intensity values. D+ is the diffusion coefficient orthogonal to the bleached line. J0 and J1 are the Bessel functions of the first kind of order zero and order one, respectively, qn is obtained from the roots of the Bessel function relation in Eq. 6, A is the average cross-sectional area of the pores within the collagen network and a is the radius of the bleached cylinder. The dimensions of a and A are 1 μm and 5 μm, respectively. We obtained the apparent hindrance to diffusion (D+/D0), where D0 is the diffusion coefficient in free solution.
Figure 8.
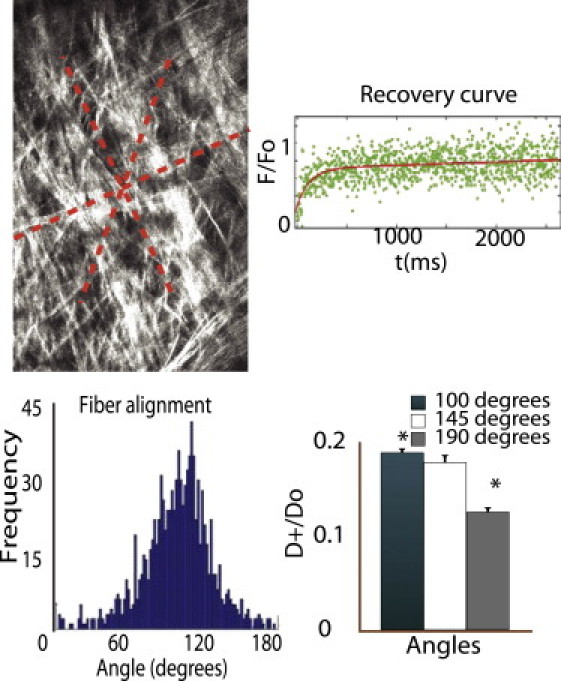
In vivo evidence of diffusion anisotropy in tumors. The top-left panel shows an SHG image of the tumor interstitium. Collagen fibers are visible in gray. The red dashed lines show the planes along which line FRAP measurements were taken. The bottom-left panel shows a histogram of the relative alignment of collagen fibers in the network. The histogram shows that most fibers are aligned at 100 ° to the horizontal. The top-right panel shows a recovery curve obtained from line FRAP measurements. The bottom-right panel shows the relative diffusivities obtained from line FRAP. Diffusion coefficients at 100 ° (parallel to the collagen fibers) are 1.5 times larger than those performed at 190 ° (orthogonal to the collagen fiber alignment).
Results
Validation of the mathematical model
To test the validity of our model, we first accounted only for the random walk simulations (steric interactions) and compared our results with the data of Johansson and Lofroth (see their Fig. 3in (17)) for three different values of the fiber volume fraction, ϕ. Johansson and Lofroth used a similar random walk approach to study the diffusion of particles in polymer networks and Fig. S1 shows that our model agrees with the results they reported.
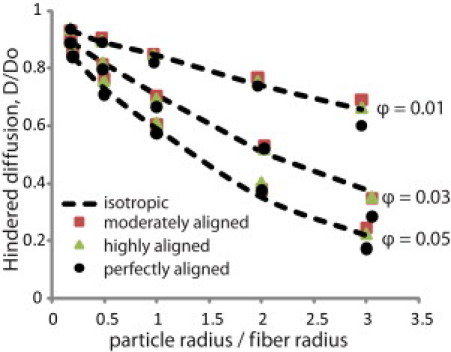
Figure 3.
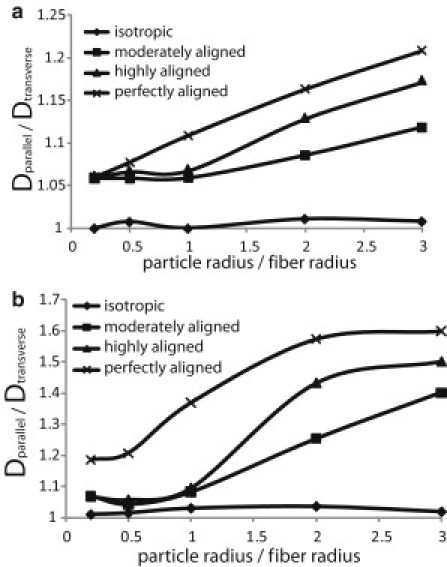
Diffusion anisotropy as a function of the ratio of the particle radius over the fiber radius for the fiber structures employed in the study and for two fiber volume fractions: (a) 0.01, and (b) 0.05. Dparallel is the diffusion coefficient parallel to the preferred fiber direction (Dzz) and Dtransverse is the diffusion coefficient transverse to the preferred fiber direction (average value of Dxx and Dzz). The value of the fiber networks is the average of four realizations. Standard deviations were too small to be distinguished in the plot and were omitted.
Subsequently, we included the Stokesian dynamics domain and tested the model prediction with a theory developed for isotropic fiber networks and has been successfully used to predict the diffusivity of macromolecules in fiber media (44). According to that theory, diffusivity in a fiber network is given by the product of hydrodynamic, F, and steric, S, interactions, as
| (7) |
where D/ D0 is the ratio of the diffusivity in the gel to that in solution, and f is an adjusted volume fraction given as a function of the fiber volume fraction, ϕ, and the ratio of the solute diameter to the fiber diameter, λ (i.e., f = (1 + λ)2ϕ). The stretched exponential expressions for F and S were derived by Clague and Phillips (23), and Johansson and Lofroth (17), respectively, while corrected values of a and b are given in Amsden (45) as: a = π, and b = 0.174 ln(59.6/λ). Fig. S2 shows the good agreement of our model with Eq. 7.
Network orientation affects diffusion anisotropy but not overall diffusion coefficient
To study the effect of fiber alignment on the overall diffusion coefficient, we performed our analysis on the four different network structures shown in Fig. 1 b. As shown in Table S2, increase in fiber orientation also resulted in an increase in the pore size of the networks. The results of our simulations are depicted in Fig. 2 for fiber volume fractions of 0.01, 0.03, and 0.05. We see that the overall diffusion coefficient is independent of the network orientation and pore size distribution.
Figure 2.
Overall diffusion coefficients, D, as a function of the ratio of the particle radius over the fiber radius for the fiber structures employed in the study and for three fiber volume fractions 0.01, 0.03, and 0.05. The diffusion values of the fiber networks are the average of four realizations. Standard deviations were too small to be distinguished in the plot and were omitted. D0 is the diffusion coefficient in solution.
In Fig. 3 we plot the ratio of the diffusion coefficient parallel to the preferred fiber direction (Dparallel ≡ D∗zz) over the diffusion coefficient transverse to the preferred fiber direction (Dtransverse is the average value of D∗xx and D∗yy, D∗xx ≈ D∗yy for all simulations) for fiber volume fractions of 0.01 and 0.05. We observe that particles diffuse faster in the preferred fiber direction and this becomes more significant with an increase in network alignment, particle size, or fiber volume fraction. When the diffusing particle is smaller than the fiber, the diffusion anisotropy ratio (Dparallel/Dtransverse) is the same for the moderately and highly aligned networks and does not depend on particle size. For larger particles, however, the diffusion anisotropy depends on network orientation, and, for small volume fractions, scales linearly with particle size. At the high volume fraction of 0.05 (Fig. 3 b), the diffusion anisotropy ratio reaches a plateau for large particles. The pore size decreases with increase in the fiber volume fraction and restricts the transport of large particles even in the preferred fiber directions. Finally, we see that the anisotropy is always higher for the perfectly aligned array, providing an upper bound for the networks.
In our analysis so far, we kept the fiber volume fraction <0.05. As shown in Table S2, for higher volume fractions the pore size becomes smaller than the size of the largest particles (300 nm) used in the study; thus, they can no longer diffuse. The low volume fraction range (<0.05) is representative of engineered matrices and many native tissues, but not tissues like cartilage, tendons, and tumors (3,11). Fig. 4 presents the diffusion anisotropy of diffusing particles with sizes ranging from 5 to 50 nm in highly aligned networks. The fiber volume fraction was up to 0.4. We see that particles of smaller size still exhibit the same range of diffusion anisotropy, but at higher volume fractions.
Figure 4.
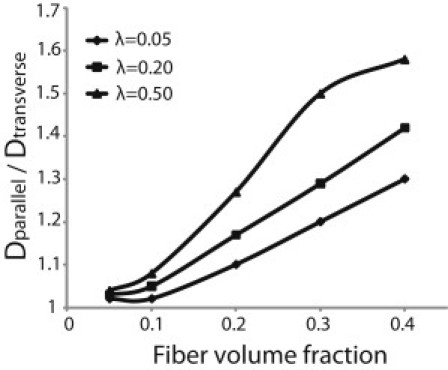
Diffusion anisotropy as a function of the fiber volume fraction for highly aligned networks and for particles of three different sizes. The ratio λ of the particle radius over the fiber radius is 0.05, 0.2, and 0.5.
Steric versus hydrodynamic interactions
To study the contribution of steric and hydrodynamic interactions to the diffusion coefficient, we plot in Fig. 5 the hindered diffusion accounting 1), only for steric interactions; 2), for steric interactions plus the incorporation of long-range hydrodynamic interactions; and 3), for steric and hydrodynamic interaction, taking into account the correction for short-range (lubrication) effects. Fig. 5 shows the results for two different sizes of particles. The ratio of particle radius/fiber radius, λ, is 0.2 and 3.0. Incorporation of only steric hindrance overpredicts the diffusion coefficient, particularly for large particles. Lubrication interactions provide an up to 5% correction to hydrodynamic hindrance.
Figure 5.
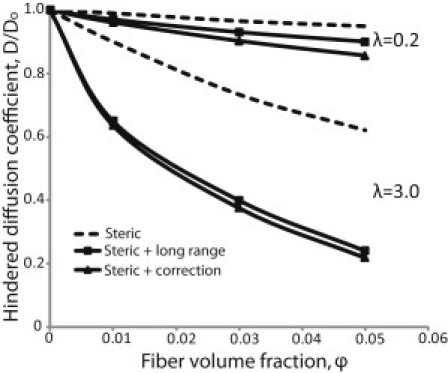
Effect of steric and hydrodynamic interactions on the overall diffusion coefficient, D, as a function of the fiber volume fraction. We consider 1), only steric interactions; 2), steric interactions plus long-range hydrodynamic interactions; and 3), steric and hydrodynamic interaction plus the correction for short-range (lubrication) effects. The ratio λ of the particle radius over the fiber radius is 0.2 and 3.0.
To determine whether the diffusion anisotropy is a result of steric or hydrodynamic interactions, we plot in Fig. 6 the diffusion anisotropy ratio accounting only for steric hindrance and for steric plus hydrodynamic hindrance. The fiber volume fraction is 0.05. The difference in the diffusion anisotropy with and without hydrodynamic interactions is small, and does not exceed 5%.
Figure 6.
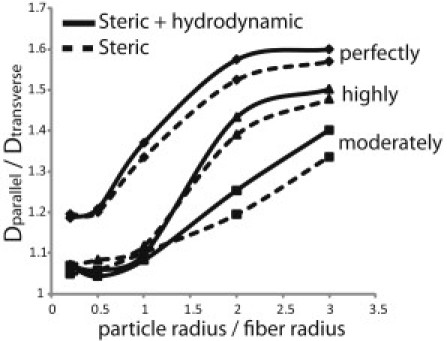
Effect of steric and hydrodynamic interactions on the diffusion anisotropy of moderately, highly, and perfectly aligned networks.
Experimental validation of model predictions in collagen gels and tumors
To support the model predictions, we performed diffusion measurements in collagen gels and in an in vivo tumor model. To prove that the overall diffusivity of nanoparticles and macromolecules is independent of the network structure, we employed a heterogeneous collagen gel, whose collagen fraction and orientation can be easily controlled and measured. Fig. 7 shows the dependence of diffusion on collagen fiber orientation and area fraction. The top panel shows an SHG image of a collagen gel with the overlaid red circles representing the locations at which single spot MP-FRAP measurements were made. The bottom-right panel shows the relationship between the hindered diffusivity (D/D0) and fiber area fraction. Our data shows that there is a strong, statistically significant relationship between area fraction and D/D0, where D/D0 decreases with increasing area fraction. We also investigated the relationship between D/D0 and fiber alignment. We selected two regions (A and B) which had highly aligned fibers (Region A) and unaligned fibers (Region B) but the same area fraction to investigate this relationship. In accordance with the model predictions, our analysis shows no correlation between D/D0 and fiber alignment.
Because the point MP-FRAP measurements of D/D0 do not give any information on component diffusion, we chose to use line-FRAP measurements instead to investigate the effect of fiber alignment on diffusion anisotropy. To measure diffusion anisotropy, we employed the highly desmoplastic soft tissue sarcoma HSTS26T model. To our knowledge, diffusion anisotropy in the interstitial space of tumors has been never measured, despite its importance to drug delivery (1,12,24,25). Fig. 8 shows an SHG image of the highly organized and dense collagen fibers in the tumor interstitial space. The red dashed lines depict the region in which line FRAP measurements were made. We found that in the extracellular matrix of tumors with highly aligned collagen fibers, the diffusion coefficient parallel to the fiber direction (D+/D0 = 0.18) was 1.5 times higher than the diffusion coefficient in a direction perpendicular to the fiber direction (D+/D0 = 0.12). It is also interesting to note that the diffusion coefficient at 45° to the fiber direction (D+/D0 = 0.17) was higher than the value perpendicular to the fiber direction but lower than that obtained parallel to the fiber direction. As we have mentioned, the soft tissue sarcoma xenograft that we used in this study is a desmoplastic tumor with fiber volume fraction up to 40% (11). In Fig. 4, we see that the model predictions for particles of the size of 2 M FITC Dextran (λ = 0.4) are 1.25 for 20% volume fraction and 1.55 for 40% volume fraction, in good agreement with the experimental measurements.
Discussion
Here, we developed a mathematical model for the diffusive transport of macromolecules and nanoparticles in collagenous tissues. The model accounted for steric and hydrodynamic interactions and was applied to fiber networks with varying degrees of alignment. We showed that even though the overall diffusion coefficient is not affected by network structure, the directional components of the diffusion coefficient matrix might vary considerably depending on network orientation, particle size, and fiber volume fraction. The results of our study agree with the experimental data of Leddy et al. (14), who measured diffusion coefficients parallel and transverse to the preferred fiber direction of ligaments, cartilage, and agarose gels for a small (3 kDa Dextran) and a large (500 kDa Dextran) molecule. Additionally, the plateau observed in Fig. 3 b has been shown experimentally in diffusion measurements in the highly aligned extracellular space of the brain (46).
Our own experiments in collagen gels and in human xenograft tumor models also support these findings. We presented evidence that diffusion anisotropy exists in mouse models of human tumors and the degree of anisotropy in the tumors matches the results obtained from our simulations. We believe that the diffusion anisotropy in tumors is particularly high because of the high volume fraction of the fibers in the dense collagen network and the highly organized nature of the fibers caused by the remodeling activities of tumor fibroblast cells. These findings are important for tumor drug delivery because they could help provide insight into geometrical and steric constraints in the development of antitumor therapeutics (24).
Our results potentially explain a discrepancy between Leddy et al. (14) and Erikson et al. (15), who measured the diffusivity of 2 M Dextran in collagen gels with varying orientations. In agreement with our model prediction (Fig. 2), Erikson et al. (15) found that the overall diffusion coefficient was not affected by the network orientation but only by the fiber volume fraction. However, in contrast to Leddy et al. (14), they also noticed that collagen alignment did not result in diffusion anisotropy. We provide two possible explanations to this discrepancy.
First, the hydrodynamic radius of 2 M Dextran (used by Erikson et al. (15)) is 20 nm, while the fibers in their gels were very thick (∼800 nm). According to our model (Figs. 3 and 4), the very small ratio of particle radius compared to the fiber radius in combination with the low collagen volume fraction of the gel may explain the absence of diffusion anisotropy in their study.
Second, Erikson et al. (15) measured diffusion in circular regions—more likely to provide overall diffusion values. Our data show that overall diffusion values do not provide the component diffusion information required to probe the relationship between fiber orientation and diffusion anisotropy. Leddy et al. (14) on the other hand measure diffusion using an indirect method that allows them to obtain component diffusion information and successfully explore the relationship between fiber orientation and diffusion anisotropy.
We also used our mathematical approach to separate the effects of steric and hydrodynamic interactions (Figs. 5 and 6). We found that when we account only for steric hindrance the overall diffusion coefficient is overpredicted and it might be up to three times higher than the diffusion coefficient that includes hydrodynamic hindrance (Fig. 5). On the other hand, the incorporation of lubrication forces provided a small, up to 5%, correction to the diffusivity. Interestingly, when we accounted only for steric interactions the diffusion anisotropy did not change (Fig. 6). This finding is explained by the fact that hydrodynamic interactions slow down the mobility of the particle but they do not affect the direction in which particles will move.
The main advantage of our methodology over other random walk approaches is that it accounts not only for steric but also for hydrodynamic interactions in a computationally tractable way. In addition, the model accounts directly for the tissue microstructure and can easily incorporate tissues with different degrees of alignment. Our mathematical framework is general and can be extended to incorporate other types of interactions such as electrostatic, once we have a method to describe the electrostatic energy of a particle in a fiber medium. Currently, such a method exists only for the interaction between a particle and a single fiber or a spatially periodic array of fibers (47,48). The model can also be extended to incorporate multiple families of fibers to better-represent the structure of native tissues. Finally, the presented methodology of network generation and diffusion simulation can be combined with imaging techniques for the prediction of diffusion coefficients in tissues. This type of information is critical to optimize the properties of nanoparticles for improved delivery in tumors (24).
Acknowledgments
We thank Professors William M. Deen (Massachusetts Institute of Technology) and Ronald J. Phillips (University of California at Davis) for useful discussions, Julia Kahn for animal model preparation, and Katerina Mantzavinou and Chen Yan for help with data processing. Simulations were made possible by using the computer resources of Partners Research Computing.
This work was supported by the National Institutes of Health (grant Nos. PO1-CA80124, RO1-CA126642, RO1-CA115767, and RO1-CA85140), the Federal Share Income Grant, and the Department of Defense Breast Cancer Research Innovator award (grant No. BC095991). T.S. was supported by a postdoctoral research fellowship from the Susan G. Komen Breast Cancer Foundation (grant No. KG091281). B.D.-F. was supported by an Era of Hope Predoctoral fellowship from the Department of Defense (grant No. W91ZSQ7342N607).
Supporting Material
References
- 1.Jain R.K. Transport of molecules in the tumor interstitium: a review. Cancer Res. 1987;47:3039–3051. [PubMed] [Google Scholar]
- 2.Johnson E.M., Berk D.A., Deen W.M. Hindered diffusion in agarose gels: test of effective medium model. Biophys. J. 1996;70:1017–1023. doi: 10.1016/S0006-3495(96)79645-5. [DOI] [PMC free article] [PubMed] [Google Scholar]
- 3.Ramanujan S., Pluen A., Jain R.K. Diffusion and convection in collagen gels: implications for transport in the tumor interstitium. Biophys. J. 2002;83:1650–1660. doi: 10.1016/S0006-3495(02)73933-7. [DOI] [PMC free article] [PubMed] [Google Scholar]
- 4.Pluen A., Netti P.A., Berk D.A. Diffusion of macromolecules in agarose gels: comparison of linear and globular configurations. Biophys. J. 1999;77:542–552. doi: 10.1016/S0006-3495(99)76911-0. [DOI] [PMC free article] [PubMed] [Google Scholar]
- 5.Kosto K.B., Deen W.M. Diffusivities of macromolecules in composite hydrogels. AIChE J. 2004;50:2648–2658. [Google Scholar]
- 6.Brown E.B., Boucher Y., Jain R.K. Measurement of macromolecular diffusion coefficients in human tumors. Microvasc. Res. 2004;67:231–236. doi: 10.1016/j.mvr.2004.02.001. [DOI] [PubMed] [Google Scholar]
- 7.Nugent L.J., Jain R.K. Extravascular diffusion in normal and neoplastic tissues. Cancer Res. 1984;44:238–244. [PubMed] [Google Scholar]
- 8.Gerlowski L.E., Jain R.K. Microvascular permeability of normal and neoplastic tissues. Microvasc. Res. 1986;31:288–305. doi: 10.1016/0026-2862(86)90018-x. [DOI] [PubMed] [Google Scholar]
- 9.Chary S.R., Jain R.K. Direct measurement of interstitial convection and diffusion of albumin in normal and neoplastic tissues by fluorescence photobleaching. Proc. Natl. Acad. Sci. USA. 1989;86:5385–5389. doi: 10.1073/pnas.86.14.5385. [DOI] [PMC free article] [PubMed] [Google Scholar]
- 10.Berk D.A., Yuan F., Jain R.K. Direct in vivo measurement of targeted binding in a human tumor xenograft. Proc. Natl. Acad. Sci. USA. 1997;94:1785–1790. doi: 10.1073/pnas.94.5.1785. [DOI] [PMC free article] [PubMed] [Google Scholar]
- 11.Netti P.A., Berk D.A., Jain R.K. Role of extracellular matrix assembly in interstitial transport in solid tumors. Cancer Res. 2000;60:2497–2503. [PubMed] [Google Scholar]
- 12.Pluen A., Boucher Y., Jain R.K. Role of tumor-host interactions in interstitial diffusion of macromolecules: cranial vs. subcutaneous tumors. Proc. Natl. Acad. Sci. USA. 2001;98:4628–4633. doi: 10.1073/pnas.081626898. [DOI] [PMC free article] [PubMed] [Google Scholar]
- 13.Mok W., Boucher Y., Jain R.K. Matrix metalloproteinases-1 and -8 improve the distribution and efficacy of an oncolytic virus. Cancer Res. 2007;67:10664–10668. doi: 10.1158/0008-5472.CAN-07-3107. [DOI] [PubMed] [Google Scholar]
- 14.Leddy H.A., Haider M.A., Guilak F. Diffusional anisotropy in collagenous tissues: fluorescence imaging of continuous point photobleaching. Biophys. J. 2006;91:311–316. doi: 10.1529/biophysj.105.075283. [DOI] [PMC free article] [PubMed] [Google Scholar]
- 15.Erikson A., Andersen H.N., Davies C.L. Physical and chemical modifications of collagen gels: impact on diffusion. Biopolymers. 2008;89:135–143. doi: 10.1002/bip.20874. [DOI] [PubMed] [Google Scholar]
- 16.Ogston A.G., Preston B.N., Wells J.D. On the transport of compact particles through solutions of chain-polymers. Proc. R. Soc. Lond. A Math. Phys. Sci. 1973;333:297–316. [Google Scholar]
- 17.Johansson L., Lofroth J.E. Diffusion and interaction in gels and solutions. 4. Hard sphere Brownian dynamics simulations. J. Chem. Phys. 1993;98:7471–7479. [Google Scholar]
- 18.Nandigam R.K., Kroll D.M. Three-dimensional modeling of the brain's ECS by minimum configurational energy packing of fluid vesicles. Biophys. J. 2007;92:3368–3378. doi: 10.1529/biophysj.106.095547. [DOI] [PMC free article] [PubMed] [Google Scholar]
- 19.Hrabe J., Hrabetová S., Segeth K. A model of effective diffusion and tortuosity in the extracellular space of the brain. Biophys. J. 2004;87:1606–1617. doi: 10.1529/biophysj.103.039495. [DOI] [PMC free article] [PubMed] [Google Scholar]
- 20.Nicolau D.V., Jr., Hancock J.F., Burrage K. Sources of anomalous diffusion on cell membranes: a Monte Carlo study. Biophys. J. 2007;92:1975–1987. doi: 10.1529/biophysj.105.076869. [DOI] [PMC free article] [PubMed] [Google Scholar]
- 21.Jin S., Zador Z., Verkman A.S. Random-walk model of diffusion in three dimensions in brain extracellular space: comparison with microfiberoptic photobleaching measurements. Biophys. J. 2008;95:1785–1794. doi: 10.1529/biophysj.108.131466. [DOI] [PMC free article] [PubMed] [Google Scholar]
- 22.Phillips R.J., Deen W.M., Brady J.F. Hindered transport of spherical macro-molecules in fibrous membranes and gels. AIChE J. 1989;35:1761–1769. [Google Scholar]
- 23.Clague D.S., Phillips R.J. Hindered diffusion of spherical macromolecules through dilute fibrous media. Phys. Fluids. 1996;8:1720–1731. [Google Scholar]
- 24.Jain R.K., Stylianopoulos T. Delivering nanomedicine in solid tumors. Nat. Rev. Clin. Oncol. 2010 doi: 10.1038/nrclinonc.2010.139. EpubSeptember 14 2010. [DOI] [PMC free article] [PubMed] [Google Scholar]
- 25.McKee T.D., Grandi P., Jain R.K. Degradation of fibrillar collagen in a human melanoma xenograft improves the efficacy of an oncolytic herpes simplex virus vector. Cancer Res. 2006;66:2509–2513. doi: 10.1158/0008-5472.CAN-05-2242. [DOI] [PubMed] [Google Scholar]
- 26.Brown E., McKee T., Jain R.K. Dynamic imaging of collagen and its modulation in tumors in vivo using second-harmonic generation. Nat. Med. 2003;9:796–800. doi: 10.1038/nm879. [DOI] [PubMed] [Google Scholar]
- 27.Chauhan V.P., Lanning R.M., Jain R.K. Multiscale measurements distinguish cellular and interstitial hindrances to diffusion in vivo. Biophys. J. 2009;97:330–336. doi: 10.1016/j.bpj.2009.03.064. [DOI] [PMC free article] [PubMed] [Google Scholar]
- 28.Stylianopoulos T., Barocas V.H. Volume averaging theory for the study of the mechanics of collagen networks. Comput. Methods Appl. Mech. Eng. 2007;196:2981–2990. [Google Scholar]
- 29.Stylianopoulos T., Barocas V.H. Multiscale, structure-based modeling for the elastic mechanical behavior of arterial walls. J. Biomech. Eng. 2007;129:611–618. doi: 10.1115/1.2746387. [DOI] [PubMed] [Google Scholar]
- 30.Stylianopoulos T., Bashur C.A., Barocas V.H. Computational predictions of the tensile properties of electrospun fiber meshes: effect of fiber diameter and fiber orientation. J. Mech. Behav. Biomed. Mater. 2008;1:326–335. doi: 10.1016/j.jmbbm.2008.01.003. [DOI] [PMC free article] [PubMed] [Google Scholar]
- 31.Stylianopoulos T., Yeckel A., Barocas V.H. Permeability calculations in three-dimensional isotropic and oriented fiber networks. Phys. Fluids. 2008;20:123601. doi: 10.1063/1.3021477. [DOI] [PMC free article] [PubMed] [Google Scholar]
- 32.Barocas V.H., Tranquillo R.T. An anisotropic biphasic theory of tissue-equivalent mechanics: the interplay among cell traction, fibrillar network deformation, fibril alignment, and cell contact guidance. J. Biomech. Eng. 1997;119:137–145. doi: 10.1115/1.2796072. [DOI] [PubMed] [Google Scholar]
- 33.Beenakker C.W.J. Ewald sum of the Rotne-Prager tensor. J. Chem. Phys. 1986;85:1581–1582. [Google Scholar]
- 34.Kim S., Mifflin R.T. The resistance and mobility functions of two equal spheres in low-Reynolds-number flow. Phys. Fluids. 1985;28:2033–2045. [Google Scholar]
- 35.Jeffrey D.J., Onishi Y. Calculation of the resistance and mobility functions for two unequal rigid spheres in low-Reynolds-number flow. J. Fluid Mech. 1984;139:261–290. [Google Scholar]
- 36.Phillips R.J., Brady J.F., Bossis G. Hydrodynamic transport properties of hard-sphere dispersions: I. Suspensions of freely mobile particles. Phys. Fluids. 1988;21:3462–3472. [Google Scholar]
- 37.Phillips R.J., Brady J.F., Bossis G. Hydrodynamic transport properties of hard-sphere dispersions: II. Porous media. Phys. Fluids. 1988;31:3473–3479. [Google Scholar]
- 38.Brady J.F., Phillips R.J., Bossis G. Dynamic simulation of hydrodynamically interacting suspensions. J. Fluid Mech. 1988;195:257–280. [Google Scholar]
- 39.Raub C.B., Suresh V., George S.C. Noninvasive assessment of collagen gel microstructure and mechanics using multiphoton microscopy. Biophys. J. 2007;92:2212–2222. doi: 10.1529/biophysj.106.097998. [DOI] [PMC free article] [PubMed] [Google Scholar]
- 40.Braeckmans K., Remaut K., Demeester J. Line FRAP with the confocal laser scanning microscope for diffusion measurements in small regions of 3-D samples. Biophys. J. 2007;92:2172–2183. doi: 10.1529/biophysj.106.099838. [DOI] [PMC free article] [PubMed] [Google Scholar]
- 41.Chary S.R., Jain R.K. Analysis of diffusive and convective recovery of fluorescence after photobleaching-effect of uniform flow field. Chem. Eng. Commun. 1987;55:235–249. [Google Scholar]
- 42.Meyvis T.K.L., De Smedt S.C., Demeester J. Fluorescence recovery after photobleaching: a versatile tool for mobility and interaction measurements in pharmaceutical research. Pharm. Res. 1999;16:1153–1162. doi: 10.1023/a:1011924909138. [DOI] [PubMed] [Google Scholar]
- 43.Crank J. Oxford University Press; New York: 1975. The Mathematics of Diffusion. [Google Scholar]
- 44.Phillips R.J. A hydrodynamic model for hindered diffusion of proteins and micelles in hydrogels. Biophys. J. 2000;79:3350–3353. doi: 10.1016/S0006-3495(00)76566-0. [DOI] [PMC free article] [PubMed] [Google Scholar]
- 45.Amsden B. Solute diffusion within hydrogels. Mechanisms and models. Macromolecules. 1998;31:8382–8395. [Google Scholar]
- 46.Xiao F., Nicholson C., Hrabetová S. Diffusion of flexible random-coil dextran polymers measured in anisotropic brain extracellular space by integrative optical imaging. Biophys. J. 2008;95:1382–1392. doi: 10.1529/biophysj.107.124743. [DOI] [PMC free article] [PubMed] [Google Scholar]
- 47.Johnson E.M., Deen W.M. Electrostatic effects on the equilibrium partitioning of spherical colloids in random fibrous media. J. Colloid Interface Sci. 1996;178:749–756. [Google Scholar]
- 48.Stylianopoulos T., Poh M.Z., Jain R.K. Diffusion of particles in the extracellular matrix: the effect of repulsive electrostatic interactions. Biophys. J. 2010;99:1342–1349. doi: 10.1016/j.bpj.2010.06.016. [DOI] [PMC free article] [PubMed] [Google Scholar]
Associated Data
This section collects any data citations, data availability statements, or supplementary materials included in this article.