

Abstract
Fundamental understanding of cellular processes at molecular level is of considerable importance in cell biology as well as in biomedical disciplines for early diagnosis of infection and cancer diseases, and for developing new molecular medicine-based therapies. Modern biophotonics offers exclusive capabilities to obtain information on molecular composition, organization, and dynamics in a cell by utilizing a combination of optical spectroscopy and optical imaging. We introduce here a combination of Raman microspectrometry, together with coherent anti-Stokes Raman scattering (CARS) and two-photon excited fluorescence (TPEF) nonlinear optical microscopy, to study macromolecular organization of the nucleus throughout the cell cycle. Site-specific concentrations of proteins, DNA, RNA, and lipids were determined in nucleoli, nucleoplasmic transcription sites, nuclear speckles, constitutive heterochromatin domains, mitotic chromosomes, and extrachromosomal regions of mitotic cells by quantitative confocal Raman microspectrometry. A surprising finding, obtained in our study, is that the local concentration of proteins does not increase during DNA compaction. We also demonstrate that postmitotic DNA decondensation is a gradual process, continuing for several hours. The quantitative Raman spectroscopic analysis was corroborated with CARS/TPEF multimodal imaging to visualize the distribution of protein, DNA, RNA, and lipid macromolecules throughout the cell cycle.
Introduction
The cell nucleus organization, its structure, and functions are extraordinarily complex and, in the postgenomic era, represent a major interest in cell and molecular biology.
It has been well established that although the cell nucleus does not contain internal membranes, many specific macromolecular complexes concentrate into discrete subnuclear domains which participate in the regulatory functions and structural organization of the cell. This phenomenon is known as nuclear structure-functional compartmentalization and examples include synthesis of ribosomes in the nucleolus (1), RNA processing in the nuclear speckles (2), uneven folding of DNA into relaxed euchromatin and densely packed heterochromatin domains (3), regulation of vital cellular processes into distinct nuclear bodies (4), and organization of DNA and RNA synthesis in discrete sites (5,6).
Such strict structure-function specialization implies the formation of specific molecular composition in the subnuclear domains (7). However, the local molecular environments cannot be fully assessed by the conventional immunocytochemical optical and electron microscopy techniques because they do not provide any direct information on the presence of nonlabeled molecular components. Although a part of this problem has been addressed by electron microscopy-spectroscopic imaging (8), an understanding of local biochemical compositions in the nuclear structures is still limited and currently is an exciting frontier in biomedical sciences.
Recent advancements in biophotonics have provided a combination of spectroscopic and microscopic approaches to study the molecular organization, interaction, and dynamics in live cells (9). Particularly, the nonresonant vibrational Raman scattering analysis and its nonlinear optical modification, coherent anti-Stokes Raman scattering (CARS), are at the core of optical spectroscopy and imaging techniques valuable for characterization of biological samples. The optical signal of Raman scattering is associated with specific frequencies of molecular vibrations which provide information on chemical composition and molecular structure of biological materials. In biological samples, Raman scattering allows for selective detection of major classes of organic molecules: DNA, RNA, proteins, lipids, and carbohydrates. Furthermore, because the intensity of peaks of the acquired Raman spectra is linearly dependent on the sample concentration (10), confocal Raman microspectroscopy can be used for quantitative analysis of local molecular composition (11–13). Raman microspectroscopy does not require extrinsic labels or probes; moreover, it is an absorption-free and nondestructive process of data collection. Raman and infrared molecular imaging provide valuable insight into the cellular organization dynamically transformed throughout the cell cycle (14–16). An active Raman process through the nonlinear optical interaction is CARS, which provides signals 5–6 orders-of-magnitude stronger than those of spontaneous Raman process (17), allowing for label-free vibrationally selective molecular imaging of biological samples (15). The key advantages of CARS microscopy include noninvasiveness, submicron three-dimensional resolution, chemical selectivity/specificity, and sensitivity sufficient for imaging of biological samples. Because the CARS technique normally utilizes high-intensity picosecond infrared laser pulses for image generation, a simultaneous detection of CARS, together with fluorescence signal in the two-photon excited fluorescence (TPEF) mode, can also be achieved (18).
Here, we apply a combination of Raman microspectrometry and CARS/TPEF imaging for the study of macromolecular organization of the nucleus in HeLa cells throughout the cell cycle. Raman microspectrometry was used for quantitative analysis of site-specific concentrations of major classes of organic molecules: proteins, lipids, DNA, and RNA, while multimodal CARS/TPEF microscopy yielded information on the spatial distribution of these macromolecules as well as their reorganization during the cell cycle. Because the CARS imaging cannot clearly separate DNA and RNA because of the close proximity of their vibrational spectra, in our experiments we applied TPEF of acridine orange fluorophore, which selectively labels nucleic acids (green fluorescence in complex with DNA and red fluorescence in complex with RNA (9,19)) to distinguish between RNA and DNA spatial distributions.
To the best of our knowledge, this is the first report on the macromolecular composition of subnuclear domains such as the nucleolus, nuclear speckles, DNA transcription sites, and constitutive heterochromatin, measured in situ. Moreover, DNA compaction was quantitatively assessed throughout the cell cycle. Surprisingly, our data show no correlation between the extent of DNA compaction and local concentration of proteins. Finally, we show that multimodal CARS/TPEF imaging can be a valuable tool for the analysis of global macromolecular organization of cells and tissues.
Materials and Methods
Cell culture, synchronization, and fluorescent staining
HeLa cells were grown in glass-bottom dishes (MatTek, Ashland, MA) and cultured in Advanced DMEM (Invitrogen), supplemented with 2.5% fetal calf serum (Sigma, St. Louis, MO), 1% glutamax, 1% Antibiotic Antimycotic Solution (Sigma) at 37°C in a humidified atmosphere containing 5% CO2. Synchronization of mitotic cells was achieved by shake off, and the cells at G1/S border were synchronized by a double-aphidicolin block: cells were incubated in DMEM containing 10 μg/mL of aphidicoline for 16 h, then in a fresh medium for 14 h and again for 16 h in a medium containing aphidicolin. Raman spectra for early, mid, and late S-phases were acquired at 2, 5, and 12 h, respectively, after the release from the aphidicolin block. To stain nucleic acids, the live cells were incubated for 20 min with 5 μM acridine orange. Nascent RNA transcripts were labeled by incubation with 50 μM 5-fluorouridine (Fluka, St. Louis, MO) for 15 min.
Distinct subnuclear domains were visualized via the immunolabeling procedure: the cells were fixed 12 min in 4% PFA/PBS, permeabilized 5 min in 0.25% Triton X-100, and subsequently incubated with primary and secondary antibodies (data presented in Fig. 1, A–D, and in Fig. S9, A–H, in the Supporting Material). The following primary antibodies were used: mouse anti-SC-35 antibody, rabbit anti-centromeric Protein B, and anti-nucleolin antibodies (Abcam, Cambridge, Cambridgeshire, United Kingdom), and rat anti-BrdU antibody (Harlan Sera-Lab, Loughborough Leicestershire, United Kingdom). The secondary anti-rabbit, anti-mouse, and anti-rat antibodies were conjugated with Alexa-488 (Invitrogen, Carlsbad, CA).
Figure 1.
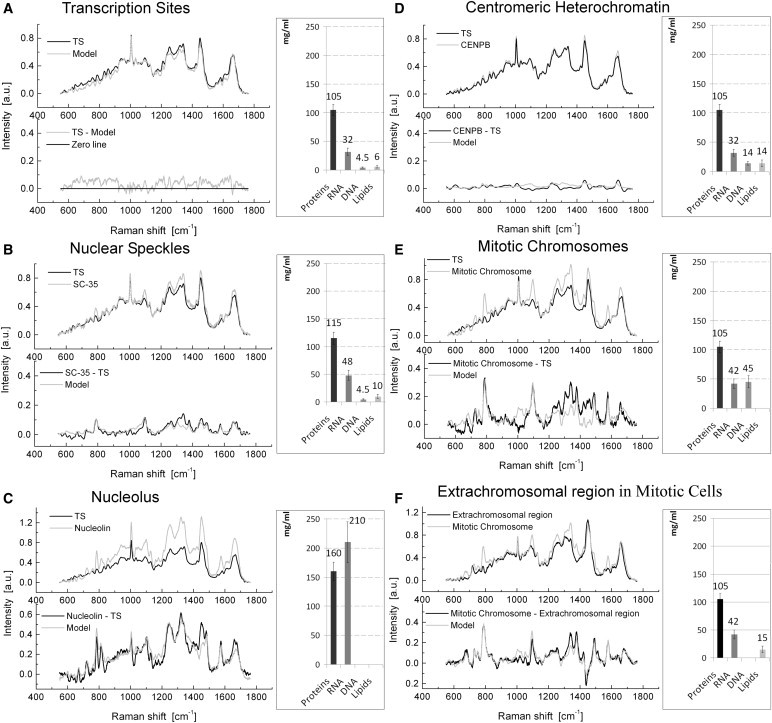
Concentration analysis of Raman spectra acquired in the labeled domains of the cell nucleus and in mitotic cell. The Raman spectra were acquired in the major subnuclear domains, and in the mitotic chromosomes and extrachromosomal regions of the mitotic cells. The DNA transcription sites (TS), nuclear speckles, nucleoli, and domains of constitutive heterochromatin were visualized in the fixed cells (data shown on A–D) by the immunofluorescent labeling of nascent transcripts, splicing factor SC-35, nucleolar protein nucleolin, and centromeric protein B (CENPB), respectively, using Alexa-488 conjugate. The mitotic chromosomes were visualized in live cells (data shown on E and F) by either acridine orange staining or in the transmission light. The presented spectra were averaged from 10 measurements for each type of site in the cell nucleus or in the mitotic cell. (A) (Top chart) The averaged Raman spectrum of TS is shown in solid representation. The model of TS spectrum, generated as the best proportion match of weighted spectral sum of the concentration calibrated reference spectra of DNA, RNA, proteins, and lipids, is shown in shaded representation. (Bottom chart) The difference between the model spectrum and the averaged spectrum acquired from TS. The subtraction result indicates a close match of a model to the actual spectrum measured in TS. (B–E) (Top charts) Raman spectra (shading) in nuclear speckles (B), nucleoli (C), centromeric heterochromatin domains (D), mitotic chromosomes (E), and the Raman spectrum of TS (solid representation). (Bottom charts) Overlays of the differential spectra of the corresponding site and the spectrum of TS (solid representation) and the generated models (shading) used for quantitative assessment of the spectra difference. (F) (Top chart) The Raman spectrum of extrachromosomal regions of mitotic cell (solid representation) and the spectrum of mitotic chromosomes (shading). (Bottom chart) The difference of the Raman spectra of extrachromosomal regions and the Raman spectrum of mitotic chromosomes; and overlay with the model spectrum difference simulation (shading). The averaged concentrations of DNA, RNA, proteins, and lipids in the nuclear domains and mitotic cells, derived from model spectra analysis (diagrams at the right). The concentration is given in mg/mL. (Error bars) Experimental errors.
The mitotic chromosomes were visualized using transmitted light, or fluorescence of acridine orange stain (Fig. 1, E and F, and Fig. S9, I–L). For live-cell assays (data presented on Fig. 1, E and F, and Figs. 2 and 3), the cells were maintained in a Live-Cell incubator (Spectra Services, Ontario, NY) mounted at the microscope stage.
Figure 2.
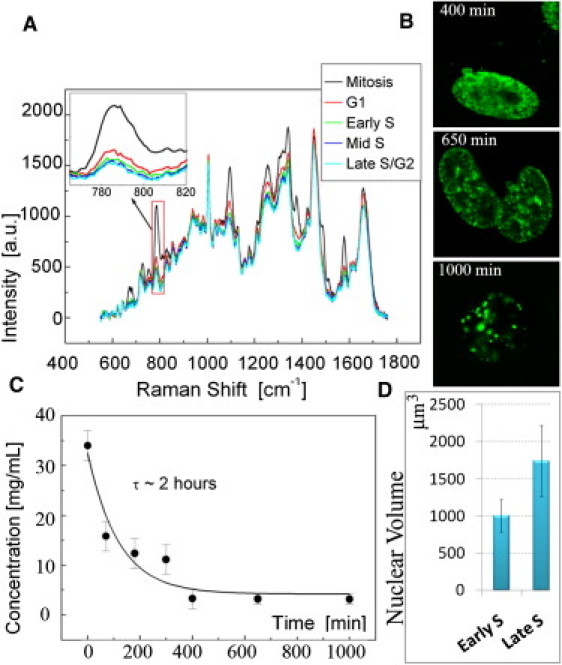
Dynamics of DNA concentration throughout the cell cycle. Presented spectra are averaged from 10 independent measurements. (A) Raman spectra acquired in live cells on mitotic chromosomes or in interphase nuclei synchronized in G1, early, mid, and late S/G2-phase. The intensity peak used for measurement of the DNA concentration (red outline) was enlarged and rescaled (left corner). (B) DNA concentration dependence on time. Cells were acquired during the mitosis (0 min) and averaged 70, 300, 400, 650, and 1000 min after the completion of mitosis. (C) The BrdU incorporation pattern confirms the synchronization of the last three time points to the early, mid, and late S-phase. (D) The volume of the cell nucleus averaged in early and late S-phase. (Error bars) Standard deviation.
Figure 3.
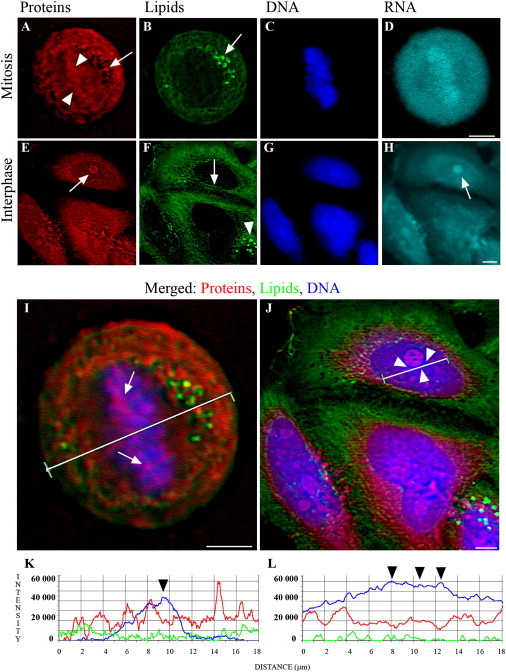
Multimode TPEF/CARS images of the live mitotic and interphase cell obtained in a single scan. Imaging was performed in live cells. (A–H) Images of proteins (A and E), lipids (B and F), DNA (C and G), and RNA (D and H) in mitotic and interphase cells, respectively. Proteins and lipids were visualized by CARS and DNA and RNA by selective staining with acridine orange. During mitosis, proteins were organized into a complex structure covering the entire cell. Accumulations of proteins in the center of the dividing cell were seen (arrowheads). Bright focal accumulations of the proteins and lipids at the periphery of mitotic cells were frequently observed (arrows). In the interphase nucleus, the strongest protein signal corresponds to the nucleolus (arrow). Lipids are accumulated in the nuclear envelope (arrow) and the lipid droplets in cytoplasm (arrowhead). The strongest RNA signal corresponds to the nucleolus (arrow). (I and J) Enlarged images of mitotic and interphase cells with merged signals from proteins (red), lipids (green), and DNA (blue). In the mitotic cell protein clusters, partially overlapping mitotic chromosomes are seen (arrows in I). In the interphase cell, a line profile crosses a condensed perinucleolar chromatin (arrowheads in J). (K and L) Signal intensity line profile through mitotic cell (K) and interphase cell nucleus (L), with DNA (blue), proteins (red), and lipids (green). (Arrowheads) Indication that an increase in DNA compaction does not correlate with an increase in the proteins' signal. (Scale bars) 5 μm.
Raman microspectrometry: instrumentation, calibration, and data analysis
Our custom-made confocal Raman microspectrometer is based on an inverted model No. TE200 microscope (Nikon, Melville, NY) equipped with a He-Ne excitation laser (632.8 nm, Coherent, Santa Clara, CA) excitation laser, fiber-input MS3501i imaging monochromator/spectrograph (Solar TII, Minsk, Belarus), and a S9974 series charge-coupled device camera (Hamamatsu, Hamamatsu City, Japan) cooled down to −60°C (Fig. S1 A). This configuration provides the Raman spectral measurement within the spectral range of 600–3000 cm−1. The spectral resolution for the fixed diffraction grating position (wavenumber interval of 1210 cm−1) was ∼1.5 cm−1. An excitation beam of ∼30 mW laser power is focused onto the sample in a spot of ∼0.8 μm using a 100× NA = 1.3 oil-immersion objective lens (Nikon) (Fig. S1 B). A xenon light source (X-Cite 120 PC, Mississauga, Ontario, Canada), B2-A filter (Nikon), and MicroPublisher 3.3RTW charge-coupled device camera (Q-Imaging, Surrey, British Columbia, Canada) were used to visualize fluorescence signal.
On-axis spatial resolution of our Raman microspectrometer was determined to be ∼2.5 μm by measuring the full width at half-maximum of the Raman line intensity dependence of 1001 cm−1 styrene phenyl ring vibration peak along ∼500-nm-thick polystyrene film. The integration time for Raman spectra in cells was 300 s. Our measurements performed on live cells using a laser power of up to 30 mW for Raman scattering excitation did not produce any visible morphological changes of cells (Fig. S2), and showed no cytotoxicity by standard viability tests (see also (20)). Nevertheless, we performed a single measurement per cell to avoid cells overexposure to laser radiation.
In the live-cell assays, the measurements were not affected by cell motion because Raman spectra were measured in the relatively large cellular sites. Raman measurements of the small-sized domains was enabled by cell fixation; to ensure the absence of vibration, thermal drift or other motion in our system during experiments, we visually verified the XYZ position of the cell before and after each measurement.
The Raman spectrometer was properly calibrated to measure concentrations of bovine serum albumin protein, salmon sperm DNA, Saccharomyces cerevisiae RNA, and bovine heart lipid solutions through the Raman line intensity measurements at the characteristic vibrations: 1005 cm−1 for proteins, 783–813 cm−1 or RNA/DNA, and 1657 cm−1 for lipids (Fig. S3 A). Then the concentration calibration was double-checked using known mixtures of proteins, RNA, and DNA solutions (Fig. S3, B and C).
Before analysis, all Raman spectra were preprocessed for background subtraction and baseline correction (Fig. S4). All measurements in each cellular site were reproduced 10 times from randomly chosen cells with representative morphology. The averaged Raman spectra were used for further analysis. To minimize autofluorescence background, we applied a digital differential Raman technique (21) and analyzed the difference between the spectra obtained from different sites.
Control experiments were performed on formaldehyde fixed mitotic cells to verify any potential effect of fixation on the Raman spectra. No clear difference between the results of measurements in live and fixed cells was observed (Fig. S5).
CARS-TPEF setup
A simplified schematic for the CARS setup is shown in Fig. S1 C. A picosecond Nd:YVO4 (picoTRAIN IC-10000/532-4000; HighQ Laser, Watertown, MA) with pulse width ∼7 ps and a repetition rate of 76 MHz was used as the source of the Stokes wave at ωs (1064 nm) and for synchronous pump (532 nm) of a tunable (680–980 nm) optical parametric oscillator (Levante Emerald, APE, Berlin, Germany) with an output pulse width of ∼6 ps. The synchronously pumped optical parametric oscillator serves as a source of the pump/probe wave at
The two picosecond laser waves are made coincident in time and space using a series of dichroic mirrors and line delay, and focused onto a sample using a 60× NA = 1.3 objective lens (Olympus, Melville, NY). CARS is a four-wave mixing process involving the pump/probe wave and the Stokes wave at frequencies ωp and ωs, respectively. When the beating frequency
is tuned to be resonant with a vibrational mode ω of a selected chemical bond, an enhanced CARS signal is detected at the anti-Stokes frequency of
Using our instrument design, a sample can be imaged in the CARS mode in the vibrational frequency range of 900–3300 cm−1 and simultaneously in the TPEF microscopy mode. A galvano scanner (GSI Lumonics, Oxnard, CA) scanned the sample in the lateral focal plane with resolution 500 × 500 pixels with a rate of ∼1 frame/s. Coincided linear polarizations of Stokes and pump/probe waves are computer-controlled by tuning Glan Thompson polarizers (Harrick Scientific, Pleasantville, NY), P1 and P2. The anti-Stokes CARS signal, generated in the forward direction, is collected by an objective O2 with NA = 0.75 and directed to the photomultiplier tube. The nonlinear nature of the CARS process in the beam waist provided the confocality of CARS-microscopy with 0.2 μm lateral and ∼1 μm axial resolutions. Thus, the CARS signal is generated from a tiny volume (<1 μm3). Imaging of lipids and proteins was performed at 2840 cm−1 and 2928 cm−1, respectively (Fig. S6). CARS images were extracted from the nonlinear nonresonant background by the standard procedure of digital subtraction of the images obtained at away from the resonance frequency from the one at the resonance frequency.
Linear combination spectral model: discussion and verification
We used a linear combination model (13,22–24) in the Raman spectra analysis for experimental evaluation of the local intracellular/intranuclear biomolecular composition. This model was applied to generate a model spectrum through the linear summation of weighted spectra of the basic classes of organic biomolecules—DNA, RNA, proteins, and lipids (25)—and to obtain a fractional fit contribution of each component to differential Raman spectrum of each nuclear site.
Based on the close proximity of the Raman spectra of the same class of the biomolecules (26–29), we have assumed as the reference spectra of cellular proteins, DNA, RNA, and lipids, the Raman spectra of bovine serum albumin protein, salmon sperm DNA, S. cerevisiae RNA, and bovine heart lipid extract, correspondingly (Fig. S7).
However, a spectral modeling process usually assumes a mismatch between the model and the measured spectra producing a difference or residual spectrum (13,22–24). A major source of the residual spectrum is due to the difference between the model reference spectrum and Raman spectra of a broad variety of macromolecules within each group. The cell nucleus contains many thousands of individual proteins and genomic DNA and RNA sequences, which can produce differences in Raman spectra. Another source of residual spectra is due to the presence of other components (amino acids, nucleotides, small metabolites, etc.) in the cell nuclear interior, which cannot be taken into account by the model. Despite the low concentration of these components, their overall contribution to the residual Raman spectra could be significant. Additional source of residual spectra could be potentially caused by a complex interference between different types of macromolecules. Therefore, in our study, the most intense and stable characteristic peaks in the measured and the model spectra were targeted for the fitting procedure, instead of overall shape matching. The following four spectral bands of Raman biomolecular signatures—783–813 cm−1 for RNA, 783 cm−1 for DNA, 1005 cm−1 for proteins, and 1664 cm−1 for lipids—were selected to obtain vanishing of the peak intensities in the residual spectra, with accuracy ∼1%. Then, the intensities of characteristic lines in the weighted spectrum of each component, obtained through the modeling process, were used to convert Raman signal counts to the concentration units using the calibration plots shown in the Fig. S3.
The overall concentration deviation generated during Raman spectrometry analysis (shown as error bars in graphs) was calculated as a summation of standard deviation of measurements and the error of fitting of spectral data into the chosen model. These deviations inversely depend on the local concentration and do not exceed ±10% for proteins, ±19% for RNA, ±23% for DNA, and ±40% for lipids.
To verify the relevance of our model approach for an actual biological sample, we measured the biochemical composition of Escherichia coli bacteria. The size of this bacterium is close to the laser-beam waist diameter, and therefore intracellular spatial variations in concentration of biomolecules should not influence the concentration measurements. This allowed for a direct comparison of molecular composition of bacteria obtained by Raman spectroscopic and biochemical analyzes (25). By our modeling approach, we found the composition content of DNA, lipids, RNA, and proteins in this bacterium as ∼1.8%, 1.2%, 9%, and 16.5% respectively (Fig. S8). These estimations are close to the data obtained by conventional biochemical methods which are ∼1%, 2%, 6%, and 15%, correspondingly, and the residuals are represented by water (70%), saccharides (3%), and small metabolites and inorganic molecules (3%) (25). Good agreement of the data supports validity, relevance, and acceptance of our model for the intracellular biomolecular analysis.
Results
Raman spectral analysis in the nuclear compartments
To perform a concentration analysis of major subnuclear domains in situ, the nucleoli, extranucleolar DNA transcription sites, nuclear speckles, and centromeric constitutive heterochromatin domains were visualized by fluorescence staining in the fixed interphase cells (Fig. S9).
The acquisition of Raman spectra and concentration analysis of DNA, RNA, proteins, and lipids was performed as described in Materials and Methods. The result of spectral analysis is shown in Fig. 1 as macromolecular profiles in the composition of each subnuclear structure. Because the dimensions of the individual transcription sites were usually smaller than the size of the focused laser probe, their spectra could have included the signal from the nearby space.
Raman spectrometry analysis showed that there is no significant difference in the concentration of the proteins in various subnuclear domains, with the exception of nucleolus. The local concentrations of proteins were ∼105 mg/mL in the transcription sites and heterochromatin, ∼115 mg/mL in the nuclear speckles, and ∼160 mg/mL in the nucleolus (Fig. 1, A–D).
Following the proteins, the most abundant nuclear macromolecule is RNA. We measured the RNA concentration in the transcription sites and constitutive heterochromatin, at ∼32 mg/mL (Fig. 1, A and D). The molecular composition difference between these subnuclear domains is reflected by the DNA/RNA ratio, which was ∼1:7 in transcription sites and only ∼1:2 in the transcriptionally dormant heterochromatin (Fig. 1, A and D). This quasiuniform concentration of the RNA can be expected from its distribution in the cell nucleus via thermal diffusion (30). However, consistent with the role of the nuclear speckles in RNA processing (2), the local RNA concentration was observed to be higher (∼48 mg/mL) in these domains (Fig. 1 B). In the nucleoli, reflecting ribosomal RNA synthesis, we found an almost-sevenfold increase in the RNA concentration (∼210 mg/mL) (Fig. 1 C).
Consistent with the biochemical evaluations (see Materials and Methods and (25)), the concentration of DNA in the nuclear volume was significantly lower than that of proteins and RNA. In the transcription sites, the DNA concentration was estimated to be ∼4.5 mg/mL (Fig. 1 A). The same DNA concentration as in the transcription sites was measured in the nuclear speckles (∼4.5 mg/mL) (Fig. 1 B). Previous reports (31,32) indicate that the interior of nuclear speckles does not contain any significant amount of DNA. Our analysis, however, could have included the content of the periphery of nuclear speckles because of the size limitations of the focused laser probe.
In the domains of centromeric constitutive heterochromatin, which is devoid of gene sequences and is highly compacted, the DNA concentration was three-times higher (∼14 mg/mL) than in actively transcribed chromatin (Fig. 1 D).
Consistently with negative staining of the nucleolus by the DNA dyes (33), the intensity peaks from DNA at the Raman spectra were below the detection threshold in this subnuclear compartment (Fig. 1 C).
Finally, the intranuclear concentration of lipids was found to be highest in the centromeric heterochromatin (∼14 mg/mL), followed by the nuclear speckles (∼10 mg/mL) (Fig. 1, D and B). In the transcription sites, the concentration of lipids averaged ∼6 mg/mL, while in the nucleolus, it was below the detection threshold (Fig. 1, A and C). It is worth noting that while lipids are accumulated mostly in the cell membranes, the free lipids and lipoproteins are also present in the nuclear interior, participating in modifications and compaction of chromatin and other nuclear functions (34,35). In addition to the nuclear lipids, invaginations of the nuclear envelope (36) could have contributed to the measured signal in the cell nucleus.
Probing of the nuclear composition throughout the cell cycle
The molecular composition of the nuclear material can be altered through the cell cycle by such factors as the growth of the cell nucleus (37) and coordinated synthesis of macromolecules including the duplication of genome, compaction of DNA, and collapse of the nuclear envelope during mitosis.
To assess the cell-cycle related variations in the macromolecular content of chromatin, live mitotic (specifically metaphase) HeLa cells were located in an exponentially growing population by transmission light microscopy. The Raman spectra were acquired with the laser beam focused either in the middle of a chromosomal metaphase plate or at the extrachromosomal domains in the periphery of mitotic cells. In some experiments, laser focusing was facilitated by acridine orange staining of DNA (Fig. S9, I and J). In the mitotic chromosomes, the most abundant group of macromolecules is proteins. The local concentration of proteins in chromosomes was ∼105 mg/mL, which is the same as in the nucleoplasm of the interphase cell nucleus (Fig. 1 E). The highest concentration of DNA measured throughout the cell cycle was in the mitotic chromosomes (∼44.5 mg/mL) (Fig. 1 E, Fig. 2 A). At the same time, Raman microspectrometry revealed that the RNA was present in the volume of mitotic chromosomes at a local concentration of ∼42 mg/mL, and lipid presence was below the sensitivity of our setup (Fig. 1 E).
The concentrations of RNA and proteins at the periphery of mitotic cells (Fig. 1 F) were found to be the same as in mitotic chromosomes (∼42 mg/mL, and ∼105 mg/mL, respectively), which is suggestive of a diffusion-driven distribution for RNA and proteins' macromolecules in mitotic cells. The concentration of lipids in the periphery of mitotic cell approaches 15 mg/mL. This signal apparently corresponds to cytoplasmic organelles and disintegrated nuclear envelope. Despite the evident presence of mitochondria in these regions, the DNA signal was below the detection threshold. In the control experiments, the same concentrations of biomolecules were measured in fixed mitotic cells (Fig. S5).
Upon entrance of cells into the interphase, Raman spectra were acquired in live cells at random sites localized toward the nuclear interior and devoid of visible clumps of heterochromatin, or at transcription sites in the control experiments at fixed cells. The obtained values demonstrated a gradual process of postmitotic DNA decondensation. Unlike the premitotic chromatin condensation, which is a very dynamic process and occurs in minutes during the prophase (38), chromatin decondensation in G1-phase continues for several hours (Fig. 2 B). The dynamics of chromatin decondensation fits into an exponential decay, with an exponential decay time of ∼120 min. This process continues until the local concentration of DNA reaches ∼4.5 mg/mL at more advanced stages of the interphase. This concentration was not visibly changed throughout the DNA synthetic phase of the cell cycle, as verified by monitoring the BrdU incorporation into the replicating DNA pattern (6) in the control cells (Fig. 2 C) and stringed synchronization on the G1/S border with a double-aphidicolin block. This quasiuniform concentration was accompanied with a gradual increase of the size of cell nucleus during the S-phase (39) that provides an additional space to accommodate the newly synthesized DNA. Experimental estimation of the increase of the cell nuclear volume was ∼1.7 times throughout the S-phase, from the averaged ∼1003 μm3 in the early S-phase to ∼1741 μm3 in the late S-phase (Fig. 2 D). Thus, given the increase of the nuclear size and an experimental deviation accumulating due to the differences between individual cells and the model fitting, we could not detect any substantial difference of the local DNA concentration throughout the S-phase.
Nonetheless, DNA was the only macromolecule whose local concentration was found to change throughout the cell cycle in mitosis and G1 phases. We did not observe differences in the concentrations of proteins, RNA, and lipids in the analyzed spectra acquired during the interphase (Fig. 2 A). At the same time, an advanced mathematical analysis of the micro-Fourier transform infrared spectra in the cell nucleus (40) permitted to derive minor spectral differences at G1, S, and G2 phases of the cell cycle.
CARS/TPEF imaging in interphase and mitotic cells
Infrared and Raman imaging has been successfully implemented for the analysis of the interphase and mitotic cells (14–16) and our multimodal CARS/TPEF imaging provides further information on the macromolecular organization in the nuclear region. Using TPEF signals of acridine orange in red and green spectral channels for imaging of RNA and DNA, respectively (19), we visualized mitotic cells with chromosomes organized in the metaphase plate. Consistent with Raman microspectroscopy, the signal from RNA showed a nearly uniform distribution both in the mitotic chromosomes and the extrachromosomal regions. CARS imaging of proteins (at 2928 cm−1; see Fig. S6) showed that they were distributed in an irregular pattern covering the entire cell volume. Longitudinal accumulations of the proteins partially overlapping with the condensed chromosomes were seen in the center of the mitotic cell (Fig. 3, A, I, and K). However, an overall increase in the protein signal in the entire volume of the mitotic chromatin was not observed (see Discussion). Local enrichments of the proteins on the cell periphery were usually present (arrow, Fig. 3 A). Lipids were found to be accumulated at the periphery of the cell, often forming droplets (bright foci, arrow, Fig. 3 B).
In the interphase cells, CARS/TPEF microscopy showed a substantial similarity in the distribution of macromolecules throughout the interphase. The CARS signal showed that proteins were accumulating in the nucleoli (arrow, Fig. 3 E). At the same time, similar to the mitotic cells, the line profile showed no significant accumulations of proteins in the sites of condensed chromatin visualized by the DNA staining (Fig. 3, J and L). The bulk signal from the lipids was located in the cytoplasm (Fig. 3 F). The only nuclear domain that clearly exhibited signal from lipids was the nuclear envelope (arrow, Fig. 3 F). However, weak signals from lipids, just slightly above the detection threshold, were frequently detected in the nuclear interior, as indicated by an intensity line profile (Fig. 3 J).
Discussion
Site-specific macromolecular profiles in the cell nucleus
The site-specific macromolecular profiles in the cell nucleus, obtained in this study, were consistent with the classical biochemical evaluations of the biomolecular composition of mammalian cells (25,41,42). These profiles reflect participation of the specific nuclear domains in the structural organization of the nuclear material and nuclear metabolism (see Fig. 1 and the imaging data in Fig. 3). The significance of our quantitative analysis is that the obtained molecular profiles can be used for assessment of the nuclear structural organization and metabolic activities in the cell nucleus such as the synthesis of ribosomal RNA in the nucleolus, RNA processing in the nuclear speckles, local fluctuations in the DNA compaction, etc. Because the Raman spectroscopic analysis is noninvasive for biological samples, it is applicable for live cells and tissues.
The molecular concentrations determined in the nuclear compartments are also informative for an understanding of nuclear organization. An important finding is that there is no increase in the protein concentration in the clusters of condensed chromatin. We observed that although the local concentration of DNA varied threefold in the interphase nuclei and 10-fold between interphase and mitotic chromatin (Fig. 1, A, D, and E), the measured concentration of proteins in chromatin was shown to be uniform (∼105 mg/mL) throughout the cell cycle. In our opinion, these Raman microspectroscopy and molecular imaging data can be cross-referenced with fluorescence-recovery-after-photobleaching experiments, which showed that associations of multiple chromatin binding proteins with DNA are transient and last for only a few seconds (43–46). Such a transient binding apparently underlies dynamically maintained concentration equilibrium of the proteins in chromatin of live cells. We propose that during the process of DNA compaction, the local concentration of histones and DNA packaging proteins is increased and this, subsequently, triggers a massive redistribution of proteins dissociated from their transient bonds to DNA, driven by a concentration gradient.
Furthermore, the fluorescence-recovery-after-photobleaching studies using GFP fusions and fluorescently stained RNA sequences indicated that nuclear organization is very dynamic and thermodynamic diffusion is apparently a major mechanism in the transport of nuclear macromolecules (42,44,47). Our measurements are consistent with this model and provide us with concentration equilibriums for crude proteins and RNA concentrations in the nuclei of HeLa cells, at ∼105 mg/mL and ∼32 mg/mL, respectively (Fig. 1). At the same time, prolonged macromolecular interactions, such as RNA synthesis and processing in the nucleolus and the nuclear speckles, result in accumulation of proteins and RNA into these domains (Fig. 1, B and D and Fig. 3 E).
Previously, a fundamental concept of the nuclear microenvironments, pointing to enrichment of specific nuclear factors in various subnuclear structures, has been developed (7). In our study, we have contributed to this concept by the demonstration of specific molecular profiles in the composition of subnuclear domains.
Quantitative interpretation of DNA compaction
DNA compaction in the cell nucleus is an important factor for the regulation of essential nuclear functions, including the gene expression, chromatin maintenance, and cell division. Traditionally, the DNA compaction is evaluated through the linear distance between the chromatin loci spaced by a known length of a DNA strand (48,49). Measurement of local DNA concentration allows assessment of the DNA compaction, by mathematical modeling of the volume occupied by DNA. The density of DNA can be estimated (theoretically) through the known parameters of weight, and physical volume of a DNA segment. For instance, the molecular mass of 1 Kb of DNA is ∼6.6 × 10⁵ Da or ∼1.1 × 10⁻¹² μg. The volume of 1 Kb of naked DNA can be estimated by the dimensions of DNA as a cylinder of 1 nm in radius and 340-nm length (based on the 0.34-nm distance between neighboring basepairs) multiplied by 1000 (number of basepairs). According to the equation
the volume of such a cylinder is
Then the DNA density would be
In support of these calculations, Raman microspectroscopy measurements of air-dried DNA resulted in a value of ∼0.88 g/mL (data not shown). Based on this and the concentration of DNA in mitotic chromosome obtained by our measurements (44.5 mg/mL ± 10%), it was calculated that DNA occupies ∼5% of the volume of the chromosome with 95% being occupied by other constituents (water and other inorganic/organic molecules). Similarly, in the interphase cell nuclei, the DNA content fluctuates between ∼0.5% and ∼1.5% in transcriptionally active chromatin and heterochromatin domains, respectively (Fig. 1, A, D, and E).
These estimations of DNA compaction are in agreement with biochemical quantitative analysis, which show that DNA comprises ∼0.25% of the average mammalian cell weight (25) and can be useful for modeling the local accessibility of DNA in chromatin.
Conclusions
We demonstrated the ability of micro-Raman spectroscopy and CARS/TPEF microscopy for molecular level studies beyond the conventional cell biology techniques. CARS imaging was enhanced by simultaneous TPEF microscopy, providing the selective visualization of major classes of biomolecules including DNA and RNA. The overall analysis of the Raman spectroscopy and CARS/TPEF imaging data in HeLa cells supports the view that the cell nucleus employs thermodynamic diffusion for transport of macromolecules. This statement is based on the nearly uniform distribution of the proteins (∼105 mg/mL) and RNA (∼32 mg/mL) in the transcription sites and domains of constitutive heterochromatin, which together constitute a significant part of the nuclear interior. The specific molecular composition profiles in the major structure-function nuclear compartments were obtained as well: in the nucleolus, the RNA and proteins are at the level of ∼210 mg/mL and ∼160 mg/mL, and in the nuclear speckles at ∼48 mg/mL and ∼115 mg/mL, respectively. The concentration of DNA was ranging from 4.5 mg/mL in the transcriptionally active chromatin to ∼14 mg/mL in the domains of the constitutive heterochromatin. These data are in good compliance with modern concepts in the cell nuclear field and provide us with a deeper understanding of organization of molecular processes in the cell.
Acknowledgments
The authors are grateful to Drs. Earl J. Bergey, Kenneth M. Tramposch, Stanley Bruckenstein, Alexander Baev, and Tymish Ohulchanskyy for extensive discussions.
These studies were supported by a grant from the John R. Oishei Foundation.
Supporting Material
References
- 1.Raska I. Oldies but goldies: searching for Christmas trees within the nucleolar architecture. Trends Cell Biol. 2003;13:517–525. doi: 10.1016/j.tcb.2003.08.003. [DOI] [PubMed] [Google Scholar]
- 2.Lamond A.I., Spector D.L. Nuclear speckles: a model for nuclear organelles. Nat. Rev. Mol. Cell Biol. 2003;4:605–612. doi: 10.1038/nrm1172. [DOI] [PubMed] [Google Scholar]
- 3.Grewal S.I., Jia S. Heterochromatin revisited. Nat. Rev. Genet. 2007;8:35–46. doi: 10.1038/nrg2008. [DOI] [PubMed] [Google Scholar]
- 4.Spector D.L. SnapShot: cellular bodies. Cell. 2006;127:1071. doi: 10.1016/j.cell.2006.11.026. [DOI] [PubMed] [Google Scholar]
- 5.Jackson D.A., Hassan A.B., Cook P.R. Visualization of focal sites of transcription within human nuclei. EMBO J. 1993;12:1059–1065. doi: 10.1002/j.1460-2075.1993.tb05747.x. [DOI] [PMC free article] [PubMed] [Google Scholar]
- 6.Nakayasu H., Berezney R. Mapping replicational sites in the eukaryotic cell nucleus. J. Cell Biol. 1989;108:1–11. doi: 10.1083/jcb.108.1.1. [DOI] [PMC free article] [PubMed] [Google Scholar]
- 7.Zaidi S.K., Young D.W., Stein G.S. Nuclear microenvironments in biological control and cancer. Nat. Rev. Cancer. 2007;7:454–463. doi: 10.1038/nrc2149. [DOI] [PubMed] [Google Scholar]
- 8.Bazett-Jones D.P., Li R., Dehghani H. Elucidating chromatin and nuclear domain architecture with electron spectroscopic imaging. Chromosome Res. 2008;16:397–412. doi: 10.1007/s10577-008-1237-3. [DOI] [PubMed] [Google Scholar]
- 9.Prasad P.N. Wiley-Interscience; Hoboken, NJ: 2003. Introduction to Biophotonics. [Google Scholar]
- 10.Berger A.J., Wang Y., Feld M.S. Rapid, noninvasive concentration measurements of aqueous biological analytes by near-infrared Raman spectroscopy. Appl. Opt. 1996;35:209–212. doi: 10.1364/AO.35.000209. [DOI] [PubMed] [Google Scholar]
- 11.Rinia H.A., Burger K.N., Müller M. Quantitative label-free imaging of lipid composition and packing of individual cellular lipid droplets using multiplex CARS microscopy. Biophys. J. 2008;95:4908–4914. doi: 10.1529/biophysj.108.137737. [DOI] [PMC free article] [PubMed] [Google Scholar]
- 12.Notingher L., Jell G., Hench L.L. Multivariate analysis of Raman spectra for in vitro non-invasive studies of living cells. J. Mol. Struct. 2005;744:179–185. [Google Scholar]
- 13.Buschman H.P., Deinum G., Feld M.S. Raman microspectroscopy of human coronary atherosclerosis: biochemical assessment of cellular and extracellular morphologic structures in situ. Cardiovasc. Pathol. 2001;10:69–82. doi: 10.1016/s1054-8807(01)00064-3. [DOI] [PubMed] [Google Scholar]
- 14.Matthäus C., Chernenko T., Diem M. Label-free detection of mitochondrial distribution in cells by nonresonant Raman microspectroscopy. Biophys. J. 2007;93:668–673. doi: 10.1529/biophysj.106.102061. [DOI] [PMC free article] [PubMed] [Google Scholar]
- 15.Cheng J.X., Jia Y.K., Xie X.S. Laser-scanning coherent anti-Stokes Raman scattering microscopy and applications to cell biology. Biophys. J. 2002;83:502–509. doi: 10.1016/S0006-3495(02)75186-2. [DOI] [PMC free article] [PubMed] [Google Scholar]
- 16.Matthäus C., Boydston-White S., Diem M. Raman and infrared microspectral imaging of mitotic cells. Appl. Spectrosc. 2006;60:1–8. doi: 10.1366/000370206775382758. [DOI] [PMC free article] [PubMed] [Google Scholar]
- 17.Maker P.D., Terhune R.W. Study of optical effects due to an induced polarization third order in electric field strength. Phys. Rev. 1965;137:A801. [Google Scholar]
- 18.Evans C.L., Potma E.O., Xie X.S. Chemical imaging of tissue in vivo with video-rate coherent anti-Stokes Raman scattering microscopy. Proc. Natl. Acad. Sci. USA. 2005;102:16807–16812. doi: 10.1073/pnas.0508282102. [DOI] [PMC free article] [PubMed] [Google Scholar]
- 19.Kornfield H.J., Werder A.A. A differential nucleic acid fluorescent stain applied to cell culture systems. Cancer. 1960;13:458–461. doi: 10.1002/1097-0142(196005/06)13:3<458::aid-cncr2820130307>3.0.co;2-u. [DOI] [PubMed] [Google Scholar]
- 20.Uzunbajakava N., Lenferink A., Otto C. Nonresonant confocal Raman imaging of DNA and protein distribution in apoptotic cells. Biophys. J. 2003;84:3968–3981. doi: 10.1016/S0006-3495(03)75124-8. [DOI] [PMC free article] [PubMed] [Google Scholar]
- 21.Rousseau D.L. Raman difference spectroscopy as a probe of biological molecules. Journal of Raman Spectroscopy. 1981;10:94–99. [Google Scholar]
- 22.Shafer-Peltier K.E., Haka A.S., Feld M.S. Raman microspectroscopic model of human breast tissue: implications for breast cancer diagnosis in vivo. J. Raman Spectrosc. 2002;33:552–563. [Google Scholar]
- 23.Haka A.S., Shafer-Peltier K.E., Feld M.S. Diagnosing breast cancer by using Raman spectroscopy. Proc. Natl. Acad. Sci. USA. 2005;102:12371–12376. doi: 10.1073/pnas.0501390102. [DOI] [PMC free article] [PubMed] [Google Scholar]
- 24.Short K.W., Carpenter S., Mourant J.R. Raman spectroscopy detects biochemical changes due to proliferation in mammalian cell cultures. Biophys. J. 2005;88:4274–4288. doi: 10.1529/biophysj.103.038604. [DOI] [PMC free article] [PubMed] [Google Scholar]
- 25.Alberts B., Johnson A., Walter P. Molecular Biology of the Cell. Garland Science; New York: 2002. The chemical components of a cell. [Google Scholar]
- 26.Hobro A.J., Rouhi M., Conn G.L. Raman and Raman optical activity (ROA) analysis of RNA structural motifs in Domain I of the EMCV IRES. Nucleic Acids Res. 2007;35:1169–1177. doi: 10.1093/nar/gkm012. [DOI] [PMC free article] [PubMed] [Google Scholar]
- 27.Deng H., Bloomfield V.A., Thomas G.J., Jr. Dependence of the Raman signature of genomic B-DNA on nucleotide base sequence. Biopolymers. 1999;50:656–666. doi: 10.1002/(SICI)1097-0282(199911)50:6<656::AID-BIP10>3.0.CO;2-9. [DOI] [PubMed] [Google Scholar]
- 28.Spiro T.G., Gaber B.P. Laser Raman scattering as a probe of protein structure. Annu. Rev. Biochem. 1977;46:553–572. doi: 10.1146/annurev.bi.46.070177.003005. [DOI] [PubMed] [Google Scholar]
- 29.Hanlon E.B., Manoharan R., Feld M.S. Prospects for in vivo Raman spectroscopy. Phys. Med. Biol. 2000;45:R1–R59. doi: 10.1088/0031-9155/45/2/201. [DOI] [PubMed] [Google Scholar]
- 30.Pederson T. Fluorescent RNA cytochemistry: tracking gene transcripts in living cells. Nucleic Acids Res. 2001;29:1013–1016. doi: 10.1093/nar/29.5.1013. [DOI] [PMC free article] [PubMed] [Google Scholar]
- 31.Thiry M. Differential location of nucleic acids within interchromatin granule clusters. Eur. J. Cell Biol. 1993;62:259–269. [PubMed] [Google Scholar]
- 32.Hendzel M.J., Kruhlak M.J., Bazett-Jones D.P. Organization of highly acetylated chromatin around sites of heterogeneous nuclear RNA accumulation. Mol. Biol. Cell. 1998;9:2491–2507. doi: 10.1091/mbc.9.9.2491. [DOI] [PMC free article] [PubMed] [Google Scholar]
- 33.Martin R.M., Leonhardt H., Cardoso M.C. DNA labeling in living cells. Cytometry A. 2005;67:45–52. doi: 10.1002/cyto.a.20172. [DOI] [PubMed] [Google Scholar]
- 34.Albi E., Viola Magni M.P. The role of intranuclear lipids. Biol. Cell. 2004;96:657–667. doi: 10.1016/j.biolcel.2004.05.004. [DOI] [PubMed] [Google Scholar]
- 35.Zaina S., Døssing K.B., Lund G. Chromatin modification by lipids and lipoprotein components: an initiating event in atherogenesis? Curr. Opin. Lipidol. 2005;16:549–553. doi: 10.1097/01.mol.0000180165.70077.ee. [DOI] [PubMed] [Google Scholar]
- 36.Fricker M., Hollinshead M., Vaux D. Interphase nuclei of many mammalian cell types contain deep, dynamic, tubular membrane-bound invaginations of the nuclear envelope. J. Cell Biol. 1997;136:531–544. doi: 10.1083/jcb.136.3.531. [DOI] [PMC free article] [PubMed] [Google Scholar]
- 37.Umen J.G. The elusive sizer. Curr. Opin. Cell Biol. 2005;17:435–441. doi: 10.1016/j.ceb.2005.06.001. [DOI] [PubMed] [Google Scholar]
- 38.Hirota T., Gerlich D., Peters J.M. Distinct functions of condensin I and II in mitotic chromosome assembly. J. Cell Sci. 2004;117:6435–6445. doi: 10.1242/jcs.01604. [DOI] [PubMed] [Google Scholar]
- 39.Walter J., Schermelleh L., Cremer T. Chromosome order in HeLa cells changes during mitosis and early G1, but is stably maintained during subsequent interphase stages. J. Cell Biol. 2003;160:685–697. doi: 10.1083/jcb.200211103. [DOI] [PMC free article] [PubMed] [Google Scholar]
- 40.Boydston-White S., Romeo M., Diem M. Cell-cycle-dependent variations in FTIR micro-spectra of single proliferating HeLa cells: principal component and artificial neural network analysis. Biochim. Biophys. Acta. 2006;1758:908–914. doi: 10.1016/j.bbamem.2006.04.018. [DOI] [PMC free article] [PubMed] [Google Scholar]
- 41.Bohrmann B., Haider M., Kellenberger E. Concentration evaluation of chromatin in unstained resin-embedded sections by means of low-dose ratio-contrast imaging in STEM. Ultramicroscopy. 1993;49:235–251. doi: 10.1016/0304-3991(93)90230-u. [DOI] [PubMed] [Google Scholar]
- 42.Misteli T. Beyond the sequence: cellular organization of genome function. Cell. 2007;128:787–800. doi: 10.1016/j.cell.2007.01.028. [DOI] [PubMed] [Google Scholar]
- 43.Becker M., Baumann C., Hager G.L. Dynamic behavior of transcription factors on a natural promoter in living cells. EMBO Rep. 2002;3:1188–1194. doi: 10.1093/embo-reports/kvf244. [DOI] [PMC free article] [PubMed] [Google Scholar]
- 44.Phair R.D., Misteli T. High mobility of proteins in the mammalian cell nucleus. Nature. 2000;404:604–609. doi: 10.1038/35007077. [DOI] [PubMed] [Google Scholar]
- 45.Phair R.D., Scaffidi P., Misteli T. Global nature of dynamic protein-chromatin interactions in vivo: three-dimensional genome scanning and dynamic interaction networks of chromatin proteins. Mol. Cell. Biol. 2004;24:6393–6402. doi: 10.1128/MCB.24.14.6393-6402.2004. [DOI] [PMC free article] [PubMed] [Google Scholar]
- 46.Cheutin T., McNairn A.J., Misteli T. Maintenance of stable heterochromatin domains by dynamic HP1 binding. Science. 2003;299:721–725. doi: 10.1126/science.1078572. [DOI] [PubMed] [Google Scholar]
- 47.Politz J.C., Browne E.S., Pederson T. Intranuclear diffusion and hybridization state of oligonucleotides measured by fluorescence correlation spectroscopy in living cells. Proc. Natl. Acad. Sci. USA. 1998;95:6043–6048. doi: 10.1073/pnas.95.11.6043. [DOI] [PMC free article] [PubMed] [Google Scholar]
- 48.Belmont A.S. Mitotic chromosome structure and condensation. Curr. Opin. Cell Biol. 2006;18:632–638. doi: 10.1016/j.ceb.2006.09.007. [DOI] [PubMed] [Google Scholar]
- 49.Lawrence J.B., Singer R.H., McNeil J.A. Interphase and metaphase resolution of different distances within the human dystrophin gene. Science. 1990;249:928–932. doi: 10.1126/science.2203143. [DOI] [PubMed] [Google Scholar]
Associated Data
This section collects any data citations, data availability statements, or supplementary materials included in this article.