

Abstract
Determination of glomerular filtration rate (GFR) is a valuable, yet underused, diagnostic tool for evaluating renal function in dogs and cats. This article first reviews the hormonal and hemodynamic factors which contribute to GFR, followed by a description of considerations when selecting a pharmacokinetic model and methods of animal-to-animal standardization. The best-characterized existing GFR markers, including creatinine, radiolabeled markers, and iohexol, are reviewed in depth, as well as alternative but lesser-used techniques. A weighted means analysis of reported GFR measurements in healthy dogs and cats and a review of selected studies that have examined GFR alterations in animals with naturally-occurring and experimental diseases provide the reader with preliminary guidelines on expected GFR results in these species and disease conditions.
Keywords: Creatinine, Glomerular filtration rate, Iohexol, Kidney function, Radiolabeled marker
Introduction
Glomerular filtration rate (GFR) is a measurement of kidney filtration and excretion that can detect decreases in organ function far earlier than more widely-used markers of renal function. Despite its superiority for detecting early renal dysfunction, measurement of GFR remains an underused tool in the diagnosis and management of kidney disease in veterinary medicine. Serum creatinine concentration has replaced GFR measurement in most clinical settings because of its ease and widespread availability; however, because serum creatinine likely does not increase above reference range until approximately 75% of nephrons are nonfunctional, and falsely increased creatinine concentrations may occur with some assays, the sensitivity and specificity of creatinine for diagnosis of kidney disease should be considered inferior to actual determination of GFR.
There are several situations where determination of GFR may be theoretically useful in clinical patients. For example, in patients with serum creatinine concentrations that are within the upper limits of the laboratory’s reference range or only mildly increased, GFR measurement allows practitioners to more confidently determine whether or not kidney disease is present. In polyuric, non-azotemic patients, GFR measurement is required to diagnose or exclude renal insufficiency as the primary cause of defective urine concentrating ability. GFR measurement may also be useful as an adjunctive tool for early screening of some dog breeds at known risk for hereditary nephropathies; while normal GFR cannot predict later development of kidney dysfunction, or if below normal, does not provide information as to the cause, results may assist in making breeding recommendations and for identifying dogs that may require more frequent monitoring or are at risk of renal failure. Finally, accurate measurement of GFR may, in theory, be used for drug dose adjustments in patients with renal disease in order to avoid overdosing of medications that are renally excreted, or alternatively to allow earlier detection of nephrotoxicity.
Although several techniques have been validated in both research and clinical settings, there is still a need in veterinary medicine for a widely-available method to determine GFR that is easy to perform by general practitioners. Currently available methods may be difficult, expensive, or require multiple blood draws or 24-h urine collection. Also, establishment of a single GFR reference range for use in all dogs and cats may be inappropriate because filtration rate is possibly influenced by several extra-renal factors, including sex, age, breed, dietary protein intake, hydration status, sodium balance, and day-to-day circadian rhythm. The purpose of this article is to provide an overview of glomerular hemodynamics and factors that determine glomerular filtration, describe the general principles of GFR measurement, including frequently employed markers and the calculations used to determine rate of excretion, and discuss several factors that must be considered when measuring GFR. The most commonly used (and best established) techniques for measuring GFR in dogs and cats will be reviewed, including final comments on the future of GFR measurement.
Glomerular hemodynamics
The primary function of the nephron is filtration of plasma as it flows through the glomerulus, followed by renal tubular secretion and reabsorption of electrolytes, bicarbonate, buffering molecules, macromolecules, and water. Global GFR is the total filtration rate of both kidneys, and thus is the sum of the total single-nephron filtration rates; for a more thorough discussion of glomerular physiology and the intrinsic mechanisms which influence GFR, the reader is referred to previously published review articles and textbooks (Rose and Post, 2001; DiBartola 2005; Komlosi et al., 2009; Loutzenhiser et al., 2006; Holecheck, 2003).
Several key factors contribute to the determination of GFR and thus, the formation of the ultrafiltrate. Most importantly, formation and composition of the ultrafiltrate depends on the oncotic and hydrostatic pressures of plasma and of the ultrafiltrate already present in Bowman’s space. In addition, the surface area available for filtration and the inherent permeability of the individual capillary bed affect the rate of fluid formation, and are represented by an ‘ultrafiltration constant.’ These factors are incorporated into the modified Starling equation:
where Pgc is the hydrostatic pressure within the glomerular capillary, Pb is the hydrostatic pressure of the ultrafiltrate in Bowman’s space, πgc is the oncotic pressure within the glomerular capillary, πb is the oncotic pressure in Bowman’s space, and Kf is the ultrafiltration constant. Because charge and size selectivity of the various layers of the glomerulus prevent passage of virtually any protein into the ultrafiltrate under normal conditions, πb should be zero in animals with normal kidneys (Starling, 1899).
As blood flows from the afferent arteriole through the glomerular capillaries and into the efferent arteriole, the intra-capillary hydrostatic pressure remains relatively constant; however, the oncotic pressure within the glomerular capillaries steadily increases as protein-free fluid is filtered into Bowman’s space, and intra-capillary plasma protein concentration increases. Under normal conditions in primates the gradient favoring filtration eventually falls to zero after filtration of approximately 20% of total renal plasma flow (RPF) (Maddox et al., 1974); this is not constant in all mammalian species, however, as in cats, hydrostatic pressure exceeds oncotic pressure throughout the glomerular capillary bed (Brown, 1993).
In order to maintain excretion of waste products, conservation of water and electrolytes, and acid-base balance, GFR must remain relatively constant under a variety of conditions. This is primarily achieved via adjustments to glomerular arteriolar resistance, which minimizes changes to GFR via alterations in Pgc. For example, constriction of the afferent arteriole decreases Pgc via reduced RPF. In contrast, constriction of the efferent arteriole without an associated constriction of the afferent arteriole increases Pgc by preventing blood outflow, and thus GFR increases. Constriction at either end of the glomerular capillary bed will also affect renal plasma flow because resistance across the arterioles contributes to 85% of total renal vascular resistance (Renkin and Robinson, 1974). At the level of the afferent arteriole, GFR and RPF are regulated in parallel, while at the efferent arteriole, they have an inverse relationship. That is, if the afferent arteriole is constricted, both GFR and RPF are decreased and thus the filtration fraction (i.e. GFR/RPF) remains the same. If the efferent arteriole is constricted, GFR will increase, but RPF will decrease, causing an increase in the filtration fraction.
Several interrelated mechanisms regulate arteriolar resistance, of which the best described are renal intrinsic autoregulation, tubuloglomerular feedback, and several neurohumoral influences, particularly angiotensin II. Autoregulation refers to the nephron’s inherent compensatory properties that ensure GFR and RPF remain relatively constant over a wide range of normal systolic arteriolar pressures. As systolic blood pressure increases, the afferent arteriole appropriately constricts to maintain Pgc and GFR; conversely, as systolic blood pressure decreases, the afferent arteriole dilates (Navar, 1978). However, this autoregulation is only effective to a minimum systolic blood pressure of 70 mmHg (Navar, 1978). Below this, assuming no other mechanisms are functional, GFR decreases in proportion to the severity of hypotension until 40–50 mmHg, at which point GFR is zero (Navar, 1978).
GFR also changes in response to the flow rate of ultrafiltrate through the tubules via tubuloglomerular feedback; it appears that the major function of this mechanism is to prevent excessive sodium, chloride, and water loss (Moore, 1982). The macula densa, a region of specialized cells of the distal convoluted tubule which are part of the juxtaglomerular apparatus, senses changes in ultrafiltrate chloride concentration. Any increase in intraglomerular perfusion pressure leads to an increase in GFR and subsequent increased delivery of chloride to the macula densa (Lapointe et al., 1990). Through unknown mediators this induces afferent arteriolar constriction which returns GFR, and thus delivery of chloride to the macula densa, to normal.
The most common cause of decreased GFR is reduced renal artery pressure secondary to hypotension or effective circulating volume depletion (Dzau, 1987); this activates neurohumoral mechanisms, particularly the sympathetic nervous system. This results in norepinephrine release, which both directly increases afferent arteriolar tone and indirectly increases efferent arteriolar tone via release of renin from the juxtaglomerular cells and downstream activation of angiotensin II (Myers et al., 1975). Angiotensin II increases sodium reabsorption in the proximal tubule, and thus directly increases intravascular volume as well as inducing aldosterone secretion from the adrenal cortex, which further enhances sodium transport and water reabsorption in the cortical collecting ducts. In addition, angiotensin II is a systemic vasoconstrictor and secondarily enhances norepinephrine release, which as discussed further increases systemic blood pressure (Ischikawa and Harris, 1991). Once systemic volume expansion occurs, renal perfusion and GFR increase. This results in a decrease in norepinephrine and angiotensin II release and an increase in dopamine and atrial natriuretic peptide (ANP) secretion. Dopamine dilates the afferent and efferent arterioles, thus decreasing angiotensin II-induced renal vascular constriction and improving renal perfusion; ANP induces afferent arteriolar dilation and efferent constriction, which increases Pgc and GFR without altering RPF because renal vascular resistance remains constant.
Determination of glomerular filtration rate
Plasma clearance refers to the amount of an injected substance (the ‘marker’) removed from the plasma over a given interval of time, expressed as the volume of plasma theoretically rendered ‘clear’ of the substance (i.e. mL/min). If a marker is eliminated solely by the kidneys via glomerular filtration and then is neither reabsorbed nor secreted by the tubules, renal clearance is equal to plasma clearance, and is an accurate estimate of GFR.
Determination of renal clearance requires that the amount of marker excreted in the urine and the amount of marker in the plasma are both assayed. All urine must be collected over the course of the study; if urine collection is incomplete, the amount of marker in the urine and GFR will be underestimated. Because 24-h urine collection is often impractical, plasma clearance is frequently substituted for renal clearance both clinically and in the research setting. Plasma clearance does not measure the amount of marker excreted in the urine, but instead calculates GFR by determining the reduction in plasma concentration of a marker over time. The formula for plasma clearance (CLplasma) is:
where D is the dose of the marker and AUC is the area under the plasma concentration-versus-time curve. The plasma concentration-versus-time curve (also referred to as the plasma disappearance curve) is determined by obtaining multiple plasma samples at set time intervals for a predetermined length of time. The number of plasma samples obtained as well as the time points after injection of marker at which they are obtained depends on the pharmacokinetic model.
Pharmacokinetic models for GFR calculation
Pharmacokinetic models consider the body as a series of compartments through which a marker distributes. The type and number of compartments used in model construction affects the resultant total area under the plasma concentration-versus-time curve. In veterinary studies using plasma clearance to determine GFR, one-compartment, two-compartment, multi-compartmental, and non-compartmental models have all been considered (Fig. 1).
Fig. 1.
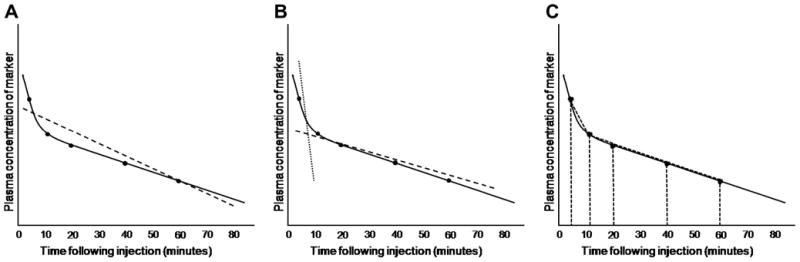
Calculation of GFR is affected by the pharmacokinetic model chosen. In all three graphs, true elimination pharmacokinetics of a hypothetical marker are indicated by the solid black line; measured concentrations of the marker in serum or plasma at various time points are indicated by black dots overlying the black line. A. In a one-compartment model, all time points are used to calculate a single ‘best fit’ line, the slope of which is used to calculate GFR (dashed line). B. In a two-compartment model, initial redistribution of the marker is determined from early time points (dotted line), whereas later time points are used to calculate GFR (dashed line) as for the one-compartment model. C. In non-compartmental models, time points are used to construct trapezoids for estimating the area-under-the-curve.
The one-compartment model views the body as a single compartment, and immediate distribution of the marker throughout the body is assumed to occur. This model produces a straight line (i.e. a linear slope) plasma disappearance curve. The benefit of this model is that limited sampling is required to produce a curve, as the slope of the line between any two time points is assumed to be constant throughout elimination of the compound. However, the recognized error of this model is that immediate distribution of a marker throughout the body does not occur in truth (Sapirstein et al., 1955).
The two-compartment model assumes that reduction in plasma concentration of a marker is due to initial movement from the vasculature into the body tissues, followed later by elimination from the body. Thus, the resultant plasma concentration-versus-time curve can be resolved into two straight lines: an initial, decreasing, steep portion which reflects rapid redistribution of marker, and a second, less steep portion which represents elimination. Although two-compartment models are likely more accurate because they recognize the influence of tissue distribution on clearance, if the extracellular fluid volume is abnormal then resolution of the curve into two lines may not be possible because of slowed redistribution (Hall et al., 1977). Multi-compartmental models are similar to two-compartment models, except that for each number of compartments conceptualized, the curve is resolved into an equal number of straight lines.
Non-compartmental models calculate the area under the plasma concentration-versus-time curve by adding the area of each trapezoid defined by the curve. This model is useful because the number of compartments do not need to be defined. However, because the terminal portion of the curve (from the last sample to the time of theoretical zero plasma concentration) is estimated, errors may occur. In addition, inappropriately early termination of plasma sampling means that a large portion of the curve must be estimated and this may also increase error in GFR calculation (Purves, 1994).
Regardless of the inherent disadvantages of the various models, use of plasma rather than renal clearance has allowed for more simple and rapid techniques for GFR measurement. The plasma clearance methods avoid urine collection, although precisely timed blood collections can be difficult when required for single-compartment models, and multiple samples may be inappropriate in small or anemic patients or difficult in fractious animals. To make GFR measurement more clinically feasible, several studies have focused on limited sampling techniques for determining plasma clearance and comparing their validity with other methods. The number of samples that balances these potential clinical limitations with the requirements of various pharmacokinetic models for plasma clearance methods also depends on the GFR marker used (see below) and has yet to be established.
Standardization and variation in GFR
The most commonly used GFR standardization method is to body weight in kg. This assumes that renal clearance is associated with body weight in a linear fashion; however, this may not be the case in very small (<10 kg) or very large (>50 kg) dogs due to metabolic scaling (Goy-Thollot et al., 2006b; Bexfield et al., 2008). In people, body surface area is used for standardization rather than body weight. Some veterinary studies have applied this method (Moe and Heiene, 1995; Goy-Thollot et al., 2006a; Goy-Thollot et al., 2006b); however, the most appropriate formula for estimating body surface area in veterinary species is unknown. Extracellular fluid volume (ECFV) has also been used as a method of standardization, (Bexfield et al., 2008; Heiene et al., 2009) because ECFV regulation is closely related to GFR; however, results have been variable and this method needs to be evaluated more before its use can be recommended. While dogs have variable results depending on the method of standardization utilized, most studies in cats produce acceptable results for normalization using body weight, ECFV, or body surface area, likely due to their smaller range of body sizes (Goy-Thollot et al., 2006b; van Hoek et al., 2007). However, at least one study (Bexfield et al., 2008) did find some variation in cats based on body weight, perhaps due to larger sample size and more diversity in breeds. In short, the ideal standardization method is unknown at this time.
In addition to body size, GFR may be influenced by age, gender or breed. While some studies have demonstrated an influence of age on GFR (Queau et al., 2007; van Hoek et al., 2007), others have found that age does not affect GFR in either dogs (Bexfield et al., 2008) or cats (Heiene et al., 2009). In addition, no interaction has been found between age and body weight, with the exception of dogs with very low body weights, where GFR was found to increase with age (Bexfield et al., 2008). This is in discordance with humans, where increasing age consistently leads to a decrease in GFR (Hoang et al., 2003). The shorter life-span of dogs relative to humans may explain this discrepancy, particularly if age-related GFR decreases are due to absolute time span rather than relative age (Bexfield et al., 2008). Gender may have an influence on GFR because creatinine is actively secreted in small amounts by the renal tubules in male dogs; therefore, creatinine clearance techniques in male dogs may overestimate GFR (Robinson et al., 1974). Although the effect of breed on GFR has not been extensively evaluated in either dogs (Lefebvre et al., 2006) or cats, breed is associated with plasma creatinine concentration in dogs, and thus may have an influence on GFR (Reynolds et al., 2008).
Markers and techniques for GFR determination
Appropriate markers for GFR measurement are freely filtered through the glomerulus, not bound to plasma proteins (which would delay filtration and lead to a falsely decreased estimate of GFR), and are neither reabsorbed nor secreted by renal tubules (Fig. 2). Markers should not be toxic and cannot themselves alter GFR. Inulin is a fructose polymer that comes very close to satisfying all these criteria, and thus, renal clearance of inulin is the gold standard for measuring GFR (Haller et al., 1998; KuKanich et al., 2007). However, several limitations have minimized the use of renal clearance of inulin to research settings. The assays available for measurement for inulin are technically challenging and not widely available. In addition, accurate, complete, 24-h urine collection is required for inulin-based renal clearance techniques; animals must therefore be placed in a metabolic cage or must be catheterized at regular intervals to remove all urine (Moe and Heiene, 1995; KuKanich et al., 2007).
Fig. 2.
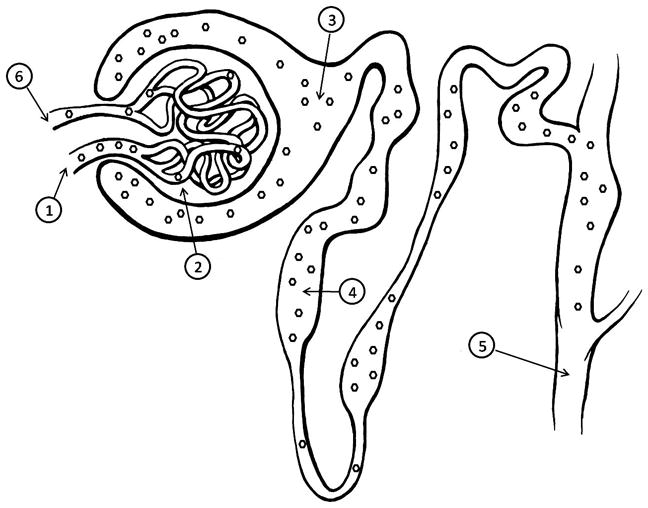
A nephron demonstrating the characteristics of an ideal GFR marker. A marker (hexagons) used for measurement of GFR should freely enter the glomerulus via the afferent arteriole (1), and be filtered across the glomerular capillary endothelium, basement membrane, and podocytes (2) into Bowman’s space (3). The marker should then pass through the tubules without reabsorption or secretion (4), and pass into the urine (5). Not all marker molecules which enter the glomerulus will be filtered into the urine during each pass through the capillary bed, and instead will exit via the efferent arteriole (6) and be filtered during subsequent passes through the kidney. GFR by plasma clearance is determined by rate of disappearance of marker from the blood (6), whereas GFR by renal clearance is determined by rate of appearance of marker in the urine (5).
Creatinine
Creatinine is freely filtered by the glomerulus and is not protein-bound. It is produced at a constant rate from breakdown of creatine phosphate in muscle tissues and is only minimally influenced by protein intake, metabolism or physical activity (Bovee and Joyce, 1979). Although creatinine is not reabsorbed by the renal tubules, it is secreted to a small degree in male dogs, which may lead to an overestimation of GFR (Robinson et al., 1974). In addition, plasma and serum contain other molecules which are inappropriately measured as creatinine when assayed by the Jaffe method; the influence of these non-creatinine chromagens on GFR is highest when they make up a large portion of the assay ‘positive’ results (i.e. when creatinine is within the reference range) and result in an underestimation of true GFR.
Endogenous creatinine clearance evaluates GFR by measuring natural creatinine concentrations in blood and urine. Because GFR assays are most commonly performed in patients with serum creatinine concentrations within the reference range, endogenous creatinine clearance GFR results may be falsely decreased due to persistence (i.e. lack of renal elimination) of serum non-creatinine chromagens if creatinine is measured by the Jaffe reaction; this does not occur with enzymatic creatinine assays. While initial endogenous creatinine urinary clearance results were higher than inulin urinary clearance results (Bovee and Joyce, 1979), GFR measurements obtained via urinary clearance of endogenous creatinine were very similar (Finco et al., 1993), slightly higher (Krawiec et al., 1986), or slightly lower (Finco et al., 1981) when assayed by newer enzymatic techniques than those obtained using renal clearance of inulin. Although the accuracy of the endogenous creatinine clearance technique has not been completely established, this technique is rarely performed anymore since newer methods for evaluating GFR have been developed.
In order to minimize the inherent problems with the endogenous creatinine clearance technique, the exogenous creatinine clearance method was developed. For this technique, an IV bolus, constant rate infusion, or SC injection of creatinine is administered to increase the plasma creatinine concentration to the point that non-creatinine chromagens are insignificant. Clearance can then be evaluated via renal or plasma clearance techniques, as both have shown good agreement with renal clearance of inulin (Finco et al., 1981; Finco et al., 1991; Watson et al., 2002).
Disadvantages of measuring GFR via renal clearance of exogenous creatinine are the need for a continuous infusion of creatinine, the need for complete urine collection, and the possibility that exogenous creatinine clearance is overestimated in male dogs due to the low tubular secretion of creatinine. However, exogenous creatinine renal clearance results were not influenced by gender, time after onset of renal disease, or dietary protein intake in one study (Finco et al., 1991). Also, validation of a single injection method of creatinine (versus a constant rate infusion) demonstrated that urinary clearance of exogenous creatinine correlated well to that of inulin (Finco et al., 1981).
Although GFR obtained by plasma clearance of exogenous creatinine administered by constant rate infusion was higher than that obtained with renal clearance in dogs in one study (Labato and Ross, 1991), comparison of plasma clearance with renal clearance of inulin has demonstrated that plasma clearance of exogenous creatinine either underestimates GFR or leads to similar results (Watson et al., 2002; Finco, 2005). In cats, constant rate infusion-administered exogenous creatinine clearance may underestimate GFR by as much as 18.8%, (Ross and Finco, 1981; Uribe et al., 1992) and therefore may not be useful in this species. However, because patients underwent general anesthesia during the exogenous creatinine clearance studies and sample sizes were relatively small, this poor correlation may be due to experimental design flaws rather than true poor performance of the assay (Rogers et al., 1991). In more recent studies, single IV bolus injections of creatinine have allowed calculation of GFR in both dogs and cats (Watson et al., 2002; Le Garreres et al., 2007; Cortadellas et al., 2008; van Hoek et al., 2007; van Hoek et al., 2008; van Hoek et al., 2009a).
Like the constant rate infusion technique, bolus administration of creatinine at a variety of doses underestimates GFR in dogs as compared to plasma inulin (Watson et al., 2002), but the single injection method greatly simplifies the monitoring and equipment for GFR measurement. Plasma clearance of exogenous creatinine in cats has not been directly compared to inulin clearance, but correlation with results obtained via iohexol clearance may be influenced by the stereoisomer of iohexol being measured and by whether GFR is within the range expected in healthy animals or increased or decreased by concurrent disease (Le Garreres et al., 2007; van Hoek et al., 2007; van Hoek et al., 2008; van Hoek et al., 2009a). Differences in the reported accuracy of exogenous creatinine clearance studies may also be due to the pharmacokinetic models chosen, as the pharmacokinetic model used in one study (Finco, 2005) necessitated that a large percentage of the AUC be determined by extrapolation, which may have led to underestimation of GFR. Alternatively, extrarenal clearance of creatinine may theoretically falsely increase GFR results; however extrarenal elimination of creatinine in one study was insignificant (i.e. < 1%) (Labato and Ross, 1991; Watson et al., 2002).
Despite these inconsistent results, plasma clearance of exogenous creatinine has been accepted as an accurate, simple, method for determining GFR. However, special attention must be paid to the pharmacokinetic model used, as this may be responsible for the reported variations and affect the timing of blood sampling. Sampling should extend over 10 h in dogs with a GFR that is decreased < 60%, with three to five samples drawn in total (Watson et al., 2002).
Radiolabeled markers
Radiolabeled markers can be used to determine renal or plasma clearance. Older markers include [125I] sodium iothalamate and [131I] sodium iodohippurate, but these have been replaced by newer agents such as 51Cr-ethylenediaminetetraacetic acid (EDTA) and 99mTc-diethylenetriaminepentaacetic acid (DTPA). These markers are freely filtered by the glomerulus and are not reabsorbed or secreted by the renal tubules, thus fulfilling criteria of ideal GFR markers (Krawiec et al., 1988). In addition, although radiolabeled markers are very stable in blood and thus can be easily stored or shipped to outside laboratories, the in vivo half-life of 99mTc-DTPA is only 6 h, so patients are usually cleared of radioactivity within 24–48 h. In comparison, the half-life of [125I] sodium iothalamate is approximately 60 days (Matthews, 1960) and for [131I] sodium iodohippurate is approximately eight days (Amdur and Mazzaferri, 2005).
An additional benefit of using these radionuclides is that renal scintigraphy can be performed using a gamma camera to estimate either individual kidney or global GFR by measuring the percentage dose uptake of marker by each kidney (Uribe et al., 1992; Barthez et al., 1998; Kampa et al., 2006). The primary limitations associated with these markers are the availability of laboratories that can assay radioactivity and having the appropriate facilities to conduct nuclear medicine-based tests. In addition, when measuring GFR via gamma camera-estimated radionuclide uptake, there is possible introduction of error based on operator inexperience with defining the area of interest, as well as the need to adjust for kidney depth (Kampa et al., 2006). Unfortunately, unlike plasma clearance methods of GFR determination where later time points (i.e. up to several hours post-injection) are used to determine rate of marker clearance or AUC, gamma camera measurements require almost immediate post-injection image acquisition; therefore, some investigators have suggested that unanticipated early excretion of 99mTc-DTPA (before the 1–3 min post-injection measurement window) may be the cause of higher intra-dog variability with this technique or of sporadic GFR underestimation (Kampa et al., 2006).
Dogs with suspected naturally-occurring or amphotericin-B-induced renal disease have nuclear scintigraphic-determined GFR results comparable to those obtained with renal clearance of endogenous creatinine, with the former group also having good correlation with inulin clearance (Krawiec et al., 1986; Krawiec et al., 1988); however, 99mTc-DTPA plasma clearance may be more accurate than renal scintigraphy in dogs with renal dysfunction (Barthez et al., 1998). Unfortunately, initial 99mTc-DTPA plasma clearance studies used a limited number of blood samples obtained over a 4-h time period, which decreases the accuracy of this method (Barthez et al., 1998; Barthez et al., 2000). Nevertheless, comparison of one- and two-sample methods to a 12-sample, two-compartment model has demonstrated that plasma clearance of 99mTc-pentetate can be estimated with one or two blood samples with a reasonable margin of error in both dogs and cats (Barthez et al., 2001).
Use of plasma clearance or renal scintigraphic uptake of 99mTc-DTPA to measure GFR in cats has yielded GFR values similar to those obtained by plasma clearance of exogenous creatinine clearance and plasma clearance of inulin (Rogers et al., 1991; Uribe et al., 1992). However, some GFR values reported are lower than those determined in other studies (Osbaldiston and Fuhrman, 1970; Ross and Finco, 1981; Fettman et al., 1985; Russo et al., 1986) even though chemical restraint was not used. This discrepancy may have been due to stress, age, or other unknown factors (Uribe et al., 1992). Alternatively, measurement of GFR in cats via plasma clearance of 51Cr-EDTA has been optimized for collection of a single post-injection sample (Vandermeulen et al., 2008). Although the sensitivity of 51Cr-EDTA was sufficient to identify differences between animals with presumptively normal and increased GFR (Vandermeulen et al., 2008), further validation is still required, as an earlier study suggested that reproducibility of GFR results using 51Cr-EDTA in a small number of cats was much lower than that demonstrated with either exogenous creatinine or iohexol clearance (van Hoek et al., 2007).
Although the renal extraction of 99mTc-DTPA over a finite amount of time correlates well with inulin clearance in dogs and thus is a reliable, accurate estimate of GFR (Krawiec et al., 1986; Krawiec et al., 1988; Uribe et al., 1992), plasma clearance of radiolabeled markers has recently been called into question because 99mTc-pentetate produces consistently lower GFR values when compared with renal clearance of inulin (Finco, 2005). However, this difference may be due to intra-dog daily variations in GFR rather than a result of the radionuclide technique itself (Kampa et al., 2003). Additional studies are needed to determine why these differences exist and which radionuclide is best suited for GFR measurement in dogs and/or cats.
Iohexol
Iohexol is a nonionic, iodinated contrast agent used as a marker in both renal and plasma clearance studies. Iohexol can be assayed by a variety of techniques and iodinated compounds are in general very stable in plasma samples, allowing them to be frozen for extended times. Virtually all injected iohexol is excreted unchanged in the urine with an average half life of 74 min (Mutzel and Speck, 1980).
Although contrast agents may induce acute renal failure in people, particularly in those with pre-existing renal dysfunction, iohexol is generally considered very safe (Nossen et al., 1995; Rudnick et al., 1995). While the various methods of measuring iohexol in plasma produce consistent results over a variety of GFRs, variation exists between the absolute values obtained with each (Brown et al., 1996a; Finco et al., 2001; Miyamoto, 2001b). In addition, further investigation is necessary to determine which iohexol assay should be used when determining GFR, as results of endo- and exo-iohexol (the two stereoisomers of iohexol) assays have been significantly different from each other in recent studies, and may be due to higher reproducibility, and therefore accuracy, of exo-iohexol HPLC assays (Le Garreres et al., 2007; van Hoek et al., 2007; van Hoek et al., 2008; van Hoek et al., 2009b).
Most veterinary studies establishing the validity of iohexol for GFR measurement in dogs have compared iohexol clearance to exogenous or endogenous creatinine clearance rather than renal clearance of inulin. When compared to plasma clearance of 99mTc-DTPA, iohexol is useful for estimating GFR despite yielding consistently lower results (Moe and Heiene, 1995; Gleadhill and Michell, 1996). Plasma clearance of iohexol is valid in both dogs and cats (Miyamoto, 2001b) when compared to renal clearance of exogenous creatinine (Brown et al., 1996a; Finco et al., 2001), although differences exist based on which model is applied to the AUC calculation (Brown et al., 1996a).
Because iohexol plasma clearance appears to be the simplest and most accurate method for determining GFR in clinical practice, several studies have attempted to determine the lowest number of blood samples required for accurate results. Obtaining two plasma samples 5 and 120 min following marker injection in dogs and 20 and 180 min after injection in cats allows assessment of GFR with an acceptable margin of error (Goy-Thollot et al., 2006a). In addition, a 3-sample plasma clearance of iohexol protocol in healthy dogs of various body sizes also demonstrated good results (Bexfield et al., 2008) comparable to previous studies (Moe and Heiene, 1995; Brown et al., 1996a; Finco et al., 2001; Goy-Thollot et al., 2006a). In cats, two-and four-sample plasma clearance of iohexol has also provided accurate results when compared with plasma clearance of exogenous creatinine (Heiene et al., 2009). Finally, gadolinium, a contrast agent used for magnetic resonance imaging contrast studies, may be useful as an alternative marker to iohexol either via direct measurement of plasma clearance or when bound to a radionuclide, but studies are limited at this time (Magnotti et al., 2009; Nolan et al., 2009).
Alternative markers and techniques for determination of GFR
While renal or plasma clearance of injected markers are the most widely employed technique for evaluation of GFR, several other methods are worth mentioning. These include the relationship between GFR and the inverse of creatinine, the use of contrast-enhanced computed tomography (CT), and use of serum cystatin C as a marker of GFR.
The reciprocal of serum creatinine decreases in a linear fashion as renal disease progresses (Allen et al., 1987; Sanderson et al., 2005). A regression equation has been developed based on the relationship between plasma creatinine concentration and GFR as measured by renal clearance of inulin. This equation may be useful in predicting GFR based on creatinine concentration and does not require advanced diagnostics or assays with limited availability to perform (Finco et al., 1995). Unfortunately, this assay is likely most accurate when creatinine is greater than the reference range, which is when measurement of GFR is least useful.
Use of CT for GFR evaluation allows non-invasive measurement of the concentration of an injected marker (usually iohexol) by determining renal uptake both globally and by each kidney separately, similar to renal scintigraphy. In addition, CT eliminates the need for radioactive markers (O’Dell-Anderson et al., 2006). A region of interest is drawn around each kidney and the Hounsfield units (HU) are calculated in these regions. A linear relationship exists between iodine concentration and the degree of HU attenuation within the kidney. Repeated imaging allows progressive attenuation to be observed over time, and thus rate of contrast uptake, and therefore presumptive rate of elimination, can be made (O’Dell-Anderson et al., 2006). Thus far, GFR results obtained via CT are consistently lower than those obtained via plasma clearance of iohexol or renal scintigraphy, and further studies are necessary to establish the validity of this technique (O’Dell-Anderson et al., 2006).
Cystatin C is a protease inhibitor produced by all nucleated cells at a constant rate (Randers et al., 2001). It is filtered by the glomeruli without tubular secretion, making it a candidate marker for determination of GFR. Although cystatin C may eventually supplant creatinine as a marker of renal disease in people, studies in dogs have yielded conflicting results. Serum cystatin C increases in dogs with naturally occurring diseases associated with renal impairment, and is a more sensitive marker of renal disease than creatinine (de Scally et al., 2006; Antognoni et al., 2007; Wehner et al., 2008; Miyagawa et al., 2009; Pasa et al., 2009); however, creatinine is slightly more specific (Wehner et al., 2008).
Expected GFR in healthy and diseased dogs and cats
Although published studies of healthy animals have reported GFR results for the various techniques, ‘normal’ GFR is poorly defined in dogs and cats, and a reference range has not been definitively agreed upon; the variation in results reported in normal dogs and cats has been evident in previously reported surveys of the GFR body of literature (Moe and Heine, 1998). The primary reason why a reference range for GFR has not been produced is most likely due to variations in protocols (i.e. markers used, assays for measurement of serum or urine marker concentration, urine or blood sampling times, and pharmacokinetic models used for GFR calculation), as well as the unclear influence of the previously discussed factors that may influence GFR, such as patient signalment, circadian variation, hydration status, dietary protein concentration, and the use of sedation during GFR measurement. As with any analyte, it is important that each laboratory establish its own reference range for a given GFR protocol.
Using these previously reported GFR results and weighing mean values based on sample sizes, weighted means and standard deviations were used to calculate 95% confidence intervals for each method of GFR assessment in dogs and cats (Tables 1 and 2). Interestingly, although the various published studies and GFR results superficially appear to vary by a wide margin, using this weighted mean technique it becomes evident that all methods of GFR determination lead to somewhat equivalent results. Unfortunately, many published studies could not be used in these analyses because reported GFR results represented a mixed population of healthy and diseased animals.
Table 1.
Weighted means analysis of glomerular filtration rate (mL/min/kg) for published canine studies
| Number of studies | Number of mean GFR Measurements | Weighted mean GFR | 95% CIg | |
|---|---|---|---|---|
| Renal inulin clearance | 3a | 8 | 3.91 | 3.55–4.27 |
| Plasma inulin clearance | 2b | 2 | 3.81 | ND |
| Renal endogenous creatinine clearance | 5c | 10 | 3.73 | 3.22–4.24 |
| Renal exogenous creatinine clearance | 3d | 7 | 3.59 | 3.11–4.06 |
| Plasma exogenous creatinine clearance | 4e | 8 | 4.85h | 3.05–6.64i |
| Plasma iohexol clearance | 5f | 12 | 3.05 | 2.45–3.64 |
GFR, glomerular filtration rate; CI, confidence intervals.
Bovee and Joyce, 1979; Finco et al., 1981; Krawiec et al., 1986; Watson et al., 2002; Narita et al., 2006
Goy-Thollot et al., 2006b; Lefebvre et al., 2006; O’Dell Anderson et al., 2006; Bexfield et al., 2008; Kongara et al., 2009
95% CI only calculated for GFR techniques with a minimum of five reported mean measurements
Weighted mean GFR after exclusion of outlying study (Labato and Ross, 1991) = 3.30
95% CI after exclusion of outlying study (Labato and Ross, 1991) = 2.96–3.64.
Table 2.
Weighted means analysis of glomerular filtration rate (mL/min/kg) for published feline studies
| Number of studies | Number of mean GFR measurements | Weighted mean GFR | 95% CI | |
|---|---|---|---|---|
| Renal inulin clearance | 5b | 5 | 3.04 | 2.59–3.49 |
| Plasma inulin clearance | 4c | 7 | 3.05 | 2.67–3.44 |
| Renal exogenous creatinine clearance | 5d | 6 | 2.92 | 2.66–3.18 |
| Plasma exogenous creatinine clearance | 4e | 7 | 2.86 | 2.28–3.45 |
| Plasma iohexol clearancea | 5f | 8 | 2.52 | 2.19–2.86 |
GFR, glomerular filtration rate; CI, confidence intervals.
Only assays which reported total serum iohexol (versus eno- or exo-iohexol) concentration were included in weighted means analysis
When comparing these means, factors such as age, sex, breed, and method of creatinine measurement were not considered. In addition, the weighted mean and 95% confidence interval for plasma exogenous creatinine clearance in dogs includes one study (Labato and Ross, 1991) that reported GFR results (7.42 mL/min/kg; 30 dogs) more than two times greater than all other reported GFR values, and thus resulted in a much higher weighted mean GFR for this technique. If this study is removed from the analysis, the mean GFR for plasma clearance of exogenous creatinine is again very similar to other methods in dogs. Therefore, this preliminary comparison of reported GFR suggests that concerns that variations in techniques may make comparison of values from laboratory to laboratory inappropriate are overstated or potentially unfounded.
We must emphasize that the purpose of these 95% confidence interval calculations is to provide approximate GFR values in healthy animals, not to report definitive reference ranges. Patient-specific factors suggest that rather than comparing a single GFR measurement to a reference range, comparing serial measurements over time in a patient may be more useful and appropriate. A complicating factor, however, is that observed changes in GFR over time must be balanced by the coefficients of variation reported for the various markers. For example, variability for the exo-iohexol isomer in cats and for 99mTc-DTPA renal scintigraphic uptake in dogs is between 7.0 and 9.0% (Kampa et al., 2003; van Hoek et al., 2007), whereas variability for the endo-iohexol isomer in cats and exogenous creatinine clearance following intravenous bolus administration is between 14.0 and 17.5% (van Hoek et al., 2007).
Despite the relatively large number of studies which have investigated various techniques for measurement of GFR in normal dogs and cats and those with naturally-occurring or induced renal dysfunction, few have reported the prevalence or severity of GFR decreases in dogs or cats with non-renal diseases. Reduced GFR has been best documented in non-azotemic animals with diseases commonly associated with renal dysfunction, such as hyperthyroid cats following treatment and return to a euthyroid state, or dogs with leishmaniasis (Tables 3 and 4). However, changes in GFR that occur with those conditions which may have some effect on kidney function without commonly resulting in azotemia, such as lymphoma or neoplasia in general, or during and following anesthesia of patients with concurrent metabolic derangements, still require further characterization.
Table 3.
Selected published GFR results from dogs with naturally-occurring or clinically relevant induced diseases
| Disease condition | Marker | Number of dogs | Method | GFR resultsa | Reference |
|---|---|---|---|---|---|
| Cardiac disease | |||||
| Chronic valvular disease (NYHA class I–II) | exogenous creatinine | 15 | CLplasma | 3.1 (0.8) | Nicolle et al., 2007 |
| Chronic valvular disease (NYHA class III–IV) | exogenous creatinine | 9 | CLplasma | 1.7 (0.7) | Nicolle et al., 2007 |
| Chronic valvular disease, non-azotemic | exogenous creatinine | 16 | CLplasma | 3.2 (0.6) | Nicolle et al., 2007 |
| Chronic valvular disease, azotemic | exogenous creatinine | 8 | CLplasma | 1.4 (0.5) | Nicolle et al., 2007 |
| Infectious disease | |||||
| Leishmaniasis, secondary IRIS CKD stage 1, non-proteinuric | exogenous creatinine | 8 | CLplasma | 4.4 (0.74) | Cortadellas et al., 2008 |
| Leishmaniasis, secondary IRIS CKD stage 1, proteinuric | exogenous creatinine | 10 | CLplasma | 4.5 (1.44) | Cortadellas et al., 2008 |
| Leishmaniasis, secondary IRIS CKD stage 2 | exogenous creatinine | 5 | CLplasma | 2.8 (0.97) | Cortadellas et al., 2008 |
| Leishmaniasis, secondary IRIS CKD stage 3 | exogenous creatinine | 3 | CLplasma | 1.5 (0.43) | Cortadellas et al., 2008 |
| Renal disease | |||||
| 1 month following serial unilateral renal biopsies of normal kidneys | 99mTc-DTPA | 10 | Renal scintigraphy | 3.37 | Groman et al., 2004 |
| Endocrine disease | |||||
| Hypothyroidism (I131-induced) | exogenous creatinine | 8 | CLplasma | 2.13 (0.48) | Panciera and Lefebvre, 2009 |
| Hypothyroid (naturally-occurring) | exogenous creatinine | 14 | CLplasma | 1.6 (0.4) | Gommeren et al., 2009 |
| Post 1 month thyroxine therapy | exogenous creatinine | 14 | CLplasma | 2.1 (0.4) | Gommeren et al., 2009 |
| Post 6 month thyroxine therapy | exogenous creatinine | 11 | CLplasma | 2.0 (0.4) | Gommeren et al., 2009 |
| Drug effects in healthy dogs | |||||
| Post-anesthesia and tramadol analgesia | Iohexol | 8 | CLplasma | 4.56 ± 0.18 | Kongara et al., 2009 |
| Post-anesthesia and parecoxib analgesia | Iohexol | 8 | CLplasma | 4.56 ± 0.23 | Kongara et al., 2009 |
| Post-anesthesia and tramadol, parecoxib, and pindolol analgesia | Iohexol | 8 | CLplasma | 4.62 ± 0.22 | Kongara et al., 2009 |
| Post-anesthesia and morphine analgesia | Iohexol | 8 | CLplasma | 4.54 ± 0.25 | Kongara et al., 2009 |
| Post-anesthesia, no analgesia | Iohexol | 8 | CLplasma | 4.69 ± 0.75 | Kongara et al., 2009 |
| During xylazine, ketamine, and halothane anesthesia | 99mTc-DTPA | 10 | Renal scintigraphy | 4.6 ± 0.32 | Fusellier et al., 2007 |
| During propofol anesthesia | 99mTc-DTPA | 10 | Renal scintigraphy | 3.78 ± 0.37 | Fusellier et al., 2007 |
| Following 30 days of low-dose ketoprofen | exogenous creatinine | 7 | CLplasma | 5.11 (0.72) | Narita et al., 2006 |
NYHA, New York Heart Association; IRIS, International Renal Interest Society; CKD, chronic kidney disease; CLplasma, plasma clearance
Results reported as mL/min/kg, mean (standard deviation) or mean ± standard error of the mean
Table 4.
Selected published GFR results from cats with naturally-occurring or clinically relevant induced diseases
| Disease condition | Marker | Number of cats | Method | GFR resultsa | Reference |
|---|---|---|---|---|---|
| Neoplasia | |||||
| Solid tumors (carcinomas and sarcomas) | 99mTc-DTPA | 10 | CLplasma | 2.4 (0.9) | Bailey et al., 2004 |
| Renal disease | |||||
| Polycystic kidney disease | 99mTc-DTPA | 5 | Renal scintigraphy | 2.7 (0.3) | Reichle et al., 2002 |
| Polycystic kidney disease | 99mTc-DTPA | 5 | CLplasma | 3.1 (1.0) | Reichle et al., 2002 |
| Allograft rejection | 99mTc-DTPA | 8 | Renal Scintigraphy | 0.87 (0.08) | Halling et al., 2003 |
| Chronic renal failure (IRIS CKD stage 2–4) | endogenous creatinine | 12 | CLurine | 0.789 (0.407) | Deguchi et al., 1997 |
| Endocrine disease | |||||
| Untreated hyperthyroidism (naturally-occurring) | Iohexol | 12 | CLplasma | 3.83 (1.82) | Becker et al., 2000 |
| Untreated hyperthyroidism (naturally-occurring) | Inulin | 24 | CLplasma | 3.79 (1.3) | Boag et al., 2007 |
| Untreated hyperthyroidism (naturally-occurring) | Exo-iohexol | 21 | CLplasma | 3.3 (1.2) | van Hoek et al., 2009 |
| Methimazole-controlled (normalized TT4) hyperthyroidism | Iohexol | 12 | CLplasma | 2.02 (0.81) | Becker et al., 2000 |
| 1 month post 131I treatment of hyperthyroidism | Inulin | 24 | CLplasma | 2.41 (0.83) | Boag et al., 2007 |
| 1 month post 131I treatment of hyperthyroidism | Exo-iohexol | 21 | CLplasma | 2.0 (0.8) | van Hoek et al., 2009 |
| 6 months post 131I treatment of hyperthyroidism | Inulin | 24 | CLplasma | 2.29 (0.98) | Boag et al., 2007 |
| 6 months post 131I treatment of hyperthyroidism | Exo-iohexol | 21 | CLplasma | 1.6 (0.6) | van Hoek et al., 2009 |
| Drug effects in healthy cats | |||||
| Following 4 days of meloxicam | Iohexol | 6 | CLplasma | 3.31 +/−0.27 | Goodman et al., 2009 |
IRIS, International Renal Interest Society; CKD, chronic kidney disease; TT4, serum total thyroxine; CLplasma, plasma clearance
Results reported as mL/min/kg, mean (standard deviation)
Conclusions
Although GFR measurement allows earlier detection of renal disease than other available assays, it is still a highly underutilized tool in dogs and cats. Simplification of assay protocols has been attempted by validating new markers and modifying sampling methods. However, lack of standardization of protocols and concerns about reproducibility of results make comparison of results from different laboratories difficult. In addition, while all GFR methods are considered acceptable, they may never have been compared to urine clearance of inulin, the gold standard. For GFR to become a practical tool in veterinary practice, standardized protocols should be adopted for each marker, thus allowing veterinarians to compare GFR results obtained at different places or times. Finally, breed- and age-dependent differences in GFR must be further investigated to determine whether a single reference range is appropriate for all animals.
Acknowledgments
The authors thank Dr. George Moore for assistance with statistical analyses, and Professor David Williams for assistance with preparation of Fig. 2.
Footnotes
Conflict of interest statement
Dr. Pressler receives research funding, including salary support, from the National Institutes of Health through an Omnibus Solicitation for Small Business Technology Transfer Grant (Grant 2R42DK079477-02), ‘Non-invasive optical determination of GFR,’ in cooperation with FAST Diagnostics and PharmacoPhotonics, LLC.
Publisher's Disclaimer: This is a PDF file of an unedited manuscript that has been accepted for publication. As a service to our customers we are providing this early version of the manuscript. The manuscript will undergo copyediting, typesetting, and review of the resulting proof before it is published in its final citable form. Please note that during the production process errors may be discovered which could affect the content, and all legal disclaimers that apply to the journal pertain.
References
- Allen TA, Jaenke RS, Fettman MJ. A technique for estimating progression of chronic renal failure in the dog. Journal of the American Veterinary Medical Association. 1987;190:866–868. [PubMed] [Google Scholar]
- Amdur RJ, Mazzaferri EL. Half-Life and emission products of I-131. In: Amdur RJ, Mazaferri EL, editors. Essentials of Thyroid Cancer Management. Springer; New York NY, USA: pp. 165–169. [Google Scholar]
- Antognoni MT, Siepi D, Porciello F, Rueca F, Fruganti G. Serum cystatin-C evaluation in dogs affected by different diseases associated or not with renal insufficiency. Veterinary Research Communications. 2007;31:269–271. doi: 10.1007/s11259-007-0044-1. [DOI] [PubMed] [Google Scholar]
- Bailey DB, Rassnick KM, Erb HN, Dykes NL, Hoopes PJ, Page RL. Effect of glomerular filtration rate on clearance and myelotoxicity of carboplatin in cats with tumors. American Journal of Veterinary Research. 2004;65:1502–1507. doi: 10.2460/ajvr.2004.65.1502. [DOI] [PubMed] [Google Scholar]
- Barthez PY, Hornof WJ, Cowgill LD, Neal LA, Mickel P. Comparison between the scintigraphic uptake and plasma clearance of Tc-99m-diethylenetriaminepentacetic acid (DTPA) for the evaluation of the glomerular filtration rate in dogs. Veterinary Radiology and Ultrasound. 1998;39:470–474. doi: 10.1111/j.1740-8261.1998.tb01636.x. [DOI] [PubMed] [Google Scholar]
- Barthez PY, Chew DJ, DiBartola SP. Effect of sample number and time on determination of plasma clearance of technetium Tc 99m pentetate and orthoiodohippurate sodium I 131 in dogs and cats. American Journal of Veterinary Research. 2000;61:280–285. doi: 10.2460/ajvr.2000.61.280. [DOI] [PubMed] [Google Scholar]
- Barthez PY, Chew DJ, DiBartola SP. Simplified methods for estimation of Tc-99m-pentetate and I-131-orthoiodohippurate plasma clearance in dogs and cats. Journal of Veterinary Internal Medicine. 2001;15:200–208. doi: 10.1892/0891-6640(2001)015<0200:smfeoa>2.3.co;2. [DOI] [PubMed] [Google Scholar]
- Becker TJ, Graves TK, Kruger JM, Braselton WE, Nachreiner RF. Effects of methimazole on renal function in cats with hyperthyroidism. Journal of the American Animal Hospital Association. 2000;36:215–223. doi: 10.5326/15473317-36-3-215. [DOI] [PubMed] [Google Scholar]
- Bexfield NH, Heiene R, Gerritsen RJ, Risoen U, Eliassen KA, Herrtage ME, Michell AR. Glomerular filtration rate estimated by 3-sample plasma clearance of iohexol in 118 healthy dogs. Journal of Veterinary Internal Medicine. 2008;22:66–73. doi: 10.1111/j.1939-1676.2007.0035.x. [DOI] [PubMed] [Google Scholar]
- Boag AK, Neiger R, Slater L, Stevens KB, Haller M, Church DB. Changes in the glomerular filtration rate of 27 cats with hyperthyroidism after treatment with radioactive iodine. The Veterinary Record. 2007;161:711–715. doi: 10.1136/vr.161.21.711. [DOI] [PubMed] [Google Scholar]
- Bovee KC, Joyce T. Clinical evaluation of glomerular function: 24-hour creatinine clearance in dogs. Journal of the American Veterinary Medical Association. 1979;174:488–491. [PubMed] [Google Scholar]
- Brown SA. Determinants of glomerular ultrafiltration in cats. American Journal of Veterinary Research. 1993;54:970–975. [PubMed] [Google Scholar]
- Brown SA, Finco DR, Boudinot FD, Wright J, Taver SL, Cooper T. Evaluation of a single injection method, using iohexol, for estimating glomerular filtration rate in cats and dogs. American Journal of Veterinary Research. 1996a;57:105–110. [PubMed] [Google Scholar]
- Brown SA, Haberman C, Finco DR. Use of plasma clearance of inulin for estimating glomerular filtration rate in cats. American Journal of Veterinary Research. 1996b;57:1702–1705. [PubMed] [Google Scholar]
- Cortadellas O, Del Palacio MJ, Talavera J, Bayon A. Glomerular filtration rate in dogs with leishmaniasis and chronic kidney disease. Journal of Veterinary Internal Medicine. 2008;22:293–300. doi: 10.1111/j.1939-1676.2008.0062.x. [DOI] [PubMed] [Google Scholar]
- de Scally MP, Leisewitz AL, Lobetti RG, Thompson PN. The elevated serum urea:creatinine ratio in canine babesiosis in South Africa is not of renal origin. Journal of the South African Veterinary Association. 2006;77:175–178. doi: 10.4102/jsava.v77i4.373. [DOI] [PubMed] [Google Scholar]
- Deguchi E, Akuzawa M. Renal clearance of endogenous creatinine, urea, sodium, and potassium in normal cats and cats with chronic renal failure. Journal of Veterinary Medical Science. 1997;59:509–512. doi: 10.1292/jvms.59.509. [DOI] [PubMed] [Google Scholar]
- DiBartola SP. Fluid, Electrolyte, and Acid-Base Disorders in Small Animal Practice. 3. Saunders Elsevier; 2005. [Google Scholar]
- Dzau VJ. Renal and circulatory mechanisms in congestive heart failure. Kidney International. 1987;31:1402–1415. doi: 10.1038/ki.1987.156. [DOI] [PubMed] [Google Scholar]
- Feeman WE, 3rd, Couto CG, Gray TL. Serum creatinine concentrations in retired racing Greyhounds. Veterinary Clinical Pathology. 2003;32:40–42. doi: 10.1111/j.1939-165x.2003.tb00312.x. [DOI] [PubMed] [Google Scholar]
- Fettman MJ, Allen TA, Wilke WL, Radin MJ, Eubank MC. Single-injection method for evaluation of renal function with 14C-inulin and 3H-tetraethylammonium bromide in dogs and cats. American Journal of Veterinary Research. 1985;46:482–485. [PubMed] [Google Scholar]
- Finco DR, Coulter DB, Barsanti JA. Simple, accurate method for clinical estimation of glomerular filtration rate in the dog. American Journal of Veterinary Research. 1981;42:1874–1877. [PubMed] [Google Scholar]
- Finco DR, Brown SA, Crowell WA, Barsanti JA. Exogenous creatinine clearance as a measure of glomerular filtration rate in dogs with reduced renal mass. American Journal of Veterinary Research. 1991;52:1029–1032. [PubMed] [Google Scholar]
- Finco DR, Tabaru H, Brown SA, Barsanti JA. Endogenous creatinine clearance measurement of glomerular filtration rate in dogs. American Journal of Veterinary Research. 1993;54:1575–1578. [PubMed] [Google Scholar]
- Finco DR, Brown SA, Vaden SL, Ferguson DC. Relationship between plasma creatinine concentration and glomerular filtration rate in dogs. Journal of Veterinary Pharmacology and Therapeutics. 1995;18:418–421. doi: 10.1111/j.1365-2885.1995.tb00619.x. [DOI] [PubMed] [Google Scholar]
- Finco DR, Braselton WE, Cooper TA. Relationship between plasma iohexol clearance and urinary exogenous creatinine clearance in dogs. Journal of Veterinary Internal Medicine. 2001;15:368–373. [PubMed] [Google Scholar]
- Finco DR. Measurement of glomerular filtration rate via urinary clearance of inulin and plasma clearance of technetium Tc 99m pentetate and exogenous creatinine in dogs. American Journal of Veterinary Research. 2005;66:1046–1055. doi: 10.2460/ajvr.2005.66.1046. [DOI] [PubMed] [Google Scholar]
- Fusellier M, Desfontis J, Madec S, Gautier F, Debailleul M, Gogny M. Influence of three anesthetic protocols on glomerular filtration rate in dogs. American Journal of Veterinary Research. 2007;68:807–811. doi: 10.2460/ajvr.68.8.807. [DOI] [PubMed] [Google Scholar]
- Gleadhill A, Michell AR. Evaluation of iohexol as a marker for the clinical measurement of glomerular filtration rate in dogs. Research in Veterinary Science. 1996;60:117–121. doi: 10.1016/s0034-5288(96)90004-1. [DOI] [PubMed] [Google Scholar]
- Gommeren K, van Hoek I, Lefebvre HP, Benchekroun G, Smets P, Daminet S. Effect of thyroxine supplementation on glomerular filtration rate in hypothyroid dogs. Journal of Veterinary Internal Medicine. 2009;23:844–849. doi: 10.1111/j.1939-1676.2009.0331.x. [DOI] [PubMed] [Google Scholar]
- Goodman LA, Brown SA, Torres BT, Reynolds LR, Budsberg SC. Effects of meloxicam on plasma iohexol clearance as a marker of glomerular filtration rate in conscious healthy cats. American Journal of Veterinary Research. 2009;70:826–830. doi: 10.2460/ajvr.70.7.826. [DOI] [PubMed] [Google Scholar]
- Goy-Thollot I, Besse S, Garnier F, Marignan M, Barthez PY. Simplified methods for estimation of plasma clearance of iohexol in dogs and cats. Journal of Veterinary Internal Medicine. 2006a;20:52–56. doi: 10.1892/0891-6640(2006)20[52:smfeop]2.0.co;2. [DOI] [PubMed] [Google Scholar]
- Goy-Thollot I, Chafotte C, Besse S, Garnier F, Barthez PY. Iohexol plasma clearance in healthy dogs and cats. Veterinary Radiology and Ultrasound. 2006b;47:168–173. doi: 10.1111/j.1740-8261.2006.00133.x. [DOI] [PubMed] [Google Scholar]
- Groman RP, Bahr A, Berridge BR, Lees GE. Effects of serial ultrasound-guided renal biopsies on kidneys of healthy adolescent dogs. Veterinary Radiology and Ultrasound. 2004;45:62–69. doi: 10.1111/j.1740-8261.2004.04010.x. [DOI] [PubMed] [Google Scholar]
- Hall JE, Guyton AC, Farr BM. A single-injection method for measuring glomerular filtration rate. American Journal of Physiology. 1977;232:F72–76. doi: 10.1152/ajprenal.1977.232.1.F72. [DOI] [PubMed] [Google Scholar]
- Haller M, Muller W, Binder H, Estelberger W, Arnold P. Single-injection inulin clearance—a simple method for measuring glomerular filtration rate in dogs. Research in Veterinary Science. 1998;64:151–156. doi: 10.1016/s0034-5288(98)90011-x. [DOI] [PubMed] [Google Scholar]
- Halling KB, Graham JP, Newell SP, Ellison GW, Detrisac CJ, Martin FG, VanGilder JM, Grossman D. Sonographic and scintigraphic evaluation of acute renal allograft rejection in cats. Veterinary Radiology and Ultrasound. 2003;44:707–713. doi: 10.1111/j.1740-8261.2003.tb00535.x. [DOI] [PubMed] [Google Scholar]
- Heiene R, Reynolds BS, Bexfield NH, Larsen S, Gerritsen RJ. Estimation of glomerular filtration rate via 2- and 4-sample plasma clearance of iohexol and creatinine in clinically normal cats. American Journal of Veterinary Research. 2009;70:176–185. doi: 10.2460/ajvr.70.2.176. [DOI] [PubMed] [Google Scholar]
- Hoang K, Tan JC, Derby G, Blouch KL, Masek M, Ma I, Lemley KV, Myers BD. Determinants of glomerular hypofiltration in aging humans. Kidney International. 2003;64:1417–1424. doi: 10.1046/j.1523-1755.2003.00207.x. [DOI] [PubMed] [Google Scholar]
- Ischikawa I, Harris R. Angiotensin actions in the kidney: Renewed insight into the old hormone. Kidney International. 1991;40:583–596. doi: 10.1038/ki.1991.249. [DOI] [PubMed] [Google Scholar]
- Kampa N, Bostrom I, Lord P, Wennstrom U, Ohagen P, Maripuu E. Day-to-day variability in glomerular filtration rate in normal dogs by scintigraphic technique. Journal of Veterinary Medicine. A, Physiology, pathology, clinical medicine. 2003;50:37–41. doi: 10.1046/j.1439-0442.2003.00494.x. [DOI] [PubMed] [Google Scholar]
- Kampa N, Lord P, Maripuu E. Effect of observer variability on glomerular filtration rate measurement by renal scintigraphy in dogs. Veterinary Radiology and Ultrasound. 2006;47:212–221. doi: 10.1111/j.1740-8261.2006.00130.x. [DOI] [PubMed] [Google Scholar]
- Kongara K, Chambers P, Johnson CB. Glomerular filtration rate after tramadol, parecoxib and pindolol following anaesthesia and analgesia in comparison with morphine in dogs. Veterinary Anesthesia and Analgesia. 2009;36:86–94. doi: 10.1111/j.1467-2995.2008.00430.x. [DOI] [PubMed] [Google Scholar]
- Krawiec DR, Badertscher RR, 2nd, Twardock AR, Rubin SI, Gelberg HB. Evaluation of 99mTc-diethylenetriaminepentaacetic acid nuclear imaging for quantitative determination of the glomerular filtration rate of dogs. American Journal of Veterinary Research. 1986;47:2175–2179. [PubMed] [Google Scholar]
- Krawiec DR, Twardock AR, Badertscher RR, 2nd, Daniel GB, Dugan SJ. Use of 99mTc diethylenetriaminepentaacetic acid for assessment of renal function in dogs with suspected renal disease. Journal of the American Veterinary Medical Association. 1988;192:1077–1080. [PubMed] [Google Scholar]
- KuKanich B, Coetzee JF, Gehring R, Hubin M. Comparative distribution of pharmacologic markers for cytochrome P-450 mediated metabolism, glomerular filtration rate, and extracellular and total body fluid volume of greyhound and beagle dogs. Journal of Veterinary Pharmacology and Therapeutics. 2007;30:314–319. doi: 10.1111/j.1365-2885.2007.00875.x. [DOI] [PubMed] [Google Scholar]
- La Garreres AL, Laroute V, De La Farge F, Boudet KG, Lefebvre HP. Disposition of plasma creatinine in non-azotemic and moderately azotemic cats. Journal of Feline Medicine and Surgery. 2007;9:89–96. doi: 10.1016/j.jfms.2006.08.003. [DOI] [PMC free article] [PubMed] [Google Scholar]
- Labato MA, Ross LA. Plasma Disappearance of Creatinine as a Renal Function Test in the Dog. Research in Veterinary Science. 1991;50:253–258. doi: 10.1016/0034-5288(91)90119-9. [DOI] [PubMed] [Google Scholar]
- Lapointe JY, Bell PD, Cardinal J. Direct evidence for apical Na+:2Cl-:K+ cotransport in macula densa cells. American Journal of Physiology. 1990;258:F1466–1469. doi: 10.1152/ajprenal.1990.258.5.F1466. [DOI] [PubMed] [Google Scholar]
- Lefebvre HP, Craig AJ, Braun JP. GFR in the Dog: Breed Effect. Proceedings of the 16th ECVIM-CA Congress; Amsterdam, Netherlands. 2006. p. 261. [Google Scholar]
- Maddox DA, Deen WM, Brenner BM. Dynamics of glomerular ultrafiltration. VI. Studies in the primate. Kidney International. 1974;5:271–278. doi: 10.1038/ki.1974.36. [DOI] [PubMed] [Google Scholar]
- Magnotti RA, Connell JL, Marietta PM. Automated colorimeteric gadolinium assay for verification of clearance and estimation of glomerular filtration rate. Clinica Chimica Acta. 2009;399:59–63. doi: 10.1016/j.cca.2008.09.009. [DOI] [PubMed] [Google Scholar]
- Matthews CME. Half-life of iodine-125. Physics in medicine and biology. 1960;5:45–47. doi: 10.1088/0031-9155/5/1/305. [DOI] [PubMed] [Google Scholar]
- McClellan JM, Goldstein RE, Erb HN, Dykes NL, Cowgill LD. Effects of administration of fluids and diuretics on glomerular filtration rate, renal blood flow, and urine output in healthy awake cats. American Journal of Veterinary Research. 2006;67:715–722. doi: 10.2460/ajvr.67.4.715. [DOI] [PubMed] [Google Scholar]
- Miyagawa Y, Takemura N, Hirose H. Evaluation of the measurement of serum cystatin C by an enzyme-linked immunosorbent assay for humans as a marker of the glomerular filtration rate in dogs. Journal of Veterinary Medical Science. 2009;71:1169–1176. doi: 10.1292/jvms.71.1169. [DOI] [PubMed] [Google Scholar]
- Miyamoto K. Evaluation of plasma clearance of inulin in clinically normal and partially nephrectomized cats. American Journal of Veterinary Research. 2001a;62:1332–1335. doi: 10.2460/ajvr.2001.62.1332. [DOI] [PubMed] [Google Scholar]
- Miyamoto K. Use of plasma clearance of iohexol for estimating glomerular filtration rate in cats. American Journal of Veterinary Research. 2001b;62:572–575. doi: 10.2460/ajvr.2001.62.572. [DOI] [PubMed] [Google Scholar]
- Moe L, Heiene R. Estimation of glomerular filtration rate in dogs with 99M-Tc-DTPA and iohexol. Research in Veterinary Science. 1995;58:138–143. doi: 10.1016/0034-5288(95)90067-5. [DOI] [PubMed] [Google Scholar]
- Moore LC. Interaction of tubuloglomerular feedback and proximal nephron reabsorption in autoregulation. Kidney International. 1982;12:S173–178. [PubMed] [Google Scholar]
- Mutzel W, Speck U. Pharmacokinetics and biotransformation of iohexol in the rat and the dog. Acta Radiology Supplement. 1980;362:87–92. [PubMed] [Google Scholar]
- Myers BD, Deen WM, Brenner BM. Effects of norepinephrine and angiotensin II on the determinants of glomerular ultrafiltration and proximal tubule fluid reabsorption in the rat. Circulation Research. 1975;37:101–110. doi: 10.1161/01.res.37.1.101. [DOI] [PubMed] [Google Scholar]
- Narita T, Sato R, Tomizawa N, Tani K, Komori S, Hara S. Safety of reduced-dosage ketoprofen for long-term oral administration in healthy dogs. American Journal of Veterinary Research. 2006;67:1115–1120. doi: 10.2460/ajvr.67.7.1115. [DOI] [PubMed] [Google Scholar]
- Navar LG. Renal autoregulation: perspectives from whole kidney and single nephron studies. American Journal of Physiology. 1978;234:F357–370. doi: 10.1152/ajprenal.1978.234.5.F357. [DOI] [PubMed] [Google Scholar]
- Nicolle AP, Chetboul V, Allerheiligen T, Pouchelon J, Gouni V, Tessier-Vetzel D, Sampedrano CC, Lefebvre H. Azotemia and glomerular filtration rate in dogs with chronic valvular disease. Journal of Veterinary Internal Medicine. 2007;21:943–949. doi: 10.1892/0891-6640(2007)21[943:aagfri]2.0.co;2. [DOI] [PubMed] [Google Scholar]
- Nolan BG, Ross LA, Vaccaro DE, Groman EV, Reinhardt CP. Estimation of glomerular filtration rate in dogs by plasma clearance of gadolinium diethylenetriamine pentaacetic acid as measured by use of an ELISA. American Journal of Veterinary Research. 2009;70:547–552. doi: 10.2460/ajvr.70.4.547. [DOI] [PubMed] [Google Scholar]
- Nossen JO, Jakobsen JA, Kjaersgaard P, Andrew E, Jacobsen PB, Berg KJ. Elimination of the non-ionic X-ray contrast media iodixanol and iohexol in patients with severely impaired renal function. Scandinavian Journal of Clinical Laboratory Investigation. 1995;55:341–350. doi: 10.3109/00365519509104972. [DOI] [PubMed] [Google Scholar]
- O’Dell-Anderson KJ, Twardock R, Grimm JB, Grimm KA, Constable PD. Determination of glomerular filtration rate in dogs using contrast-enhanced computed tomography. Veterinary Radiology and Ultrasound. 2006;47:127–135. doi: 10.1111/j.1740-8261.2006.00118.x. [DOI] [PubMed] [Google Scholar]
- Osbaldiston GW, Fuhrman W. The clearance of creatinine, inulin, para-aminohippurate and phenosulphothalein in the cat. Canadian Journal of Comparative Medicine. 1970;34:138–141. [PMC free article] [PubMed] [Google Scholar]
- Pagitz M, Frommlet F, Schwendenwein I. Evaluation of biological variance of cystatin C in comparison with other endogenous markers of glomerular filtration rate in healthy dogs. Journal of Veterinary Internal Medicine. 2007;21:936–942. doi: 10.1892/0891-6640(2007)21[936:eobvoc]2.0.co;2. [DOI] [PubMed] [Google Scholar]
- Panciera DL, Lefebvre HP. Effect of experimental hypothyrodisim on glomerular filtration rate and plasma creatinine concentration in dogs. Journal of Veterinary Internal Medicine. 2009;23:1045–1050. doi: 10.1111/j.1939-1676.2009.0371.x. [DOI] [PubMed] [Google Scholar]
- Pasa S, Bayramli G, Atasoy A, Karul A, Ertug S, Ozensoy Toz S. Evaluation of serum cystatin-C in dogs with visceral leishmaniasis. Veterinary Research Communications. 2009;33:529–534. doi: 10.1007/s11259-008-9200-5. [DOI] [PubMed] [Google Scholar]
- Purves RD. Numerical estimation of the noncompartmental pharmacokinetic parameters variance and coefficient of variation of residence times. Journal of Pharmaceutical Science. 1994;83:202–205. doi: 10.1002/jps.2600830217. [DOI] [PubMed] [Google Scholar]
- Queau Y, Biourge V, Germain C, Braun JP, Watson AD, Jeunesse E, Lefebvre HP. Effect of aging on plasma exogenous creatinine clearance in dogs [abstract] Journal of Veterinary Internal Medicine. 2007;21:598. [Google Scholar]
- Randers E, Kornerup K, Erlandsen EJ, Hasling C, Danielsen H. Cystatin C levels in sera of patients with acute infectious diseases with high C-reactive protein levels. Scandinavian Journal of Clinical Laboratory Investigation. 2001;61:333–335. doi: 10.1080/00365510152379076. [DOI] [PubMed] [Google Scholar]
- Reichle JK, DiBartola SP, Leveille R. Renal ultrasonographic and computed tomographic appearance, volume, and function of cats with autosomal dominant polycystic kidney disease. Veterinary Radiology and Ultrasound. 2002;43:368–373. doi: 10.1111/j.1740-8261.2002.tb01020.x. [DOI] [PubMed] [Google Scholar]
- Renkin EM, Robinson RR. Glomerular filtration. New England Journal of Medicine. 1974;290:785–792. doi: 10.1056/NEJM197404042901408. [DOI] [PubMed] [Google Scholar]
- Reynolds BS, Germain C, Boudet KG, Daste T, Braun JP, Lefebvre HP. Breed-dependency of basal plasma creatinine: a cat is not a cat. Journal of Veterinary Internal Medicine. 2008;22:797. doi: 10.1111/j.1939-1676.2010.0541.x. [DOI] [PubMed] [Google Scholar]
- Robinson T, Harbison M, Bovee KC. Influence of reduced renal mass on tubular secretion of creatinine in dog. American Journal of Veterinary Research. 1974;35:487–491. [Google Scholar]
- Rogers KS, Komkov A, Brown SA, Lees GE, Hightower D, Russo EA. Comparison of four methods of estimating glomerular filtration rate in cats. American Journal of Veterinary Research. 1991;52:961–964. [PubMed] [Google Scholar]
- Rose BD, Post TW. Clinical Physiology of Acid-Base and Electrolyte Disorders. 5. The McGraw-Hill Companies; 2001. [Google Scholar]
- Ross LA, Finco DR. Relationship of selected clinical renal function tests to glomerular filtration rate and renal blood flow in cats. American Journal of Veterinary Research. 1981;42:1704–1710. [PubMed] [Google Scholar]
- Rudnick MR, Goldfarb S, Wexler L, Ludbrook PA, Murphy MJ, Halpern EF, Hill JA, Winniford M, Cohen MB, VanFossen DB. Nephrotoxicity of ionic and nonionic contrast media in 1196 patients: a randomized trial. The Iohexol Cooperative Study. Kidney International. 1995;47:254–261. doi: 10.1038/ki.1995.32. [DOI] [PubMed] [Google Scholar]
- Russo EA, Lees GE, Hightower D. Evaluation of renal function in cats, using quantitative urinalysis. American Journal of Veterinary Research. 1986;47:1308–1312. [PubMed] [Google Scholar]
- Sanderson SL, Tetrick M, Brown SA, Adams LG, Kruger JM, Vaden SL, Moore LE. Relationship between serum iohexol clearance and reciprocal of serum creatinine in dogs with naturally occurring chronic renal failure. Journal of Veterinary Internal Medicine. 2005;19:433. [Google Scholar]
- Sapirstein LA, Vidt DG, Mandel MJ, Hanusek G. Volumes of distribution and clearances of intravenously injected creatinine in the dog. American Journal of Physiology. 1955;181:330–336. doi: 10.1152/ajplegacy.1955.181.2.330. [DOI] [PubMed] [Google Scholar]
- Starling EH. The glomerular functions of the kidney. Journal of Physiology. 1899;24:317. doi: 10.1113/jphysiol.1899.sp000760. [DOI] [PMC free article] [PubMed] [Google Scholar]
- Uribe D, Krawiec DR, Twardock AR, Gelberg HB. Quantitative renal scintigraphic determination of the glomerular filtration rate in cats with normal and abnormal kidney function, using 99mTc-diethylenetriaminepentaacetic acid. American Journal of Veterinary Research. 1992;53:1101–1107. [PubMed] [Google Scholar]
- van Hoek I, Vandermeulen E, Duchateau L, Lefebvre HP, Croubels S, Peremans K, Polis I, Daminet S. Comparison and reproducibility of plasma clearance of exogenous creatinine, exo-iohexol, endo-iohexol, and 51Cr-EDTA in young adult and aged healthy cats. Journal of Veterinary Internal Medicine. 2007;21:950–958. doi: 10.1892/0891-6640(2007)21[950:caropc]2.0.co;2. [DOI] [PubMed] [Google Scholar]
- van Hoek I, Lefebvre HP, Kooistra HS, Croubels S, Binst D, Peremans K, Daminet S. Plasma clearance of exogenous creatinine, exo-iohexol, and endo-iohexol in hyperthyroid cats before and after treatment with radioiodine. Journal of Veterinary Internal Medicine. 2008;22:879–885. doi: 10.1111/j.1939-1676.2008.0110.x. [DOI] [PubMed] [Google Scholar]
- van Hoek IM, Lefebvre HP, Paepe D, Croubels S, Biourge V, Daminet S. Comparison of plasma clearance of exogenous creatinine, exo-iohexol, and endo-iohexol over a range of glomerular filtration rates expected in cats. Journal of Feline Medicine and Surgery. 2009a;11:1028–1030. doi: 10.1016/j.jfms.2009.07.005. [DOI] [PMC free article] [PubMed] [Google Scholar]
- van Hoek I, Lefebvre HP, Peremans K, Meyer E, Croubels S, Vandermeulen E, Kooistra H, Saunders JH, Binst D, Daminet S. Short- and long-term follow-up of glomerular and tubular renal markers of kidney function in hyperthyroid cats after treatment with radioiodine. Domestic Animal Endocrinology. 2009b;36:45–56. doi: 10.1016/j.domaniend.2008.10.001. [DOI] [PubMed] [Google Scholar]
- Watson AD, Lefebvre HP, Concordet D, Laroute V, Ferre JP, Braun JP, Conchou F, Toutain PL. Plasma exogenous creatinine clearance test in dogs: comparison with other methods and proposed limited sampling strategy. Journal of Veterinary Internal Medicine. 2002;16:22–33. doi: 10.1892/0891-6640(2002)016<0022:peccti>2.3.co;2. [DOI] [PubMed] [Google Scholar]
- Wehner A, Hartmann K, Hirschberger J. Utility of serum cystatin C as a clinical measure of renal function in dogs. Journal of the American Animal Hospital Association. 2008;44:131–138. doi: 10.5326/0440131. [DOI] [PubMed] [Google Scholar]