Abstract
What are the rules relating the size of the brain and its structures to the number of cells that compose them and their average sizes? We have shown previously that the cerebral cortex, cerebellum and the remaining brain structures increase in size as a linear function of their numbers of neurons and non-neuronal cells across 6 species of primates. Here we describe that the cellular composition of the same brain structures of 5 other primate species, as well as humans, conform to the scaling rules identified previously, and that the updated power functions for the extended sample are similar to those determined earlier. Accounting for phylogenetic relatedness in the combined dataset does not affect the scaling slopes that apply to the cerebral cortex and cerebellum, but alters the slope for the remaining brain structures to a value that is similar to that observed in rodents, which raises the possibility that the neuronal scaling rules for these structures are shared among rodents and primates. The conformity of the new set of primate species to the previous rules strongly suggests that the cellular scaling rules we have identified apply to primates in general, including humans, and not only to particular subgroups of primate species. In contrast, the allometric rules relating body and brain size are highly sensitive to the particular species sampled, suggesting that brain size is neither determined by body size nor together with it, but is rather only loosely correlated with body size.
Key Words: Allometry; Brain size; Evolution; Glia, number; Neurons, number; Primates
Introduction
What are the rules and constraints that apply to how nature builds mammalian brains of different sizes? Until recently, studies of brain allometry were based solely on analyses of volume and surface relationships [Stephan et al., 1981; Frahm et al., 1982; Finlay and Darlington, 1995; Barton and Harvey, 2000; de Winter and Oxnard, 2001; Clark et al., 2001; Barton, 2002; Sultan, 2002] and variations in cell densities and glia/neuron ratios [Tower and Elliot, 1952; Haug, 1987; Stolzenburg et al., 1989], often across species belonging to different orders. Those studies led to the general view that larger mammalian brains are composed of relatively large cerebral cortices; a cerebellum of constant relative size [Stephan et al., 1981; Clark et al., 2001]; larger neurons, resulting in lesser neuronal densities; and increasing glia/neuron ratios [Tower and Elliot, 1952; Haug, 1987; Stolzenburg et al., 1989; Marino, 2006].
Applying a novel method developed by our group that allows for the fast and reliable estimation of numbers of neuronal and non-neuronal cells in any dissectable structure, the isotropic fractionator [Herculano-Houzel and Lent, 2005], we have been able to determine the cellular scaling rules that apply to the brains of members of 3 mammalian orders – rodents, primates and insectivores (Eulipotyphla) – and show that they differ markedly. Briefly, rodent brain structures increase in size as a function of their numbers of neurons raised to large powers (1.8, 1.4 and 1.8 for cerebral cortex, cerebellum and the remaining areas, respectively), while neuronal densities decrease and average neuronal sizes and the non-neuronal/neuronal cell ratios increase [Herculano-Houzel et al., 2006]. Rodents, therefore, seem to conform to the general rules obtained from a combination of mammals from several orders [Haug, 1987]. In contrast, primate brain structures increase in size as linear functions of their numbers of neurons, with insignificant changes in neuronal density, average neuronal size, and non-neuronal/neuronal cell ratios [Herculano-Houzel et al., 2007]. The human brain, recently estimated to contain on average 86 billion neurons and 85 billion non-neuronal cells, conforms in its cellular composition to the scaling rules found to apply to primate brains [Azevedo et al., 2009]. In Eulipotyphla, on the other hand, the cerebellum increases linearly in mass with its number of neurons, as in primates, while the mass of the cerebral cortex scales hypermetrically with its number of neurons, as in rodents [Sarko et al., 2009].
While rodent brain size in our study increased as a power function of body size with an exponent close to 3/4, in line with previous findings across mammalian orders that set that exponent at either 2/3 or 3/4 [Martin, 1981; Fox and Wilczynski, 1986], we found that, for our sample of 6 primate species, which included prosimians and New and Old World monkeys, brain size increased linearly with body size, contradicting previous analyses with different samples of primate species that included great apes [Jerison, 1973; Marino, 1998]. While the human brain was considered by these authors to be 5–7 times larger than expected given human body size, we found that, compared to the primate species in our sample, the human brain is about as large and has as many cells as expected for a primate of our body size [Azevedo et al., 2009]. As the precise allometric exponent relating brain size to body size depends on the choice of species, the discrepancy between our findings for humans as well as a set of 6 primate species and previous observations in the literature raises the issue of whether a similar dependence on the particular species investigated applies to the cellular scaling rules that we identified for the brain, or whether these rules apply to primates in general. Another related issue is whether the cellular scaling rules that apply to primate brains are affected once phylogeny is taken into consideration.
In order to address these issues, we extended our previous study by applying the same method, the isotropic fractionator, to estimate total numbers of neuronal and non-neuronal cells in the cerebral cortex, cerebellum and the rest of the brain and to determine how they scale across 5 other primate species ranging in brain size by a factor close to 100 times, a much larger range than investigated in the previous study, which examined primate species that varied in brain size by 11 times. We then investigate how the cellular scaling rules that apply to the primate brain are impacted by the addition of these 5 species as well as humans, and apply the analysis of independent contrasts to control for phylogenetic relatedness in the expanded dataset.
Materials and Methods
Animals
One mouse lemur (Microcebus murinus, male), 1 Goeldi's marmoset (Callimico goeldii, sex unknown), 1 long-tailed monkey (Macaca fascicularis, sex unknown), 1 bonnet monkey (Macaca radiata, male), and 2 baboons (Papio cynocephalus, 1 male, 1 female) were analyzed. All animals were adults at the time of the experiments. The 2 macaque monkeys were obtained from colonies in the department of psychology at Vanderbilt University. The Goeldi's marmoset was obtained from the colony at the Centro de Primatologia at Belém, Pará (Brazil). The mouse lemur brain was acquired from the Duke University Lemur Center and the 2 baboon brains were acquired from the University of Washington Tissue Program. Since only 1 brain hemisphere was available for each animal, all data are expressed as twice the numbers obtained for those hemispheres. Because body weights were available only for the mouse lemur and the 2 baboons in our sample, we used average values published in the literature for the Goeldi's marmoset [Stephan et al., 1981] and the 2 macaque species [Burish et al., 2010]. Body weight for Saimiri, missing in the original study [Herculano-Houzel et al., 2007], was taken from the accompanying paper [Burish et al., 2010]. Numbers of neurons in the grey matter of the cerebral cortex of the Callimico, M. fascicularis, M. radiata and Papio specimens analyzed here were reported previously as part of the cortical grey matter dataset in an earlier study [Herculano-Houzel et al., 2008; see below]. All veterinary care and procedures reported herein were performed according to the ethical standards of the Vanderbilt Institutional Animal Care and Use Committee.
Dissection
All animals, except the mouse lemur and baboons (which were obtained from the Duke Lemur Center and the University of Washington tissue program, respectively) were sacrificed by lethal injection of sodium pentobarbital, and perfused transcardially with 0.9% phosphate-buffered saline followed by 4% phosphate-buffered paraformaldehyde. Brains were removed from the skull after transecting the spinal cord at the level of the foramen magnum, weighed, and post-fixed for 2 weeks to 12 months by immersion in 4% phosphate-buffered paraformaldehyde. The cerebellum (Cb) was dissected by cutting the cerebellar peduncles at the surface of the brainstem. Since the Goeldi's marmoset cerebellum was only partially included in the dissection, this structure was eliminated from the analysis. Cerebral cortex (Cx) in all animals was defined as all cortical regions lateral to the olfactory tract, including hippocampus and piriform cortex, and dissected from each hemisphere by cutting the subcortical white matter (without the internal capsule) away from the underlying structures under a stereomicroscope in 2-mm coronal sections of the tissue, as described earlier [Herculano-Houzel et al., 2008]. The numbers of cells reported here are the combination of the numbers obtained for the grey and white matter separately. The olfactory bulb was not included in any brain. All other brain structures were pooled and processed together as ‘rest of brain’ (RoB).
Isotropic Fractionator
Total numbers of cells, neurons (N), and non-neuronal (‘other’, O) cells were estimated as described previously using the isotropic fractionator method [Herculano-Houzel and Lent, 2005]. Briefly, each dissected brain division is turned into an isotropic suspension of isolated nuclei of known, defined volume, kept homogeneous by agitation. The total number of nuclei in suspension – and therefore the total number of cells in the original tissue – is estimated by determining the density of nuclei in small aliquots stained with the fluorescent DNA marker DAPI (4′-6-diamidino-2-phenylindole dihydrochloride) under the microscope. For each structure, at least 4 samples of the nuclear suspension are counted independently, in different chambers of the hemocytometer, to determine the number of nuclei/ml of the suspension. The reported values for total number of cells refer to the average nuclei/ml of the samples taken multiplied by the total volume of the suspension. This consistently yields a coefficient of variation of 0.10, and never more than 0.15, across samples for a same structure. Once the total cell number is known, the proportion of neurons is determined by immunocytochemical detection of neuronal nuclear antigen (NeuN), expressed in all nuclei of most neuronal cell types and not in non-neuronal cells [Mullen et al., 1992]. Estimates of the proportion of NeuN-positive nuclei are considered reliable since the coefficient of variation among animals of the same species is typically below 0.15. Numbers of non-neuronal cells are derived by subtraction.
Data Analysis
All statistical analyses and regressions were performed in PASW 18 (IBM, USA), using the average values obtained for each species. Correlations between variables were calculated using the Spearman correlation coefficient. If a significance criterion of p < 0.05 was reached, regressions of the data to linear and power functions were calculated.
Phylogenetic Analysis
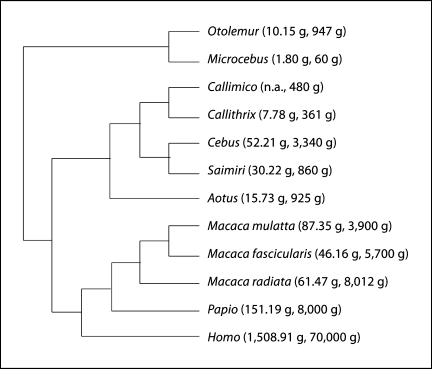
Phylogenetic independent contrasts were calculated to examine the scaling of the primate brain structures as a function of their cellular composition in the expanded dataset of 12 primate species, including humans, while controlling for effects of phylogenetic relatedness in the dataset [Felsenstein, 1985]. Standardized independent contrasts were calculated using the PDAP:PDTREE module of Mesquite software, version 2.7 [Maddison and Maddison, 2005]. Contrasts were calculated from both log-transformed and raw data, to evaluate how well they are described by power and linear functions, respectively. Phylogenetic relationships, shown in figure 1, are based on Purvis [1995] and Murphy et al. [2001]. Branch lengths were transformed according to the method of Pagel [1992], which assigns all branch lengths to 1 with the constraint that tips are contemporaneous. The reported values for the linear regressions of independent contrasts on log-transformed or raw data are least square regression (LSR) slope, r2 and p value. Reduced major axis slopes are similar to the reported least square regression slopes.
Fig. 1.
Phylogenetic relationships between the 12 primate species examined. Average brain mass and body mass for the species are shown in parentheses. Data from Herculano-Houzel et al. [2007], Azevedo et al. [2009] and this study.
Results
Across the 5 new primate species examined – Microcebus murinus, Callimico goeldii, M. fascicularis, M. radiata and Papio cynocephalus – body mass varies 133 times, from about 60 g in Microcebus to about 8,000 g in Papio and Macaca. Cortical mass varies between Microcebus and Papio, the smallest and largest species examined, by a factor of 132 times; cerebellar mass varies by a factor of 35 times; and the mass of the remaining structures varies 34 times. The numbers of neurons in these structures vary proportionately by 129 times in the Cx, 35 times in the Cb, and 25 times in the remaining areas (table 1). The percentage of neurons in the brain and the 3 subdivisions analyzed does not vary significantly with the mass of the structures (Spearman correlation, all values of p > 0.8), and in all species but M. radiata, neurons comprise more than 50% of all brain cells (table 1).
Table 1.
Cellular composition of the brain of a new set of primate species
| Microcebus murinus | Callimico goeldii | Macaca fascicularis | Macaca radiata | Papio cynocephalus | A | |
|---|---|---|---|---|---|---|
| n | 1 | 1 | 1 | 1 | 2 | |
| Body mass, g | 60 | 4801 | 5,7002 | 8,0122 | 8,000 | 133 × |
| Whole brain | ||||||
| Mass, g | 1.799 | n.a. | 46.16 | 61.47 | 151.19 | 84 × |
| Total number of cells | 393.66 × 10⁶ | n.a. | 6.59 × 10⁹ | 8.63 × 10⁹ | 20.12 × 10⁹ | 51 × |
| Total number of neurons | 254.71 × 10⁶ | n.a. | 3.44 × 10⁹ | 3.78 × 10⁹ | 10.95 × 10⁹ | 43 × |
| Total number of non-neuronal cells | 138.95 × 10⁶ | n.a. | 3.15 × 10⁹ | 4.88 × 10⁹ | 9.18 × 10⁹ | 66 × |
| % neuronal cells | 64.7 | n.a. | 52.2 | 43.5 | 54.4 | |
| NN/N | 0.546 | n.a. | 0.917 | 1.299 | 0.838 | |
| Cerebral cortex | ||||||
| Mass, g | 0.908 | 12.984 | 36.226 | 48.274 | 120.214 | 132 × |
| Total number of cells | 92.96 × 10⁶ | 1.07 × 10⁹ | 3.56 × 10⁹ | 5.46 × 10⁹ | 10.44 × 10⁹ | 112 × |
| Total number of neurons | 22.31 × 10⁶ | 357.13 × 10⁶ | 800.96 × 10⁶ | 1.66 × 10⁹ | 2.88 × 10⁹ | 129 × |
| Total number of non-neuronal cells | 70.65 × 10⁶ | 715.33 × 10⁶ | 2.76 × 10⁹ | 3.81 × 10⁹ | 7.57 × 10⁹ | 107 × |
| % neuronal cells | 24.0 | 33.3 | 22.5 | 30.3 | 27.5 | |
| NN/N | 3.167 | 2.003 | 3.444 | 2.300 | 2.633 | |
| Neuronal density, N/mg | 24,571 | 27,505 | 22,110 | 34,298 | 23,916 | |
| Non-neuronal density, NN/mg | 77,808 | 55,093 | 76,156 | 78,897 | 62,969 | |
| Cerebellum | ||||||
| Mass, g | 0.391 | n.a. | 5.642 | 5.748 | 13.745 | 35 × |
| Total number of cells | 238.82 × 10⁶ | n.a. | 2.71 × 10⁹ | 2.49 × 10⁹ | 8.32 × 10⁹ | 35 × |
| Total number of neurons | 221.39 × 10⁶ | n.a. | 2.57 × 10⁹ | 2.04 × 10⁹ | 7.79 × 10⁹ | 35 × |
| Total number of non-neuronal cells | 17.43 × 10⁶ | n.a. | 135.40 × 10⁶ | 453.56 × 10⁶ | 525.98 × 10⁶ | 30 × |
| % neuronal cells | 92.7 | n.a. | 95.0 | 81.8 | 93.7 | |
| NN/N | 0.079 | n.a. | 0.053 | 0.222 | 0.067 | |
| Neuronal density, N/mg | 566,205 | n.a. | 455,973 | 354,655 | 567,109 | |
| Non-neuronal density, NN/mg | 44,588 | n.a. | 23,999 | 78,908 | 38,267 | |
| Remaining areas | ||||||
| Mass, g | 0.500 | 2.086 | 4.294 | 7.448 | 17.235 | 34 × |
| Total number of cells | 61.88 × 10⁶ | 248.44 × 10⁹ | 325.62 × 10⁶ | 678.00 × 10⁶ | 1,357.96 × 106 | 22 × |
| Total number of neurons | 11.01 × 10⁶ | 53.91 × 10⁶ | 65.45 × 10⁶ | 61.36 × 10⁶ | 278.15 × 10⁶ | 25 × |
| Total number of non-neuronal cells | 50.86 × 10⁶ | 194.53 × 10⁶ | 260.17 × 10⁶ | 616.64 × 10⁶ | 1,079.81 × 106 | 21 × |
| % neuronal cells | 17.8 | 21.7 | 20.1 | 9.0 | 20.5 | |
| NN/N | 4.618 | 3.608 | 3.975 | 10.050 | 3.882 | |
| Neuronal density, N/mg | 22,029 | 25,844 | 15,242 | 8,238 | 16,139 | |
| Non-neuronal density, NN/mg | 93,254 | 93,254 | 60,589 | 82,793 | 62,652 | |
N = Number of neuronal cells; NN = number of non-neuronal cells.
From Stephan et al., 1981.
From Burish et al., 2010.
Conformity to the Expected Cellular Composition
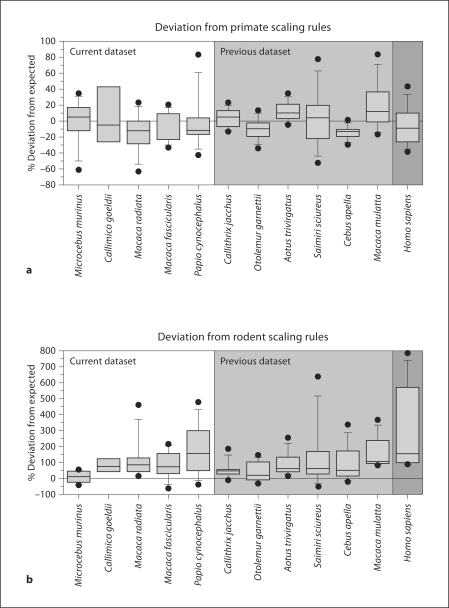
To examine whether the cellular composition of the brains of the present 5 primate species conforms to the rules identified previously for a different set of species, we first determined how the numbers of cells in each structure depart from the expected values obtained by applying to each species the scaling rules determined previously for primates [Herculano-Houzel et al., 2007]. For comparison, we also calculated how much numbers of cells depart from the expected for the brain structures of each of the species in the previous study (see online suppl. table 1, www.karger.com/doi/10.1159/000319872), and from the expected cellular composition according to the scaling rules observed for rodents [Herculano-Houzel et al., 2006]. The relationships examined were between the mass of each structure (whole brain, Cx, Cb, or remaining areas) and its numbers of neuronal and other cells. Percent deviations from the expected numbers of cells were calculated as [100 × (observed – expected)] for each relationship. The reciprocal relationships were not examined, as deviations tend to be symmetrical and would bias the results toward an erroneous average of zero deviation.
Figure 2a shows that the cellular composition of each of the present 5 primate species, as well as of humans, departs from the expected for structure mass within the same range of variation found for the 6 species from which the cellular scaling rules for primate brains were obtained (average deviation from the expected: −0.04 ± 10.47%). The average deviation for each species is not correlated to brain size (Spearman correlation coefficient −0.173, p = 0.612). In contrast, the cellular composition of the primate brains analyzed here is systematically larger than the expected for rodent brains of similar size (average deviation from the expected 114.67 ± 79.74%; fig. 2b), and the larger the size of the primate brain, the larger the deviation from the expected for a generic rodent brain (Spearman correlation coefficient 0.918, p = 0.000). Although numbers of neuronal and other cells in the brain structures of M. fascicularis tend to be smaller than the values expected for a primate brain, similar trends are also found for some species in the previous sample: M. mulatta and Aotus tend to have larger numbers of neuronal and other cells in their brain structures than expected, while Cebus tends to have smaller numbers of neuronal and other cells than expected in its brain structures. Most importantly, numbers of cells in each structure typically depart from the expected by ±20%, as shown by the filled intervals between the 25 and 75% percentiles in figure 2. This finding indicates that the brains of the 5 present species, like those of humans [Azevedo et al., 2009], conform to the cellular scaling rules described previously for 6 other primate species.
Fig. 2.
The current primate species deviate from the expected in their cellular composition by as much as the primate species studied earlier. Y-axis, percent deviation from the neuronal and non-neuronal composition expected from cerebral cortex, cerebellum and RoB mass according to the cellular scaling rules determined earlier for 6 primate species [Herculano-Houzel et al., 2007] (a) and 6 rodent species [Herculano-Houzel et al., 2006] (b). For each species, the median deviation, 25th percentile and 75th percentiles, 10th and 90th percentiles, and maximal and minimal deviations are indicated. Dots indicate maximal and minimal variation from the expected cellular composition. Deviations for the 6 primate species studied earlier and for the human brain are shown in the light and dark grey areas, respectively; the 5 new species are shown in the unshaded area. Comparison of a and b shows that the cellular composition of the primate brains studied here conforms to the primate scaling rules, but not to the rodent scaling rules, identified previously.
Cellular Scaling Rules
We next determined the cellular scaling rules that apply to the brains of the 5 present primate species. As observed for the previous set of 6 species, the mass of all structures analyzed – Cx, Cb and RoB – is found to vary as a function of their respective numbers of neuronal and non-neuronal cells in ways that can be described equally well as power laws with exponents of approximately 1.0, and as linear functions (table 2). The only exception is that the mass of the remaining structures in the new sample fails to vary significantly as a power function of its number of neurons, although this relationship can still be described as a linear function.
Table 2.
Cellular scaling rules for the current sample of primate brains
| Dependent variable | Independent variable | Power law | p value (exponent) | 95% confidence interval | Linear function | r2 | p value (slope) |
|---|---|---|---|---|---|---|---|
| MBR | MBD | Mbr = 0.07 × MBd0788 | 0.025 | 0.534–1.042 | MBR =-5.387 + 0.13 × MBD | 0.601 | 0.225 |
| MBr | NBr | MBR = 1.402 × 10⁻¹⁰ × Nbr1.206 | 0.004 | 1.060–1.352 | MBR = 1.552 + 1.382 × 10⁻⁸ × NBR | 0.993 | 0.000 |
| MBr | Obr | Mbr = 6.423 × 10⁻⁹ × Obr1.037 | 0.001 | 0.959–1.115 | MBR = −6.133 + 1.644 × 10⁻⁸ × Obr | 0.980 | 0.000 |
| MCX | NCX | MCX = 5.566 × 10⁻⁸ × NCX0.981 | 0.000 | 0.879–1.083 | MCX = −1.808 + 3.980 × 10⁻⁸ × NCX | 0.960 | 0.000 |
| MCX | OCX | MCX = 1-128 × 10−8X OCX1.012 | 0.000 | 0.914–1.110 | MCX = −2.720 + 1.556 × 10⁻⁸ × OCX | 0.984 | 0.001 |
| OCX | NCX | NNCX = 5.462 × NCX0.964 | 0.001 | 0.836–1.092 | OCX = 5.344 × 10⁷ + 2.563 × NCX | 0.979 | 0.001 |
| DnCX | MCX | n.s. | 0.851 | n.s. | n.s. | 0.008 | 0.889 |
| DOCX | MCX | n.s. | 0.725 | n.s. | n.s. | 0.054 | 0.732 |
| O/NCX | MCX | n.s. | 0.688 | n.s. | n.s. | 0.011 | 0.869 |
| MCB | NCB | MCB = 1-258 × 1 0-9 × NCB1.024 | 0.010 | 0.816–1.128 | MCB = 1-117 + 1.668 × 10⁻⁹ × NCB | 0.968 | 0.016 |
| Mcb | Ocb | MCB = 8.571 × 10⁻⁸ × Ocb0.932 | 0.049 | 0.502–1.362 | n.s. | n.s. | 0.166 |
| OCB | NCB | n.s. | 0.084 | n.s. | n.s. | n.s. | 0.246 |
| DNcb | Mcb | n.s. | 0.702 | n.s. | n.s. | n.s. | 0.868 |
| DOcb | Mcb | n.s. | 0.906 | n.s. | n.s. | n.s. | 0.862 |
| O/Ncb | Mcb | n.s. | 0.968 | n.s. | n.s. | n.s. | 0.881 |
| MRA | Nra | n.s. | 0.221 | n.s. | Mra = −0.247 + 6.298 × 10⁻⁸ × NRA | 0.853 | 0.025 |
| Mra | Ora | n.s. | 0.001 | 0.968–1.304 | Mra = −0.668 + 1.585 × 10⁻⁸ × ORA | 0.976 | 0.002 |
| Ora | Nra | n.s. | 0.241 | n.s. | n.s. | n.s. | 0.058 |
| DNra | Mra | n.s. | 0.058 | n.s. | n.s. | n.s. | 0.365 |
| DOra | Mra | n.s. | 0.127 | n.s. | n.s. | n.s. | 0.207 |
| O/Nra | Mra | n.s. | 0.115 | n.s. | n.s. | n.s. | 0.640 |
MBr = Average mass of the whole brain (in grams); NBr = average number of neurons in the whole brain; OBr = average number of other (non-neuronal) cells in the whole brain; MCX = average mass of the cerebral cortex (in grams); NCX = average number of neurons in the cerebral cortex; OCX = average number of other (non-neuronal) cells in the cerebral cortex; DNCX = average density of neurons per milligram of tissue in the cerebral cortex; O/NCX = average ratio of other (non-neuronal) and neuronal cells in the cerebral cortex; MCb = average mass of the cerebellum (in grams); NCb = average number of neurons in the cerebellum; OCB = average number of other (non-neuronal) cells in the cerebellum; DNcb = average density of neurons per milligram of tissue in the cerebellum; MRoB = average mass of the remaining areas (in grams); NRoB = average number of neurons in the remaining areas; Orob = average number of other (non-neuronal) cells in the rest of brain.
Updated Cellular Scaling Rules
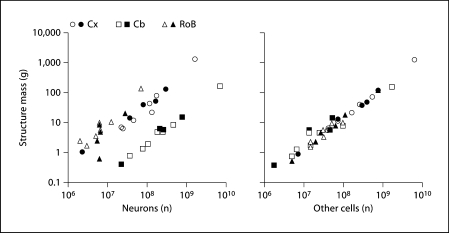
As a final step in examining whether the same cellular scaling rules apply to the previous and present sets of primate species, we determined the cellular scaling rules that apply to the combined dataset comprising all 12 available primate species, including humans, and calculated how the scaling is affected by phylogenetic relatedness. We find that the updated cellular scaling rules that apply to the Cx and Cb are linear and remain so even when phylogenetic independent contrasts are used, as were the rules determined for the previous sample. Asshown in figure 3, the mass of these structures varies coordinately with their numbers of neuronal (fig. 3a) and non-neuronal cells (fig. 3b) in ways that can be described equally well by power laws with exponents of approximately 1.0 and by linear functions (table 3). Additionally, power law exponents as well as the linear fits for the Cx and Cb are not significantly affected by the exclusion of humans from the extended dataset (table 3).
Fig. 3.
Scaling of brain structure mass in the combined dataset as a function of numbers of neurons and non-neuronal cells. Each point represents the average mass and number of neurons (left) or other cells (right) in the cerebral cortex (circles), cerebellum (squares) or RoB (triangles) of a primate species. Filled symbols = Current dataset; unfilled symbols = previous datasets [Herculano-Houzel et al., 2007; Azevedo et al., 2009]. The power and linear fits that can describe the individual relationships for each structure are shown in table 3.
Table 3.
Cellular scaling functions for the expanded primate dataset
| Linear scaling |
Power scaling |
||||
|---|---|---|---|---|---|
| uncorrected | independent contrasts | uncorrected | independent contrasts | ||
| MCX × NCX | slope, with humans | 7.68 × 10⁻⁸ | 7.73 × 10⁻⁸ | 1.087 | 1.078 |
| r2 | 0.991 | 0.986 | 0.956 | 0.962 | |
| 95% CI | 7.16–8.20 × 10⁻⁸ | 7.08–8.37 × 10⁻⁸ | 0.939–1.235 | 0.909–1.205 | |
| slope, no humans | 3.93 × 10⁻⁸ | 3.55 × 10⁻⁸* | 0.989 | 1.029 | |
| r2 | 0.904 | 0.786 | 0.944 | 0.961 | |
| 95% CI | 2.97–4.90 × 10⁻⁸ | 2.15–4.95 × 10⁻⁸ | 0.829–1.149 | 0.873–1.185 | |
| Mcb × Ncb | slope, with humans | 2.24 × 10⁻⁹ | 2.24 × 10⁻⁹ | 1.028 | 0.986 |
| r2 | 0.999 | 0.998 | 0.989 | 0.991 | |
| 95% CI | 2.19–2.28 × 10⁻⁹ | 2.16–2.31 × 10⁻⁹ | 0.956–1.100 | 0.916–1.057 | |
| slope, no humans | 1.73 × 10⁻⁹ | 1.51 × 10⁻⁹ | 1.018 | 0.988 | |
| r2 | 0.963 | 0.928 | 0.963 | 0.989 | |
| 95% CI | 1.45–2.01 × 10⁻⁹ | 1.17–1.86 × 10⁻⁹ | 0.904–1.132 | 0.903–1.074 | |
| MroB × NroB | slope, with humans | 1.68 × 10⁻⁷ | 1.66 × 10⁻⁷ | 1.214* | 1.443* |
| r2 | 0.940 | 0.901 | 0.695 | 0.759 | |
| 95% CI | 1.38–1.98 × 10⁻⁷ | 1.27–2.05 × 10⁻⁷ | 0.704–1.724 | 0.870–2.015 | |
| slope, no humans | 6.13 × 10⁻⁸ | 5.31 × 10⁻⁸* | 0.959* | 1.461* | |
| r2 | 0.800 | 0.615 | 0.417 | 0.701 | |
| 95% CI | 3.82–8.44 × 10⁻⁸ | 2.14–8.48 × 10⁻⁸ | 0.203–1.715 | 0.741–2.181 | |
| Mbr × Nbr | slope, with humans | 1.77 × 10⁻⁸ | 1.77 × 10⁻⁸ | 1.130 | 1.134 |
| r2 | 0.999 | 0.991 | 0.991 | 0.992 | |
| 95% CI | 1.73–1.80 × 10⁻⁸ | 1.72–1.81 × 10⁻⁸ | 1.058–1.202 | 1.055–1.213 | |
| slope, no humans | 1.41 × 10⁻⁸ | 1.37 × 10⁻⁸ | 1.155 | 1.144 | |
| r2 | 0.984 | 0.958 | 0.984 | 0.990 | |
| 95% CI | 1.26–1.56 × 10⁻⁸ | 1.14–1.60 × 10⁻⁸ | 1.049–1.261 | 1.048–1.236 | |
| MCX × OCX | slope, with humans | 2.04 × 10⁻⁸ | 2.05 × 10⁻⁸ | 1.036 | 1.035 |
| r2 | 0.998 | 0.999 | 0.994 | 0.996 | |
| 95% CI | 1.98–2.10 × 10⁻⁸ | 2.00–2.10 × 10⁻⁸ | 0.986–1.086 | 0.988–1.082 | |
| slope, no humans | 1.49 × 10⁻⁸ | 1.55 × 10⁻⁸ | 0.998 | 1.023 | |
| r2 | 0.982 | 0.976 | 0.993 | 0.996 | |
| 95% CI | 1.34–1.64 × 10⁻⁸ | 1.36–1.73 × 10⁻⁸ | 0.942–1.054 | 0.975–1.071 | |
| MCB × Ocb | slope, with humans | 2.55 × 10⁻⁹ | 9.38 × 10⁻⁹ | 0.861 | 0.889 |
| r2 | 0.997 | 0.993 | 0.926 | 0.927 | |
| 95% CI | 9.05–9.91 × 10⁻⁹ | 8.78–9.98 × 10⁻⁹ | 0.699–1.023 | 0.702–1.077 | |
| slope, no humans | 1.01 × 10⁻⁸* | n.s. | 0.866 | 0.910 | |
| r2 | 0.506 | n.s. | 0.834 | 0.910 | |
| 95% CI | 0.20–1.81 × 10⁻⁸ | n.s. | 0.592–1.140 | 0.677–1.143 | |
| MroB × OroB | slope, with humans | 1.53 × 10⁻⁸ | 1.52 × 10⁻⁸ | 1.065 | 0.977 |
| r2 | 0.997 | 0.991 | 0.975 | 0.820 | |
| 95% CI | 1.47–1.59 × 10⁻⁸ | 1.42–1.62 × 10⁻⁸ | 0.957–1.173 | 0.655–1.299 | |
| slope, no humans | 1.33 × 10⁻⁸ | 1.10 × 10⁻⁸* | 1.074 | 0.959* | |
| r2 | 0.880 | 0.786 | 0.947 | 0.778 | |
| 95% CI | 0.96–1.70 × 10⁻⁸ | 0.67–1.53 × 10⁻⁸ | 0.906–1.242 | 0.573–1.346 | |
| Mbr × Obr | slope, with humans | 1.79 × 10⁻⁸ | 1.79 × 10⁻⁸ | 1.040 | 1.040 |
| r2 | 0.999 | 0.998 | 0.997 | 0.998 | |
| 95% CI | 1.76–1.83 × 10⁻⁸ | 1.74–1.85 × 10⁻⁸ | 1.000–1.080 | 1.002–1.077 | |
| slope, no humans | 1.49 × 10⁻⁸ | 1.43 × 10⁻⁸ | 1.019 | 1.033 | |
| r2 | 0.963 | 0.929 | 0.994 | 0.997 | |
| 95% CI | 1.25–1.73 × 10⁻⁸ | 1.10–1.75 × 10⁻⁸ | 0.965–1.073 | 0.991–1.075 | |
All p values <0.0001, except (*) p < 0.01. 95% CI = 95% confidence intervals for slopes.
The cellular scaling rules that apply to RoB, however, are less clear. Although RoB mass in the expanded dataset is best explained (with the larger r2 value) as a linear function of its number of neurons, and whether independent contrasts are used or not (table 3), the power slope that relates MRoB to NRoB (see table 2 footnote for abbreviations) increases dramatically to about 1.4 (with or without humans) when phylogenetic relatedness is taken into account (table 3, right column). This suggests that rather than scaling in size linearly with its number of neurons as do the Cx and Cb, primate RoB may scale in size hypermetrically with its number of neurons, as does the rodent RoB.
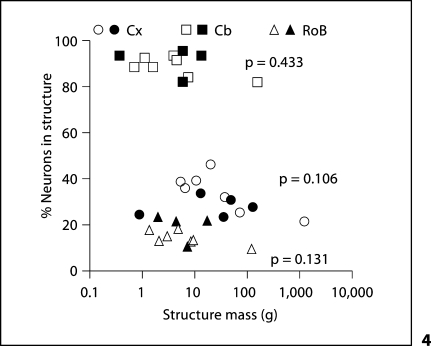
In each structure, we find that neurons represent similar percentages of all cells across species (table 1), which fail to vary with structure mass (fig. 4; Spearman correlation, all values of p > 0.1), such that the O/N ratio (number of other cells/number of neurons) for each structure is relatively constant across species, not varying significantly with structure mass (Spearman correlation, all values of p > 0.1).
Fig. 4.
The percentage of neurons in each structure does not vary significantly with structure mass in the combined dataset. Each point represents the average percentage of neurons among all cells found in the cerebral cortex (circles), cerebellum (squares) or RoB (triangles) of a species. Filled symbols = current dataset; unfilled symbols = previous datasets [Herculano-Houzel et al., 2007; Azevedo et al., 2009].
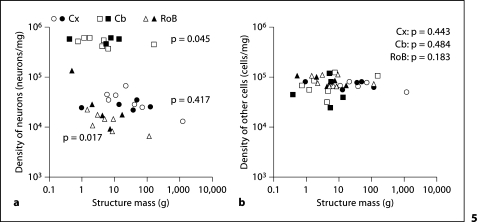
Cx and RoB neuronal densities in the combined dataset covary respectively with structure mass (Spearman correlation, p = 0.045 and p = 0.017; fig. 5a), while Cb neuronal density does not (Spearman correlation, p = 0.417). However, as in the previous dataset, the power laws relating neuronal density and structure mass in the Cx and Cb fail to reach significance (p = 0.071 and 0.296, respectively), while neuronal density in the RoB decreases significantly with increasing structure mass raised to the power of −0.428 in the combined dataset (p = 0.005), although the power relationship corrected for phylogeny fails to reach significance (slope −0.318; p = 0.064). As seen before in the smaller dataset, non-neuronal densities in the various structures do not covary with structure mass (Spearman correlation, all values of p > 0.1), and have similar values across the structures (fig. 5b).
Fig. 5.
Neuronal and non-neuronal densities do not co-vary with structure mass. Variation in density of neuronal cells (a) and other cells (b) in cerebral cortex, cerebellum and remaining areas plotted against the mass of each structure. Spearman correlation p values are indicated for each structure. The correlation between cerebral cortex and RoB neuronal densities and structure mass reach significance in the combined dataset, but are not significantly related by a power law (see text). Filled symbols = present species; unfilled symbols = previous datasets [Herculano-Houzel et al., 2007; Azevedo et al., 2009].
Relative Distribution of Mass and Cells
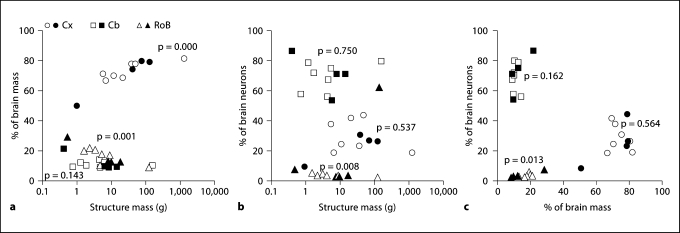
In the combined dataset, the relative mass of the Cx, expressed as the percentage of whole brain mass, increases significantly with increasing brain mass (Spearman correlation coefficient 0.911, p = 0.000), and can be expressed as a power function of brain mass with exponent 0.062 (p = 0.000), while the relative mass of the RoB decreases significantly with increasing brain mass raised to −0.233 (p = 0.001, Spearman correlation coefficient −0.818, p = 0.002) and the relative mass of the Cb fails to correlate with brain mass (Spearman correlation, p = 0.143; fig. 6a).
Fig. 6.
Relative size of the cerebral cortex and cerebellum does not reflect relative number of neurons in these structures. Each point represents the average relative mass or average relative number of neurons, compared to the whole brain, of the cerebral cortex (circles), cerebellum (squares) or RoB (triangles) of a species. Filled symbols = current dataset; unfilled symbols = previous datasets [Herculano-Houzel et al., 2007; Azevedo et al., 2009]. a Variations in relative mass (% of brain mass) of the cerebral cortex and RoB are significantly correlated to variations in the absolute mass of these structures. b The relative number of brain neurons (% brain neurons) in a structure is only significantly correlated with variations in structure mass in the RoB. c The relative number of brain neurons (% brain neurons) found in the cerebral cortex or cerebellum is not correlated with the relative mass of these structures; only the relative size of the RoB reflects significantly the relative number of neurons in the structure. Spearman correlation p values are indicated for each structure.
Larger cerebral cortices and cerebella do not hold relatively larger numbers of brain neurons (Spearman correlation, p = 0.537 and p = 0.750, respectively; fig. 6b). Similarly, relatively larger cerebral cortices and cerebella do not hold relatively larger numbers of brain neurons (Spearman correlation, p = 0.564 and 0.162, respectively; fig. 6c). In contrast, the relative number of neurons in the RoB does accompany both the absolute and the relative mass of this ensemble of structures: the relative number of RoB neurons decreases steeply with increasing absolute RoB mass, as a power function of MRoB with exponent −0.752 (p = 0.008; Spearman correlation coefficient −0.752, p = 0.008; fig. 6b) and varies linearly with relative RoB mass whether phylogenetic relationships are unaccounted for (Spearman correlation coefficient 0.715, p = 0.013; linear regression slope 0.222, r2 = 0.670, p = 0.002) or used for correction (linear regression slope 0.224, r2 = 0.604, p = 0.005; fig. 6c). Thus, only for the RoB is the relative distribution of neurons among brain structures reflected in the relative distribution of brain mass.
Brain × Body Scaling
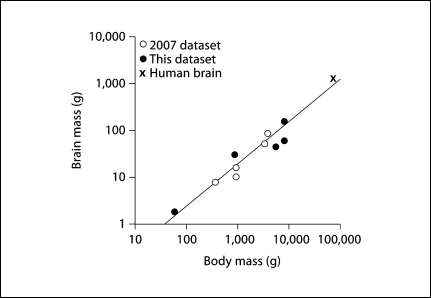
In our previous study, we found that brain size increased as a linear function of body mass, or as a power function of this variable with an exponent of 1.017 across the 6 primate species then examined [Herculano-Houzel et al., 2007]. Addition of the Saimiri body mass, missing in the original report, decreases the exponent to 0.951 ± 0.219 (p = 0.000), and further inclusion of humans to that dataset changes the exponent to 1.012 ± 0.095 (p = 0.000). In contrast, for the present 5 species, we find that whole brain mass varies as a power function of body mass with a smaller exponent of 0.788 ± 0.127 (p = 0.025), although with a very large confidence interval that includes the previous exponent of 1.017 (table 2). When all non-human primates examined are combined, we find brain mass to vary as a function of body mass raised to an exponent of 0.805 ± 0.094 (p = 0.000). Inclusion of humans in the combined dataset raises the exponent further to 0.903 ± 0.082 (p = 0.000; fig. 7), which is little affected when phylogenetic relationships are accounted for (exponent 0.924, p = 0.000). Therefore, and in contrast to the relationship between brain mass and number of neurons, which is largely insensitive to the species compared, the power law that relates brain mass to body mass is highly sensitive to the particular species included in the comparison.
Fig. 7.
Variation in brain mass and body mass across species. Each point represents the average brain and body mass of a primate species. Filled symbols = current dataset; unfilled circles = previous non-human dataset (Herculano-Houzel et al., 2007); cross = human data (Azevedo et al., 2009). The plotted function, brain mass ∼ body mass0.903, applies to the entire dataset, but the slope of the power law that best fits the relationship is highly dependent on the species compared (see Results).
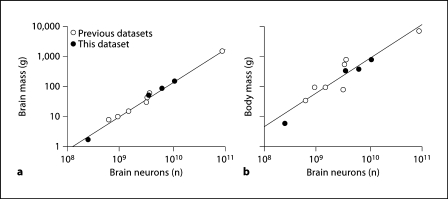
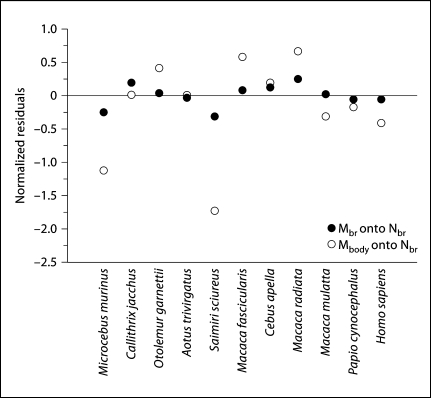
In line with the notion that body mass is more variable than brain mass for a given number of neurons in the brain of a species, we find that, in the combined dataset, brain mass is better correlated than body mass with the total number of neurons in the brain, Nbr (Spearman correlation coefficients, 1.000 and 0.900, respectively; p = 0.000). Using the power functions that relate body and brain mass to Nbr in the combined dataset (Mbr = 7.134 × 10⁻¹⁰ Nbr1.130 and Mbo = 3.088 × 10⁻⁸ Nbr1.144; slopes after correcting for phylogenetic relatedness in the dataset, 1.138 and 1.232, respectively; fig. 8a, b), a comparison of the normalized residuals of body mass and brain mass onto the total number of neurons in the brain shows larger residuals for body mass than brain mass (fig. 9), with significantly greater absolute values of normalized residuals for body mass than for brain mass (mean body mass residual, 0.511 ± 0.156; mean brain mass residual, 0.127 ± 0.032; Mann-Whitney test, p = 0.033).
Fig. 8.
Brain mass is better correlated than body mass with total number of brain neurons. Variation in brain mass (a) and body mass (b) are shown plotted against the total number of brain neurons in each species. Filled symbols = present species; unfilled symbols = previous datasets [Herculano-Houzel et al., 2007; Azevedo et al., 2009]. Power laws plotted are brain mass = 7.134 × 10⁻¹⁰ brain neurons1.130 and body mass = 3.088 × 10⁻⁸ brain neurons1.144.
Fig. 9.
Residuals of brain and body mass regressed onto total number of neurons in the brain. Each point represents the residual of the regression of brain mass (Mbr, filled symbols) or body mass (Mbody, unfilled symbols) onto the total number of neurons in the brain of each species (Nbr) using the power laws that applies to the combined primate dataset, including humans, shown in figure 8.
Discussion
Our results demonstrate that while the scaling rules that apply to the brain-body relationship are dependent on the species of primates analyzed, the cellular scaling rules that apply to the brain alone are not: we find that the same rules apply to the brains of 2 different sets of primate species, as well as to humans and to the combined dataset. They are not affected by phylogenetic relationships among species (except for RoB), and therefore might be applicable to primates in general. In comparative studies of allometric relationships, it is important to ascertain that scaling exponents are not biased by phylogenetic relatedness in the dataset, for instance if a subset of the species investigated are closely related and thus skew the relationship. We confirm that the cellular composition of the human brain conforms to the expected for a generic primate brain of its size; and also confirm that, even when accounting for phylogenetic relatedness in the dataset, primate Cx and Cb increase in size linearly as they gain neurons, instead of hyperscaling as do the rodent Cx and Cb [Herculano-Houzel et al., 2006], and maintain constant ratios between numbers of neurons and other cells, presumably mostly glia. In contrast, we find that accounting for phylogenetic relatedness in the dataset reveals that the remaining brain areas of primate brains may increase in size hypermetrically as they gain neurons, and with an exponent of around 1.4 that is closer to the exponent of 1.772 observed in rodents [Herculano-Houzel et al., 2006]. Although the mass of the RoB of insectivores, in contrast, seems to scale linearly with its numbers of neurons [Sarko et al., 2009], the equations that describe this relationship are less clearly discernible across primates, rodents and insectivores than the neuronal scaling rules that apply to the Cx and Cb. This raises the interesting possibility that the ensemble of brainstem, diencephalon and striatum, the evolutionarily oldest structures in the brain, share conserved neuronal scaling rules across the 3 mammalian orders, possibly related to conserved functions of these structures across mammals, while the more recent Cx and Cb have evolved different scaling rules in each order, possibly related, for instance, to environmental requirements and selective pressure that are particular to each group.
Brain to Body Size
We find that the exponent of the power law relating brain size to body size depends on the species compared, and can be as low as 0.788 and as high as 1.012. This suggests that there is no single universal brain-body relationship that applies to primates as a whole. Moreover, we show that when brain and body mass are regressed onto the number of neurons in the brain, the residuals of body size are systematically larger than the residuals of brain size. Since the final, adult brain size can be considered to result from the number of cells that is contains, these findings indicate that, while brain size is a tight function of its number of neurons, body size is only loosely correlated with the number of neurons in the brain. One reason that body size is neither determinant nor a good measure of the demands the body places on the brain is that the body grows considerably after brain growth is complete [Riska and Atchley, 1985]. Therefore, even though brain and body size are correlated across species, brain size is tightly related to the number of neurons in the brain but, depending on the magnitude of extended body growth in each species, body size may be only loosely correlated to the number of brain neurons. Body size, therefore, is not as good a predictor of the number of neurons in the primate brain as brain size is.
Additionally, many species of primates and other mammals are sexually dimorphic. If the body grows considerably after brain growth is largely complete, a high correlation between brain and body size would not be expected. In particular, the great apes are sexually dimorphic in body size, and studies of brain-body relations in primates that included great apes produced results that differ from those reported here, and suggested that the human brain is larger than expected from human body size [Marino, 1998]. We have yet to examine whether the primate cellular and brain-body scaling rules differ among male and female primates. However, we have argued that great apes such as gorillas and orangutans may be examples of primates with an enlarged body, rather than humans being a primate with an enlarged brain [Azevedo et al., 2009]. Such a discrepancy between brain and body growth in great apes would explain why the human brain has the number of neurons expected for a primate of its brain size, and even for its body size, when the scaling laws that apply to non-hominid primates in our sample are used. Thus, we propose that body mass no longer be used as or considered to be a good predictor of numbers of brain neurons across species. On the other hand, we show that brain (and brain structure) size may be used as a reliable predictor of total numbers of neurons once the neuronal scaling rules that apply to the pertinent mammalian order are known, such as in primates. For instance, estimated brain size of extinct hominin species may now be used to predict, with a high degree of confidence, the numbers of neurons that composed them.
Supplementary Material
Supplemental Table
Acknowledgements
Thanks to Esper Cavalheiro and Alexandre Vallota (Unifesp) for donating the Callimico brain. The Microcebus murinus brain was obtained from the Duke Lemur Center, and Papio brains were obtained from the University of Washington tissue program. This is DLC publication No. 1186.
This work was supported by FAPERJ-Jovem Cientista and CNPq-Universal (to S.H-H.) and NEI 002686 (to J.H.K.).
References
- Azevedo FA, Carvalho LR, Grinberg LT, Farfel JM, Ferretti RE, Leite RE, Jacob Filho W, Lent R, Herculano-Houzel S. Equal numbers of neuronal and nonneuronal cells make the human brain an isometrically scaled-up primate brain. J Comp Neurol. 2009;513:532–541. doi: 10.1002/cne.21974. [DOI] [PubMed] [Google Scholar]
- Barton RA, Harvey PH. Mosaic evolution of brain structure in mammals. Nature. 2000;411:189–193. doi: 10.1038/35016580. [DOI] [PubMed] [Google Scholar]
- Barton RA. How did brains evolve? Nature. 2002;415:134–135. doi: 10.1038/415134a. [DOI] [PubMed] [Google Scholar]
- Burish MJ, Peebles JK, Baldwin MK, Tavares L, Kaas JH, Herculano-Houzel S. Cellular scaling rules for primate spinal cords. Brain Behav Evol. 2010;76:45–59. doi: 10.1159/000319019. [DOI] [PMC free article] [PubMed] [Google Scholar]
- Clark DA, Mitra PP, Wang SS. Scalable architecture in mammalian brains. Nature. 2001;411:189–193. doi: 10.1038/35075564. [DOI] [PubMed] [Google Scholar]
- De Winter W, Oxnard CE. Evolutionary radiations and convergences in the structural organization of mammalian brains. Nature. 2001;409:710–714. doi: 10.1038/35055547. [DOI] [PubMed] [Google Scholar]
- Felsenstein J. Phylogenies and the comparative method. Am Nat. 1985;125:1–15. [Google Scholar]
- Finlay BL, Darlington RB. Linked regularities in the development and evolution of mammalian brains. Science. 1995;268:1578–1584. doi: 10.1126/science.7777856. [DOI] [PubMed] [Google Scholar]
- Fox JH, Wilczynski W. Allometry of major CNS divisions: towards a reevaluation of somatic brain-body scaling. Brain Behav Evol. 1986;28:157–169. doi: 10.1159/000118700. [DOI] [PubMed] [Google Scholar]
- Frahm HD, Stephan H, Stephan M. Comparison of brain structure volumes in Insectivora and Primates. I. Neocortex. J Hirnforsch. 1982;23:375–389. [PubMed] [Google Scholar]
- Haug H. Brain sizes, surfaces, and neuronal sizes of the cortex cerebri: a stereological investigation of man and his variability and a comparison with some mammals (primates, whales, marsupials, insectivores, and one elephant) Am J Anat. 1987;180:126–142. doi: 10.1002/aja.1001800203. [DOI] [PubMed] [Google Scholar]
- Herculano-Houzel S, Lent R. Isotropic fractionator: a simple, rapid method for the quantification of total cell and neuron numbers in the brain. J Neurosci. 2005;25:2518–2521. doi: 10.1523/JNEUROSCI.4526-04.2005. [DOI] [PMC free article] [PubMed] [Google Scholar]
- Herculano-Houzel S, Mota B, Lent R. Cellular scaling rules for rodent brains. Proc Natl Acad Sci USA. 2006;103:12138–12143. doi: 10.1073/pnas.0604911103. [DOI] [PMC free article] [PubMed] [Google Scholar]
- Herculano-Houzel S, Collins CE, Wong P, Kaas JH. Cellular scaling rules for primate brains. Proc Natl Acad Sci USA. 2007;104:3562–3567. doi: 10.1073/pnas.0611396104. [DOI] [PMC free article] [PubMed] [Google Scholar]
- Jerison HJ. Evolution of the Brain and Intelligence. New York: Academic Press; 1973. [Google Scholar]
- Maddison WP, Maddison DR (2005): Mesquite: a modular system for evolutionary analysis. Version 2.7. http://mesquiteproject.org
- Marino L. A comparison of encephalization between odontocete cetaceans and anthropoid primates. Am J Phys Anthropol. 1998;97:339–356. doi: 10.1159/000006540. [DOI] [PubMed] [Google Scholar]
- Marino L. Absolute brain size: did we throw the baby out with the bathwater? Proc Natl Acad Sci USA. 2006;103:13563–13564. doi: 10.1073/pnas.0606337103. [DOI] [PMC free article] [PubMed] [Google Scholar]
- Martin RD. Relative brain size and basal metabolic rate in terrestrial vertebrates. Nature. 1981;293:57–60. doi: 10.1038/293057a0. [DOI] [PubMed] [Google Scholar]
- Murphy WJ, Elzirik E, Johnson WE, Zhang YP, Ryder OA, O'Brien SJ. Molecular phylogenetics and the origins of placental mammals. Nature. 2001;409:614–618. doi: 10.1038/35054550. [DOI] [PubMed] [Google Scholar]
- Pagel MD. A method for the analysis of comparative data. J Theor Biol. 1992;156:431–442. [Google Scholar]
- Purvis A. A composite estimate of primate phylogeny. Philos Trans R Soc Lond B Biol Sci. 1995;348:405–421. doi: 10.1098/rstb.1995.0078. [DOI] [PubMed] [Google Scholar]
- Riska B, Atchley WR. Genetics of growth predict patterns of brain-size evolution. Science. 1985;229:668–671. doi: 10.1126/science.229.4714.668. [DOI] [PubMed] [Google Scholar]
- Sarko DK, Catania KC, Leitch DB, Kaas JH, Herculano-Houzel S. Cellular scaling rules of insectivore brains. Front Neuroanat. 2009;3:8. doi: 10.3389/neuro.05.008.2009. [DOI] [PMC free article] [PubMed] [Google Scholar]
- Stephan H, Frahm H, Baron G. New and revised data on volumes of brain structures in insectivores and primates. Folia Primatol. 1981;35:1–29. doi: 10.1159/000155963. [DOI] [PubMed] [Google Scholar]
- Stolzenburg JU, Reichenbach A, Neumann M. Size and density of glial and neuronal cells within the cerebral neocortex of various insectivorian species. Glia. 1989;2:78–84. doi: 10.1002/glia.440020203. [DOI] [PubMed] [Google Scholar]
- Sultan F. Analysis of mammalian brain architecture. Nature. 2002;415:133–134. doi: 10.1038/415133b. [DOI] [PubMed] [Google Scholar]
- Tower DB, Elliot KAC. Activity of acetylcholine system in cerebral cortex of various unanesthetized mammals. Am J Physiol. 1952;168:747–759. doi: 10.1152/ajplegacy.1952.168.3.747. [DOI] [PubMed] [Google Scholar]
Associated Data
This section collects any data citations, data availability statements, or supplementary materials included in this article.
Supplementary Materials
Supplemental Table


