

Abstract
Focal segmental glomerulosclerosis (FSGS) is a pattern of kidney injury observed either as an idiopathic finding or as a consequence of underlying systemic conditions. Several genes have been identified which, when mutated, lead to inherited FSGS and/or the nephrotic syndrome. These findings have accelerated the understanding of glomerular podocyte function and disease, motivating our search for additional FSGS genes. Using linkage analysis, we identified a locus for autosomal dominant FSGS on a region of chromosome 14q. By sequencing multiple genes in this region, we detected nine independent non-conservative missense mutations in INF2, which encodes a member of the formin family of actin regulating proteins. These mutations, all within the diaphanous inhibitory domain, segregate with disease in 11 unrelated families and alter highly conserved amino acid residues. The observation that mutations in this podocyte-expressed formin cause FSGS highlights the importance of fine regulation of actin polymerization in podocyte function.
We genotyped members of a large family with apparent autosomal dominant FSGS using a dense set of SNP markers (Affymetrix 250K SNPChip array) followed by focused microsatellite genotyping. We identified a locus for FSGS in this family on 14q32 (family FGJN, Figure 1 and Supplementary Figure 2). This region overlapped with a larger locus that we previously identified by linkage analysis in another large family with a similar clinical course (family FGBR, Figure 1 and Supplementary Figure 2). We suspected that FSGS in both families was caused by a defect in the same gene. Under this assumption, the critical region was defined by flanking SNPs rs3783397 (at approximately 103 Mb on the Marshfield map) and rs6576201 (at approximately 106 Mb).
Figure 1. Pedigrees.

Pedigree diagrams of families FGBR and FGJN. Pedigree identifier and the specific mutations segregating in each family are shown.
We used public databases to identify genes in this region. We sequenced 15 genes in affected members of the FGBR and FGJN families. We found a sequence variant in each family within the same exon of INF2 that segregated with disease and predicted a non-conservative amino-acid change (R218Q in FGJN and S186P in FGBR). We observed no significant sequence variants in the other genes analyzed. The R218Q variant found in family FGJN was a de novo mutation, as the first individual in the family carrying this R218Q variant shared the disease associated haplotype, but not this variant, with several unaffected siblings (not shown).
We then sequenced INF2 in 91 unrelated individuals with familial FSGS. In probands from nine additional families, we identified point mutations leading to non-conservative amino acid changes (Table 1, Figure 2a, and Supplementary Figure 3). We typed these variants in available family members. We considered a family member to be affected if he/she had biopsy-proven FSGS, ESRD without other apparent cause, or significant albuminuria without other apparent cause (> 250 mg albumin per gram creatinine). We found that these mutations segregated with disease in their respective families (Figure 1 and Supplementary Figure 2). In five families, some younger individuals carrying these point mutations had no increase in urine protein, consistent with reduced, age-related penetrance, similar to the phenotypes associated with TRPC6 and ACTN4 mutations1–3. We found nucleotide variants in exons 8, 18, and 20, but these did not segregate with disease and were found in control individuals. All of the disease segregating mutations are located within the region of INF2 known as the diaphanous-inhibitory domain, or DID (Figure 2b), and most reside within exon 44.
TABLE 1.
| Family | Ethnicity (Geography) | Mutation | Age range at diagnosis (n = number of affecteds) |
Age range at ESRD onset (n = number with ESRD) |
|---|---|---|---|---|
| FGBR | Caucasian (Canada) | S186P | 12–67 (n=19) | 32–67 (n=6) |
| FGDM | Caucasian (Ireland/USA) | L198R | 13–18 (n=2) | 21–29 (n=2) |
| FGEA | African-American (USA) | R218W | 27–33 (n=3) | 30–40 (n=2) |
| FGEF | Caucasian (USA) | R214H | 19–35 (n=5) | 49 (n=1) |
| FGEP | Caucasian (USA) | L42P | 11–13 (n=3) | 13–14 (n=3) |
| FGER | Caucasian (Canada) | S186P | 13–60 (n=9) | 20–50 (n=6) |
| FGFG | Caucasian (USA) | R214H | 12–72 (n=7) | 17–60 (n=3) |
| FGGN | Latino (Mexico) | A13T | 21 (n=1) | n=0 |
| FGGY | African-American (USA) | E184K | 17–30 (n=8) | 17–30 (n=7) |
| FGJN | Caucasian (USA) | R218Q | 22–45 (n=10) | 30–45 (n=4) |
| FSB | Caucasian (USA) | E220K | 13–21 (n=5) | 23–30 (n=4) |
Figure 2. INF2 mutations.

a. Disease-segregating INF2 mutations shown aligned with wild-type INF2 protein sequence from humans, chimpanzee, mouse, rat, opossum, and zebrafish. All of these disease mutations occur in evolutionarily conserved residues within the DID.
b. Schematic showing INF2 protein domain structure and location of mutations.
c, d, and e: Model of mouse INF2 amino acids 1–330, based on the structure of mDia1 (1). Mutated residues are shown in red, and residues important for the interaction with DAD are shown in blue.
c. View of mDia1 showing the positions of A13 and R218 (red). Residues important for the direct interaction with DAD are shown in blue, including R106 (corresponding to K213 in mDia1), N110 (corresponding to N217 in mDia1), A149 (corresponding to A256 in mDia1), and I152 (corresponding to I259 in mDia1). Based on the crystal structure of the mDia1 DID/DAD complex (reference 22), the alpha helical INF2 DAD is predicted to lie in the pocket containing these residues, with its N-terminus (D974) contacting R106 and N110, and L986 contacting A149 and I152. In this model, we predict that R218 would contact residues C-terminal to L986.
d. Close-up of the portion of the INF2 region predicted to interact with the DAD.
e. 180 degree rotation of the structure shown in F1, showing L42, S186, and E220.
To be certain that these variants were not polymorphisms, and to be certain that the INF2 gene is not a site of frequent but biologically insignificant variation, we resequenced exon 4, the location of all but two of the putative mutations, in 282 control individuals. None of these individuals carried any of these putative disease-causing INF2 variants, nor any other missense or splicing variation. We genotyped the two putative disease-causing mutations found in exon 2 (A13T, L42P) as well as the E184K and R218Q mutations in an additional 341 control individuals using Sequenom assays. Neither variant was present in any of the 682 chromosomes assayed.
The phenotype in families with INF2 mutations shares certain features. Unlike the early onset, nephrotic presentation seen with mutations in the slit-diaphragm proteins nephrin and podocin, these individuals presented in early adolescence or adulthood, typically with moderate proteinuria. While we documented nephrotic range proteinuria in members of several of these families, none of the affected individuals displayed the spectrum of clinical findings that constitutes the so-called nephrotic syndrome. Microscopic hematuria and hypertension were noted in some affected individuals. Similar to patients with mutations in ACTN4, disease and proteinuria were progressive, often leading to end-stage renal disease (ESRD).
We reviewed available renal biopsy tissue samples from individuals with INF2 mutations. Light microscopy typically showed FSGS (Figure 3a). In these biopsies, electron microscopy showed focal areas of podocyte foot process effacement, typical of secondary and some genetic forms of FSGS, as well as areas where foot processes and slit-diaphragms were well preserved. We also noted unusually prominent actin bundles within the foot processes (Figure 3b). Glomerular hypertrophy was not a prominent feature of the biopsies. Neither we nor the original pathology reports noted perihilar, collapsing, or cellular lesions that characterize some subtypes of FSGS. Thus, these biopsies would be categorized as “FSGS, not-otherwise-specified” following one widely adopted classification scheme5.
Figure 3. Histopathology.
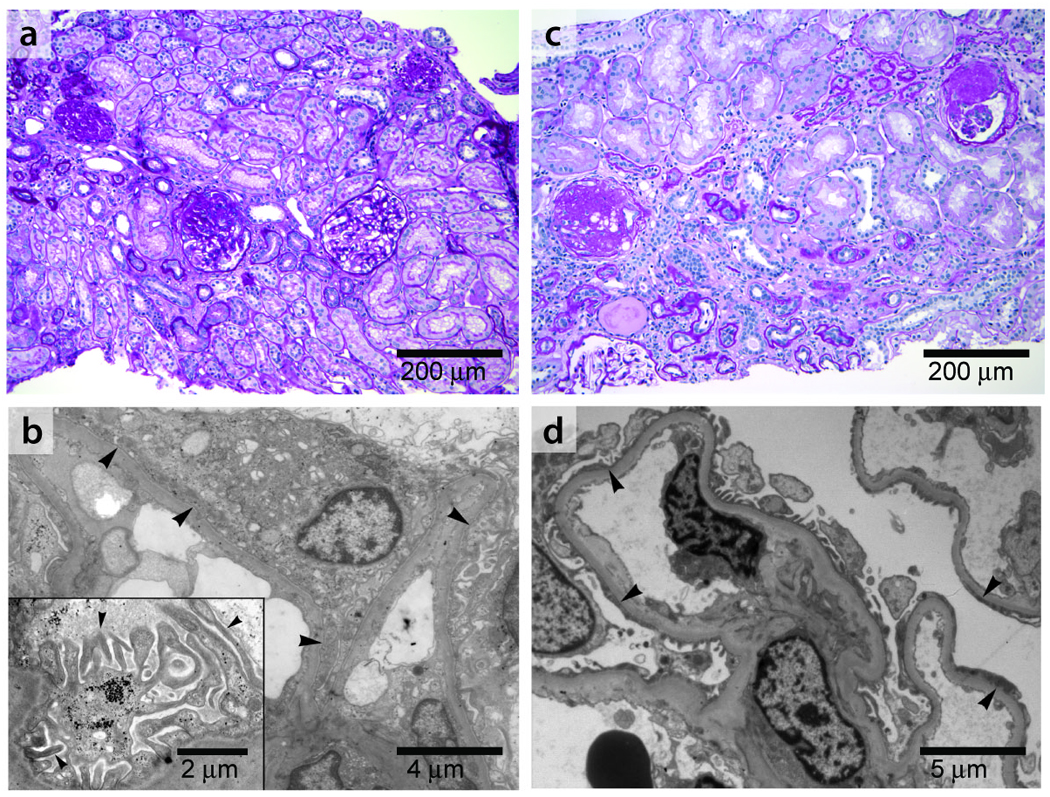
a, b: Kidney biopsy findings in an affected member of family FSB with an E220K INF2 mutation. This patient was 21 years of age at the time of biopsy with an estimated glomerular filtration rate (GFR) of 96 ml/min/1.73m2. She had 3+ urine protein and no hematuria. She developed ESRD seven years after the biopsy was performed. a. Light micrograph (PAS) showing focal global and segmental glomerulosclerosis. b. Electron micrograph showing segmental foot process effacement in some loops (arrowheads) and focally irregular morphology of preserved foot processes. Inset: Higher magnification electron micrograph showing foot processes en face, projecting from a major process. The foot processes appear irregular and jagged, often with prominent longitudinal actin bundles. c, d: Kidney biopsy findings from a different INF2 mutant patient with an R218Q mutation, from family FGJN. This patient was 26 years old at the time of biopsy. Estimated GFR was 46 ml/min/1.73m2 and urine showed 3+ protein and trace blood at the time. c: Light micrograph (PAS) showing focal and segmental glomerulosclerosis, with moderate chronic parenchymal damage. d: Electron micrograph showing segmental foot process effacement (arrowheads).
We examined the expression of INF2 in the kidney by in situ hybridization and by antibody staining (Figure 4a,b). Both showed INF2 expression in the podocyte. We examined expression of INF2 and the slit-diaphragm protein nephrin together (Figure 4b). INF2 expression showed areas of colocalization with nephrin in podocytes. Some INF2 staining was also noted in a pericapillary pattern, suggesting expression in cells other than podocytes. Within the podocyte, antibody staining showed what appeared to be a predominantly perinuclear pattern of INF2. Northern blot analysis showed INF2 expression in all tissues tested and identified INF2 transcripts of approximately 1.5 and 4.5 kb in length (Figure 4c). This was consistent with previous reports describing INF2 as well as the major transcripts predicted from ESTs and genomic sequence analysis as collated in the UCSC Genome Browser (http://genome.ucsc.edu/)4,6,7.
Figure 4. INF2 expression.
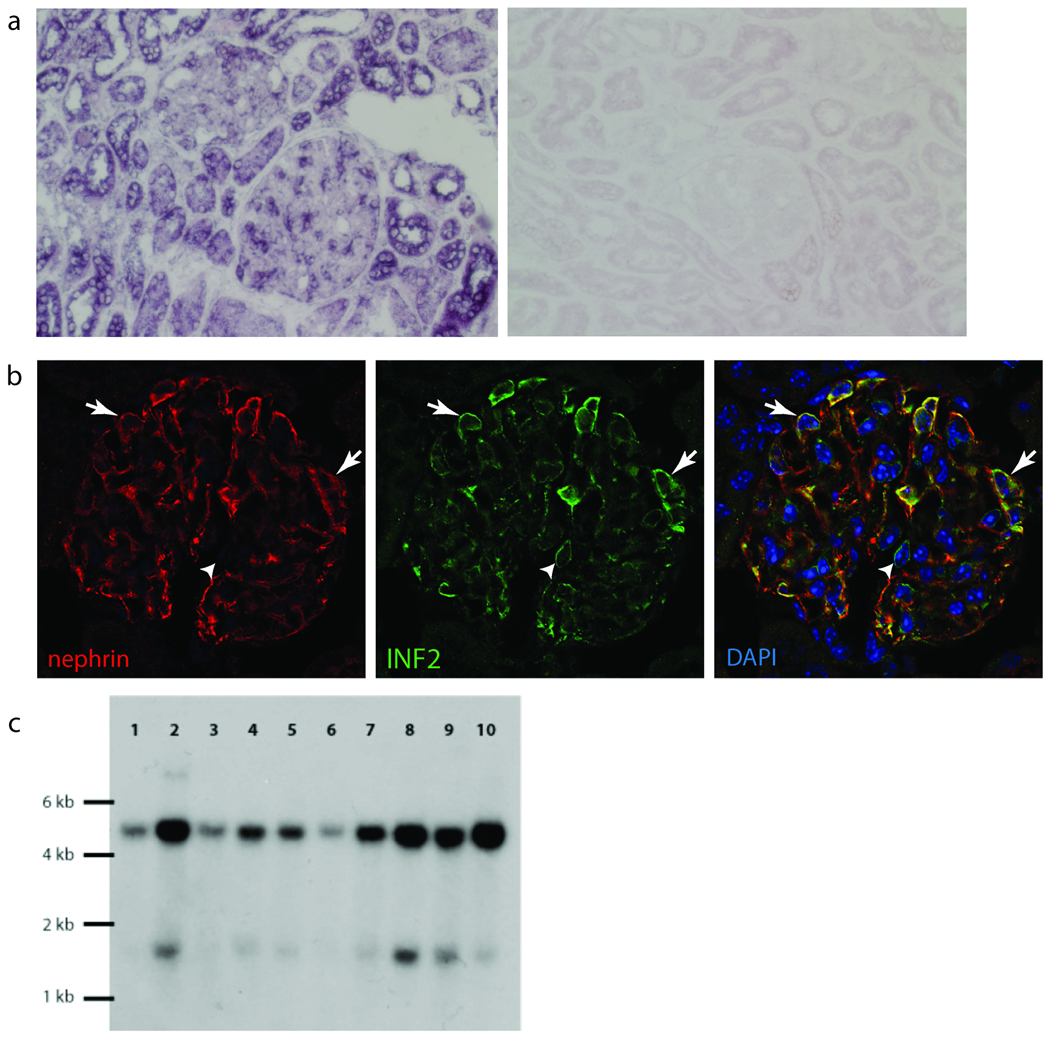
a. RNA in situ hybridization in adult human kidney with digoxigenin-labeled probe targeted against INF2 mRNA, followed by immunohistochemical staining with labeled antibody to digoxigenin. INF2 mRNA expression is apparent in podocytes as well as some tubule cells. Sense control experiment is shown on the right. b. Immunofluoresence staining of mouse kidney with DAPI (blue) and antibodies against nephrin (red) and INF2 (green). INF2 staining is observed in the glomeruli in an epithelial cell pattern. Arrows show areas of nephrin and INF2 colocalization. Arrowhead shows a cell expressing INF2 but not nephrin. d. Northern blot. Gel lanes: 1, Brain; 2, Placenta; 3, Skeletal muscle; 4, Heart; 5, Kidney; 6, Pancreas; 7, Liver; 8, Lung; 9, Spleen; 10, Colon.
INF2 is a member of the formin family of actin-regulating proteins that accelerate actin polymerization8. All of the FSGS-associated mutations we identified lie within the DID. The DID is an autoinhibitory domain found in the diaphanous formins. In the best studied diaphanous formin, mDia1, the interaction of the N-terminal DID with the C-terminal diaphanous activating domain (DAD) inhibits mDia1 function; this inhibition is relieved by binding to Rho 9. We used structural data available for the N-terminal region of mDia1 to map the mutated INF2 residues and make functional predictions. Our INF2 model derived from the mDia1-RhoC structure (Figure 2 c,d,e) was in agreement with models derived from the other available mDia1 structures (not shown)10. Two mutated residues, R214 and R218, lie close to the DAD-binding region of the DID. R214 is on the surface of the DID in proximity to this site (Figure 2c). R218 is predominately buried but has a small region of surface exposure in this region (Figure 2d). Three other mutated residues (L42, S186, E220) are surface-exposed but on the opposite side of the DID structure from the DAD-binding region (Figure 2e). The A13 position is surface-exposed and lies at the N-terminus of the DID, in the region corresponding to the GTPase binding domain of mDia1. Two of the mutated residues are buried in the core DID structure (E184, L198).
Based on these models, we can postulate potential functions for the mutated INF2 residues. R214 and R218 likely form part of the DAD binding site, given their spatial proximity to key DAD-binding residues A149 and I152. The prominent exposure of L42, S186, and E220 on the DID surface raises the possibility that they interact with other molecules. Since the N-terminus of mDia1 plays a major role in its cellular localization11, the N-terminus of INF2 could also mediate localization. We postulate that E184, L198, and R218 are likely to be important for maintaining the overall fold of the DID. These residues are buried in the interior in all of our models and the identified mutations (E184K and L198R, R218Q) could have effects on the integrity of the DID.
We inserted two mutations (E184K and R218Q) predicted to have large effects on the structural integrity of the DID into the INF2 cDNA. We also inserted a third mutation located away from the DAD binding site (S186P) into the cDNA. These three mutations included the two (E186P and R218Q) found in the large families used in the initial genetic linkage analysis. We examined cultured podocytes transfected with wild-type or mutant INF2 (E184K, S186P, and R218Q, Figure 5). Wild-type transfected podocytes showed perinuclear INF2 staining, while INF2 harboring E184K and R218Q mutations showed a different localization pattern, with a finer, more diffuse distribution. The cellular localization of the S186P mutant INF2 was closer to the pattern observed in the wild-type cells but with a more vermiform appearance. Both the wild-type and mutant forms of INF2 showed significant costaining with phalloidin, consistent with the notion that these proteins induced actin polymerization at their localization, with the overall staining of phalloidin mimicking that of INF2. In the mutant transfected cells, stress fibers and cortical actin were less prominent. The similar and more dramatic changes seen with the E184K and R218Q mutants are consistent with the predicted effect on the overall INF2 DID structure. Furthermore, these data suggest that the DID domain is critical for the subcellular localization of INF2, and is consistent with data demonstrating that it is not required for the ability of INF2 to mediate actin polymerization7. While these mutant forms of INF2 clearly behave differently than the wild-type, the relationship between this altered behavior and the disease mechanism remains to be clarified.
Figure 5. Expression of INF2 variants.
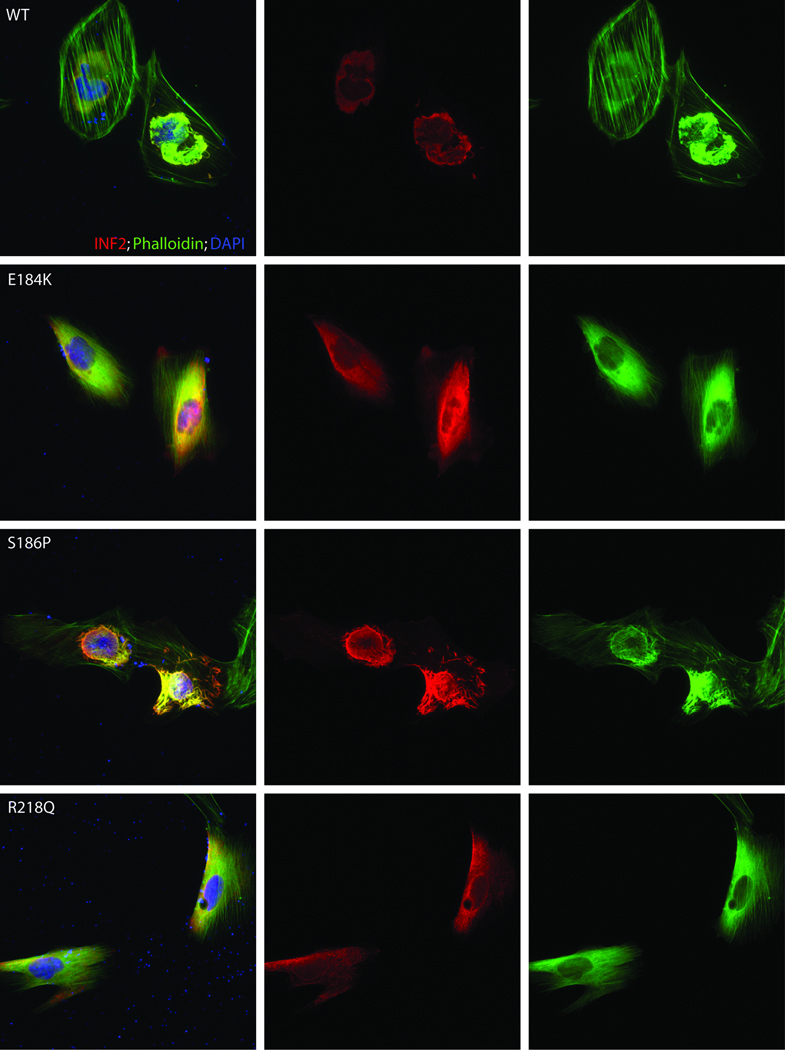
Localization of INF2 variants in undifferentiated cultured human podocytes. Cells were cultured on coverslips coated with type I collagen. INF2 is visualized using a Cy3 conjugated antibody against its C-terminus 7. FITC phalloidin was used to stain F-actin, and nuclei are stained with DAPI. First column: cells expressing wild-type and three different mutant forms of INF2. Second column: INF2 channel. Third column: Phalloidin. Rows: results for WT and three mutant forms of INF2: E184K, S186P, and R218Q. E184K and R218Q mutants show diffuse localization of INF2 and F-actin compared with the perinuclear INF2 staining seen with the WT expressing cells. The S186P looked similar to WT expressing cells, but INF2 expression was more vermiform in appearance. In all three mutants, stress fibers and cortical actin appeared to be less prominent.
The cumulative evidence we have presented demonstrates that mutations in the INF2 gene cause an autosomal dominant form of FSGS. In two large families, we found evidence of genetic linkage to a region on chromosome 14 containing INF2. We identified missense mutations in INF2 in 11 of 93 families examined. These mutations cause non-conservative substitutions in amino acids that are highly conserved through evolution. Within the individual families harboring these mutations, inheritance of the mutation segregates with disease. Seven of the nine distinct mutations occur in close proximity within exon 4, and all nine lie within the diaphanous inhibitory domain. By resequencing, we verified that neither these mutations, nor other non-synonymous DID variants, are present in control groups. INF2 is highly expressed in the kidney including in glomerular podocytes, the cell type thought to initiate most forms of FSGS. Electron microscopy of kidney biopsy material from an INF2-mutant FSGS patient showed irregular podocyte foot process morphology and prominent actin bundles. In addition, transfection studies of overexpressed wild-type and FSGS-associated mutant forms of INF2 indicate differences in the subcellular localization of mutant and wild-type protein, as well as differences in the pattern of distribution of the associated F-actin. In the electron micrographs, prominent actin filament bundles are noted, whereas actin filaments appear somewhat less prominent than normal in the INF2-mutant expressing cells. The precise mechanism by which actin behavior is disrupted in the presence of INF2 mutations in vivo remains to be defined.
Formins are a family of proteins that accelerate actin filament assembly12. INF2 has the unique ability to accelerate both polymerization as well as depolymerization of actin in vitro, and localizes to the endoplasmic reticulum in fibroblasts. All of the disease-causing INF2 mutations we identified are located within the N-terminal regulatory portion containing the DID7. The DID binds the DAD region of INF2 and autoinhibits INF2-mediated actin depolymerization but not actin polymerization7. Previously published work shows that expression of an INF2 mutant in which the DID/DAD interaction is blocked causes actin filament accumulation around the ER and collapse of the ER onto the nuclear membrane7. Here, we find that mutations in the DID predicted to severely affect the domain structure (E184K, R218Q) do not appear to prevent INF2 mediated actin filament accumulation, but do alter INF2 and F-actin localization.
Podocytes are complex, actin-rich, interdigitating structures that must be able to react to a unique set of physical and chemical stresses. Dysregulation of the podocyte cytoskeleton is a common feature of glomerular disease states13. The proximal trigger leading to altered actin behavior in podocytes can derive from external signals (e.g. from the slit-diaphragm14) or internally (as seen in α-actinin-4 mutations1). Similar to what has been observed with α-actinin-4, INF2 is a widely expressed actin-binding protein which when mutated causes a podocyte-limited phenotype. Our results support a model of podocytes as dynamic structures that are extremely sensitive to alterations in the spatial or temporal regulation of the actin cytoskeleton. We hypothesize that individuals harboring disease-associated INF2 mutations have a defect in actin-mediated podocyte structural maintenance and repair. Future studies aimed at defining how INF2 mutations lead to disease will contribute to our understanding of podocyte biology and FSGS as well as our understanding of the common forms of kidney disease characterized by podocyte dysfunction.
METHODS
Clinical ascertainment
Subjects were enrolled in these studies after obtaining informed consent in accordance with a human subjects protocol approved by the Brigham and Women’s Hospital. We extracted DNA from peripheral blood, measured urine microalbumin and creatinine concentrations, and obtained clinical and family history information. We reviewed medical records, kidney biopsies, and biopsy reports when available.
Genotyping
In family FGBR, we performed a genome-wide analysis using DNA samples from 31 informative family members and approximately 300 microsatellite markers from the Marshfield map using standard methodology. We computed parametric 2-point and multipoint lod scores using the FASTLINK and VITESSE programs15,16. In family FGJN, we performed genome-wide linkage analysis using 250K Affymetrix SNPChips, follow-up genotyping using 14q microsatellite markers, and performed parametric multipoint linkage analysis using both LINKAGE and GENEHUNTER17. Additional genotyping of the identified variants was performed using MALDI-TOF mass spectrometry (Sequenom) at the Harvard-Partners Core Genotyping Facility.
Sequencing
Using standard Sanger sequencing methodology on an ABI 3730 machine, we sequenced PCR-amplified segments containing coding sequence and flanking splice sites of 15 genes (INF2, ADSSL1, SIVA1, AKT1, PLD4, AHNAK2, CDCA4, GPR132, JAG2, NUDT14, BRF1, PACS2, MTA1, CRIP2, CRIP1) from the 14q critical region in 12 individuals, 3 affected and 3 unaffected members from family FGBR and from family FGJN, followed by additional sequencing of INF2 in family members and control individuals. (Sequencing primers are available on request.)
Structural model
We designed structural models of INF2 using the Phyre resource from Imperial College, London 18. We submitted amino acids 1–424 of mouse INF2, and recovered INF2 models based on the structural coordinates of three mDia1 N-terminal structures10,19,20. (The fourth mDia1 N-terminal structure 21 was not represented in this search.) We manipulated the models using the program PyMOL. In the model, the identified FSGS mutations correspond to residues in mDia1 in the structural alignment (see Supplementary Table).
INF2 mutagenesis
We obtained a clone containing full-length INF2 in the pCMV6-XL5 vector (Origene). Mutagenesis was carried out using the Stratagene QuikChange II kit and mutagenesis primers designed to create the E184K, S186P, and R218Q variants. All mutagenesis reactions were verified by sequencing.
INF2 expression
Northern blot
A human multiple tissue Northern blot was purchased from Ambion. 5´ sense and antisense probes consisting of the first 590 basepairs of INF2 were made using α32P-dCTP labeling of a PCR generated fragment using Klenow (New England Biolabs NEBlot kit).
In situ hybridization
Non-radioactive in situ hybridization was performed as described22, using a digoxigenin (DIG)-labeled cRNA probe that contained the first 590 bases of the INF2 sequence. Frozen sections (10µm) of human kidney tissue were cut in a cryostat and captured onto Superfrost plus microscope slides (Fisher Scientific, Pittsburgh, PA). Sections were then fixed and acetylated, and hybridized to the probe at 70°C for approximately 72 hrs (approximate concentration 100 ng/ml). Hybridized probe was visualized using alkaline phosphatase-conjugated anti-DIG Fab fragments (Roche, Indianapolis, IN) and 5-Bromo-4-chloro-3-indolyl-phosphate/Nitroblue tetrazolium (BCIP/NBT) substrate (Kierkegard and Perry Laboratories, Gaithersburg, MD). Sections were rinsed several times in 100 mM Tris, 150 mM NaCl, 20 mM EDTA pH 9.5, and coverslipped with glycerol gelatin (Sigma, St. Louis, MO). Control sections were incubated in an identical concentration of the sense probe transcript.
Microscopy studies
Cultured cells
Undifferentiated human podocytes in culture (gift of Moin Saleem) were transfected with wild-type or mutant INF2 constructs using FuGENE (Roche). We used antibody to the C-terminus of INF2 directly conjugated to Cy3 for visualizing wild-type and mutant INF2 protein at 1:200 dilution 7. We used FITC Phalloidin and DAPI to visualize actin filaments and nuclei.
Kidney sections
We made 5 micron sections of acetone fixed kidneys from healthy 6 week old mice. After washing with phosphate-buffered saline, we incubated sections with primary antibodies: rabbit anti-INF2 (C-terminal 300 amino acids)7, guinea pig anti-nephrin (Progen Biotechnik). We used anti-rabbit Cy2 coupled and anti-guinea pig Cy3 coupled secondary antibodies to visualize INF2 and nephrin and DAPI to visualize nuclei. We analyzed specimens using a Nikon TE-200E inverted microscope and AutoDeblur deconvolution software (Media Cybernetics).
Supplementary Material
ACKNOWLEDGEMENTS
We thank the many individuals who participated in this study. We thank Steve DePalma for help with linkage analysis. We thank Drs. J. Jacobs, K.Tucker, J. Holt, A. Acharya, R.Wiggins, R.Weir, J. Levine and many others for help with family ascertainment. This work was support by grants from the National Institutes of Health (DK54931 to M.R.P., DK073091 to J.M.H., DK080947 to J.S.S., and GM069818 to H.N.H.), and the Clinical Investigator Training Program: Beth Israel Deaconess Medical Center Harvard/MIT Health Sciences and Technology in collaboration with Pfizer Inc. and Merck & Co., the NephCure Foundation, and the Cole Pasqualucci Nephrotic Syndrome and FSGS Research fund (to E.J.B.). M.R.P. is an Established Investigator of the American Heart Association.
Footnotes
The authors declare that they have no competing financial interests.
AUTHOR CONTRIBUTIONS
E.B. performed family and clinical ascertainment, performed and interpreted genetic linkage studies, performed mutational analysis and made DNA constructs. J.S.S. helped with study design and interpretation and performed INF2 expression studies. D.J.B. performed INF2 expression studies. H.T. performed genetic linkage studies. A.L.U. helped with clinical ascertainment of the families. H.N.H. performed molecular modeling and assisted with data interpretation. J.M.H. performed histology studies. M.R.P. oversaw all aspects of study design and interpretation and wrote the manuscript with the assistance of the other authors.
REFERENCES
- 1.Kaplan JM, et al. Mutations in ACTN4, encoding alpha-actinin-4, cause familial focal segmental glomerulosclerosis. Nat Genet. 2000;24:251–256. doi: 10.1038/73456. [DOI] [PubMed] [Google Scholar]
- 2.Winn MP, et al. A mutation in the TRPC6 cation channel causes familial focal segmental glomerulosclerosis. Science. 2005;308:1801–1804. doi: 10.1126/science.1106215. [DOI] [PubMed] [Google Scholar]
- 3.Reiser J, et al. TRPC6 is a glomerular slit diaphragm-associated channel required for normal renal function. Nat Genet. 2005;37:739–744. doi: 10.1038/ng1592. [DOI] [PMC free article] [PubMed] [Google Scholar]
- 4.Chhabra ES, Higgs HN. INF2 Is a WASP homology 2 motif-containing formin that severs actin filaments and accelerates both polymerization and depolymerization. J Biol Chem. 2006;281:26754–26767. doi: 10.1074/jbc.M604666200. [DOI] [PubMed] [Google Scholar]
- 5.D'Agati VD, Fogo AB, Bruijn JA, Jennette JC. Pathologic classification of focal segmental glomerulosclerosis: a working proposal. Am J Kidney Dis. 2004;43:368–382. doi: 10.1053/j.ajkd.2003.10.024. [DOI] [PubMed] [Google Scholar]
- 6.Kent WJ, et al. The human genome browser at UCSC. Genome Res. 2002;12:996–1006. doi: 10.1101/gr.229102. [DOI] [PMC free article] [PubMed] [Google Scholar]
- 7.Chhabra ES, Ramabhadran V, Gerber SA, Higgs HN. INF2 is an endoplasmic reticulum-associated formin protein. J Cell Sci. 2009;122:1430–1440. doi: 10.1242/jcs.040691. [DOI] [PMC free article] [PubMed] [Google Scholar]
- 8.Faix J, Grosse R. Staying in shape with formins. Dev Cell. 2006;10:693–706. doi: 10.1016/j.devcel.2006.05.001. [DOI] [PubMed] [Google Scholar]
- 9.Li F, Higgs HN. The mouse Formin mDia1 is a potent actin nucleation factor regulated by autoinhibition. Curr Biol. 2003;13:1335–1340. doi: 10.1016/s0960-9822(03)00540-2. [DOI] [PubMed] [Google Scholar]
- 10.Rose R, et al. Structural and mechanistic insights into the interaction between Rho and mammalian Dia. Nature. 2005;435:513–518. doi: 10.1038/nature03604. [DOI] [PubMed] [Google Scholar]
- 11.Seth A, Otomo C, Rosen MK. Autoinhibition regulates cellular localization and actin assembly activity of the diaphanous-related formins FRLalpha and mDia1. J Cell Biol. 2006;174:701–713. doi: 10.1083/jcb.200605006. [DOI] [PMC free article] [PubMed] [Google Scholar]
- 12.Higgs HN. Formin proteins: a domain-based approach. Trends Biochem Sci. 2005;30:342–353. doi: 10.1016/j.tibs.2005.04.014. [DOI] [PubMed] [Google Scholar]
- 13.Faul C, Asanuma K, Yanagida-Asanuma E, Kim K, Mundel P. Actin up: regulation of podocyte structure and function by components of the actin cytoskeleton. Trends Cell Biol. 2007;17:428–437. doi: 10.1016/j.tcb.2007.06.006. [DOI] [PubMed] [Google Scholar]
- 14.Huber TB, Benzing T. The slit diaphragm: a signaling platform to regulate podocyte function. Curr Opin Nephrol Hypertens. 2005;14:211–216. doi: 10.1097/01.mnh.0000165885.85803.a8. [DOI] [PubMed] [Google Scholar]
- 15.Schaffer AA. Faster linkage analysis computations for pedigrees with loops or unused alleles. Hum Hered. 1996;46:226–235. doi: 10.1159/000154358. [DOI] [PubMed] [Google Scholar]
- 16.O'Connell JR, Weeks DE. The VITESSE algorithm for rapid exact multilocus linkage analysis via genotype set-recoding and fuzzy inheritance. Nat Genet. 1995;11:402–408. doi: 10.1038/ng1295-402. [DOI] [PubMed] [Google Scholar]
- 17.Markianos K, Daly MJ, Kruglyak L. Efficient multipoint linkage analysis through reduction of inheritance space. Am J Hum Genet. 2001;68:963–977. doi: 10.1086/319507. [DOI] [PMC free article] [PubMed] [Google Scholar]
- 18.Kelley LA, Sternberg MJ. Protein structure prediction on the Web: a case study using the Phyre server. Nat Protoc. 2009;4:363–371. doi: 10.1038/nprot.2009.2. [DOI] [PubMed] [Google Scholar]
- 19.Otomo T, et al. Structural basis of actin filament nucleation and processive capping by a formin homology 2 domain. Nature. 2005;433:488–494. doi: 10.1038/nature03251. [DOI] [PubMed] [Google Scholar]
- 20.Lammers M, Rose R, Scrima A, Wittinghofer A. The regulation of mDia1 by autoinhibition and its release by Rho*GTP. Embo J. 2005;24:4176–4187. doi: 10.1038/sj.emboj.7600879. [DOI] [PMC free article] [PubMed] [Google Scholar]
- 21.Nezami AG, Poy F, Eck MJ. Structure of the autoinhibitory switch in formin mDia1. Structure. 2006;14:257–263. doi: 10.1016/j.str.2005.12.003. [DOI] [PubMed] [Google Scholar]
- 22.Berger UV, Hediger MA. Differential distribution of the glutamate transporters GLT-1 and GLAST in tanycytes of the third ventricle. J Comp Neurol. 2001;433:101–114. doi: 10.1002/cne.1128. [DOI] [PubMed] [Google Scholar]
Associated Data
This section collects any data citations, data availability statements, or supplementary materials included in this article.