

Abstract
Massively parallel sequencing technologies continue to alter the study of human genetics. As the cost of sequencing declines, next-generation sequencing (NGS) instruments and datasets will become increasingly accessible to the wider research community. Investigators are understandably eager to harness the power of these new technologies. Sequencing human genomes on these platforms, however, presents numerous production and bioinformatics challenges. Production issues like sample contamination, library chimaeras and variable run quality have become increasingly problematic in the transition from technology development lab to production floor. Analysis of NGS data, too, remains challenging, particularly given the short-read lengths (35–250 bp) and sheer volume of data. The development of streamlined, highly automated pipelines for data analysis is critical for transition from technology adoption to accelerated research and publication. This review aims to describe the state of current NGS technologies, as well as the strategies that enable NGS users to characterize the full spectrum of DNA sequence variation in humans.
Keywords: massively parallel sequencing, next generation sequencing, human genome, variant detection, short read alignment, whole genome sequencing
INTRODUCTION
The landscape of human genetics is rapidly changing, fueled by the advent of massively parallel sequencing technologies [1]. New instruments from Roche (454), Illumina (GenomeAnalyzer), Life Technologies (SOLiD) and Helicos Biosciences (Heliscope) generate millions of short sequence reads per run, making it possible to sequence entire human genomes in a matter of weeks. These ‘next-generation sequencing’ (NGS) technologies have already been employed to sequence the constitutional genomes of several individuals [2–10]. Ambitious efforts like the 1000 Genomes Project and the Personal Genomes Project [11] hope to add thousands more. The first five cancer genomes to be published [12–17] revealed thousands of novel somatic mutations and implicated new genes in tumor development and progression. Our knowledge of the genetic variants that underlie disease susceptibility, treatment response and other phenotypes will continually improve as these studies expand the catalog of DNA sequence variation in humans.
The genomes of at least 10 individuals have been sequenced to high coverage using NGS technologies (Table 1). The first such genome (Watson) was sequenced to ∼7.4× coverage on the 454 GS (Roche) platform [9], and included ∼3.3 million single nucleotide polymorphisms (SNPs) of which 82% were already listed in the National Center for Biotechnology Information SNP database (dbSNP) [18]. Remarkably, the nine personal genomes that followed on NGS technologies [2–8] reported similar results in terms of SNPs: 3–4 million per genome, 80–90% of which overlapped dbSNP. This pattern is so robust, in fact, that many consider ∼3 million SNPs with 80–90% dbSNP concordance (depending on the ethnicity of the sample) to be the ‘gold standard’ for SNP discovery in whole-genome sequencing (WGS). Another implication of this pattern is that individual genomes contain ∼0.5 million novel SNPs, whose submission to public databases will cause exponential growth as WGS studies expand. Indeed, since the completion of the Watson genome in 2007, submissions to dbSNP have skyrocketed (Figure 1). As of February 2010, dbSNP received over 100 million submissions for human, corresponding to 23.7 unique sequence variants of which more than half have been validated [18].
Table 1:
Complete individual genomes and cancer genomes sequenced on massively parallel sequencing instruments
| Sample | Sequencing platform | Max read length (bp) | Fold coverage | Genotype concord. (%) | SNPs (m) | dbSNP (%) |
|---|---|---|---|---|---|---|
| Individual genomes | ||||||
| Watson [9] | Roche/454 | 1 × 250 | 7.4× | 75.8 | 3.32 | 82 |
| NA18507 (YRI) [3] | Illumina | 2 × 35 | 41× | 99.5 | 3.45 | 74 |
| NA18507 (YRI) [6] | ABI SOLiD | 2 × 25 | 18× | 99.2 | 3.87 | 81 |
| YH (Asian) [8] | Illumina | 2 × 35 | 36× | 99.2 | 3.07 | 86 |
| SJK (Korean) [2] | Illumina | 1 × 75 | 29× | 99.4 | 3.44 | 88 |
| AK1 (Korean) [5] | Illumina | 2 × 10⁶ | 28× | 99.1 | 3.45 | 83 |
| P0 (Quake) [7] | Helicos | 1 × 70 | 28× | 98.3 | 2.81 | 76 |
| NA07022 (CEU) [4] | Complete genomics | 2 × 35 | 87× | 91.0 | 3.08 | 90 |
| NA19240 (YRI) [4] | Complete genomics | 2 × 35 | 63× | 95.0 | 4.04 | 81 |
| NA20431 (PGP1) [4] | Complete genomics | 2 × 35 | 45× | 86.0 | 2.91 | 90 |
| Sample | Sequencing platform | Max read length (bp) | Tumor coverage | Normal coverage | Coding SNVs | Coding idels |
| Cancer genomes | ||||||
| Acute myeloid leukemia (AML1) [12] | Illumina | 1 × 36 | 33× | 14× | 8 | 2 |
| Acute myeloid leukemia (AML2) [13] | Illumina | 2 × 75 | 23× | 21× | 10 | 2 |
| Lobular breast cancer [16] | Illumina | 2 × 50 | 43× | — | 32 | 0 |
| Small-cell lung cancer (NCI-H209) [15] | ABI SOLiD | 2 × 25 | 39× | 31× | 134 | 2 |
| Malignant melanoma (COLO-829) [14] | Illumina | 2 × 75 | 40× | 32× | 292 | 0 |
| Glioblastoma cell line (U87MG) [20] | ABI SOLiD | 2 × 50 | 30× | — | 100 | 34 |
| Basal-like breast cancer [17] | Illumina | 2 × 75 | 29× | 39× | 43 | 7 |
Genotype concordance for individual genomes represents agreement with high-density SNP array genotypes. ‘SNPs’ indicates the number of single nucleotide polymorphisms called, excluding small indels. ‘dbSNP’ indicates the proportion of SNPs that were present in dbSNP build 126 or later. ‘Coding SNVs’ indicates validated single nucleotide variants (non-indels) in coding regions, while ‘coding indels’ includes validated small insertions/ deletions in coding regions.
Figure 1:

Growth of public database dbSNP from 2002 to 2010. Note exponential growth in submissions following the first genome sequenced on next-generation technology (Watson) in 2007.
NGS technologies show great promise for the study of the genetic underpinnings of human disease. WGS is particularly appealing because it can detect the full spectrum of genetic variants—SNPs, indels, structural variants (SVs) and copy number variatons (CNV)—that may contribute to a phenotype [19]. Indeed, the complete genome sequences several human cancers—AML [12, 13], breast cancer [16, 17], melanoma [14], lung cancer [15] and glioblastoma [20]—have dramatically expanded the catalog of acquired (somatic) changes that may contribute to tumor development and growth (Table 1). For Mendelian diseases, massively parallel sequencing of family pedigrees offers an effective means of identifying the variants and genes underlying inherited disease [21]. Indeed, the recent sequencing and analysis of a proband with Charcot–Marie tooth syndrome [22] demonstrates that these technologies have the potential for diagnostics in a clinical setting.
The value of massively parallel sequencing instruments for research is clearly illustrated by the widespread adoption of these platforms throughout North America, Europe, Asia and the Pacific (Figure 2). The commoditization of NGS throughout the world suggests that a substantial portion of sequenced human genomes will be produced outside of major genome sequencing centers. Very soon, groups with little to no experience in working with massively parallel sequencing data will gain access to these powerful technologies. The challenges that they face—in terms of production, management, analysis and interpretation of incredible amounts of sequence data—are daunting indeed. Fortunately, major genome centers and other groups who pioneered both traditional and NGS of human genomes have already addressed many of the key issues. Their strategies and methods for high-throughput sequencing of human genomes are the focus of this review.
Figure 2:

Distribution of NGS instruments by country (March 2010). Courtesy of next-generation sequencing maps maintained by Nick Loman [70] and James Hadfield [71].
NGS: OVERVIEW
Massively parallel sequencing enjoys a wide array of applications to the study of human genetics. Generally speaking, however, human genome resequencing using NGS technologies typically employs one of three strategies: targeted resequencing (Target-Seq), whole genome shotgun sequencing (WGS) and transcriptome sequencing (RNA-Seq). The types of genetic variation that can be characterized by these strategies are largely complementary; ultimately, a combination of whole-genome, targeted, and transcriptome sequencing yields the most comprehensive view of an individual genome (Figure 3).
Figure 3:

The intersection of WGS, Target-Seq and RNA-Seq for the characterization of human genomes. Target-Seq of specific regions (selected by PCR or capture) serves primarily for the identification of SNPs and small indels. WGS enables detection not only of SNPs and indels, but also of CNVs and SV (often aided by de novo assembly). RNA-Seq provides digital gene expression information that can be used to validate SNP/indel calls in coding regions and assess the impact of genetic variation (CNV, SNPs and indels) on gene expression. RNA-Seq with paired-end libraries also enables the identification of chimeric transcripts, which serve to validate gene fusion events resulting from genomic structural variation.
Targeted sequencing (Target-Seq) applies genome enrichment strategies to isolate specific regions of interest prior to sequencing. Polymerase chain reaction (PCR)-based approaches for enrichment are gradually being supplanted by hybrid selection (capture) technologies [23, 24], in which sets of DNA or RNA oligonucleotide probes complementary to regions of interest are hybridized with libraries of fragmented DNA. Several methods for capture have been optimized for use with massively parallel sequencing [25–29]. Perhaps the penultimate goal of massively parallel targeted sequencing is to fully characterize the ‘exome’, or the full set of known coding exons. Indeed, dozens of human exomes have been sequenced using hybrid selection technologies paired with massively parallel sequencing [30].
WGS offers the most comprehensive and unbiased approach to genome characterization with next-generation instruments. WGS is particularly attractive because it lets one study the full scope of known DNA sequence variation—from SNPs and small indels to large SVs and CNVs—in a single experiment [1]. Furthermore, sequence reads from single DNA molecules enable the phasing of detected variants to determine which occur on the same chromosome copy, information which is critical for genotype–phenotype correlation. To comprehensively characterize the variation in a single genome, however, it is necessary to generate highly redundant coverage to account for the increased sequencing error and shorter read lengths of massively parallel sequencing technologies. The redundancy required for accurate sequencing (currently ∼30×) is dependent upon read lengths and sequencing error rate; as these metrics improve, less redundancy may be required.
Massively parallel sequencing of cDNA libraries, or RNA-Seq, is a rapidly developing application for NGS technologies [31]. RNA-Seq offers a powerful approach to study the transcribed portion of the human genome, providing a digital readout of gene expression with sensitivity that far exceeds microarray-based methods. Furthermore, RNA-Seq enables the characterization of alternative splicing, allele-specific expression, fusion genes, and other forms of variation at the transcript levels. Specialized methods for mapping mRNA–miRNA interactions have also been adopted for massively parallel sequencing [32, 33].
The broad set of applications for massively parallel sequencing technologies, combined with their widespread adoption by the research community, suggest that NGS will continue to play a key role in the biological discoveries of coming years. Although investigators are understandably eager to harness the power of these new technologies, the massively parallel sequencing of human genomes presents some significant challenges.
PRODUCTION CHALLENGES
It is important to realize that the generation and analysis of data from next-generation instruments present numerous challenges (Table 2). Principal among these are issues of sample contamination from non-human sources, library chimaeras, sample mix-ups and variable run quality.
Table 2:
Production challenges and solutions for next-generation sequencing
| Challenge | Solution |
|---|---|
| Sample contamination | Map reads to databases of possible contaminating sequences |
| Library chimeras | Avoid long-insert data for de novo assembly; require high coverage for SV detection |
| Sample mix-ups | Compare SNP calls to high-density SNP array genotypes to identify mismatched samples |
| Tumor-normal switches | Apply copy number variation (CNV) algorithms to verify tumor or normal sample type |
| Variable run quality | Automate liquid handling, streamline workflows, and implement regular QC checkpoints |
Sample contamination
While sample contamination remains an area of concern in any sequencing project, two aspects of NGS help mitigate this issue. First, NGS can be performed on libraries without the use of bacterial cloning, which was a significant source of sequence contamination in capillary-based sequencing. Second, each read from NGS interrogates a single DNA molecule, which permits the identification and removal of individual contaminating reads. Indeed, by mapping NGS reads to a database of common contaminating genome sequences (of bacterial and viral origin, for example), it is possible to rapidly screen libraries and remove the contaminating sequences.
Library chimaeras
As many as 5% of long-insert paired-end libraries contain chimeric reads [3]. This artifact can have serious ramifications for de novo assembly [34–37] and SV prediction [38, 39] algorithms that rely upon mate pairing information. The assembly problem is potentially more severe, as chimeric fragments can generate false assembly paths. One solution is to use only fragment-end or short insert paired-end data for de novo assembly, and long insert paired-end data for the scaffolding of assembled contigs. For both scaffolding and SV detection, requiring a minimum of three or more independent supporting read pairs at a given locus helps reduce the influence of low-frequency chimeras.
Sample mix-ups
In a high-throughput sequencing environment, human error is an important factor. Major genome centers have developed strategies to identify samples that are switched, mislabeled, or highly contaminated. To identify mislabeled samples, our group and others utilize high-density SNP array data, which provide thousands or millions of accurate genotypes across the genome. These not only provide reference points for diploid coverage estimation, but also constitute a highly individualized forensic DNA profile of the intended sample. Even a single lane of data from WGS or exome captures typically provides sufficient depth to call genotypes at thousands of variant positions; a simple concordance analysis between these and the expected genotypes from high-density arrays (Figure 4A) can distinguish correctly a correctly matched sample (90–99% concordant) from a mis-labeled one (60–80% concordance).
Figure 4:

Performance metrics for sequence data quality. (A) Genotype quality control of sequencing runs. Concordance of per-lane SNP calls with high-density SNP array genotypes for 65 lanes of Illumina data. The low concordance of randomly mismatched controls (left) helps distinguish low-quality data (top right) from true sample mix-ups (right). (B) Error and mapping rates for five real flowcells sequenced on the Illumina platform (1 × 50 bp). Note the increased error rates and decreased alignment rates for poor-performing lanes 1 and 2 on flowcell 1.
Tumor-normal switches
NGS of cancer genomes is typically performed on tumor samples and matched normal controls from the same patient. Here, correct sample identification is particularly critical, since the discovery of somatic changes requires a direct comparison of tumor to normal. Unfortunately, high-density SNP arrays are less informative, since samples share a common genetic origin. For many tumors, however, widespread genomic alterations and copy number changes distinguish tumor from normal. Thus, our group and others have applied CNV detection algorithms to NGS data from tumor-normal pairs to identify possible sample switches.
Variable run quality
As massively parallel sequencing instruments transition from technology development labs to production floors, maintaining consistent run quality is an important challenge. The quality and amount of input DNA and reagents, as well as the skill of the laboratory technicians, can significantly affect results. Given the typically high cost of a single run on NGS instruments, experimental variability must be reduced as much as possible. Major genome centers have addressed this issue through automated liquid handling and streamlined workflows. Regular training of laboratory personnel is important as well. Finally, a series of quality control checks—DNA quantification using Picogreen, gel-based or microfluidics fragment size selection, for example—can isolate the source of problems when they arise.
EVALUATION OF SEQUENCE QUALITY AND COMPLETENESS
Although the throughputs of current NGS platforms are significant, some samples (particularly those undergoing WGS) may require multiple sequencing runs. Given that sequencing runs on NGS instruments are costly and time-consuming, defining a data generation goal is an important step of the planning process. How much sequence data is enough? Often this question is answered by the practical considerations of funding, instrument access, and/or the availability of sample material. In the absence of such restrictions, however, certain performance metrics can indicate the quality and completeness of a sequenced genome.
Run quality metrics
The vendor-provided software for most NGS platforms provides some informative run metrics indicating the quality. Specifically, the number of reads, average read length (for the Roche/454 platform), alignment rate, and inferred error rate are the most obvious indicators of success or failure. As users gain experience with NGS data, the performance metrics of good versus bad runs will become more obvious. On the Illumina GAIIx platform, for example, we expect that good runs will yield 35–75 million reads per lane, with error rates of <2% and ELAND alignment rates of >80%. Error rate and alignment rate are correlated; as error rates increase, alignment rates tend to decrease (Figure 4B).
Sequencing coverage metrics
Sequencing coverage of the genome (for WGS studies) or of target regions (for Target-Seq studies) is the most basic metric for genome completion. There are several advantages to using coverage rather than numbers of runs, lanes, reads, or bases generated. Importantly, coverage excludes reads that are unmapped, ambiguously mapped, or marked as PCR duplicates to provide an estimate of ‘usable’ sequence data. The depth and breadth of sequencing coverage are directly related to the sensitivity and specificity of variant detection, which often represents the key analysis endpoint of human resequencing.
‘Fold’ redundancy (also called haploid coverage) is the number usually followed by an ‘X’ in whole genome resequencing studies. Most of the currently published WGS studies report fold coverage in the ∼30–50× range, which seems to be the bar for a genome sequenced on current NGS platforms. Among the individual genome sequences listed in Table 1 are two exceptions. One is the genome of James D. Watson [9], which was the first to be sequenced on a massively parallel platform (Roche/454) and whose 7.4×-fold coverage represented a major achievement in sequencing technology. The second exception to the ∼30× rule is the sequencing of NA18507 on Life Technologies’ SOLiD platform [6], which utilizes a di-base encoding scheme that requires lower redundancy to achieve >99% sequencing accuracy [6].
The availability of high-density SNP arrays, which typically assay >1-million SNPs across the human genome, provides another key metric of genome completion. Granted, current SNP arrays are largely comprised of SNPs that were characterized by large-scale efforts such as the International HapMap Project, sets which are known to harbor certain biases (assay ability, allele frequency and proximity to genes). Highly repetitive regions, for example, are under-represented. Nevertheless, SNP array data for a sequenced genome is extremely valuable because it provides millions of data points at which sequencing coverage and accuracy can be assessed. Because SNP arrays include many common variants, a substantial number are likely to be heterozygous in the individual being sequenced; detection of both alleles in sequencing data indicates that both chromosomes in a pair are represented. Thus, a comparison of the SNP calls from sequencing data to known genotypes from high-density SNP arrays serves as a more direct measurement of diploid coverage, which should reach 98–99% in a completed genome [12, 13].
PRIMARY ANALYSIS OF NGS DATA
Initially, the sheer volume of data produced by NGS instruments can be overwhelming. Development of a streamlined, highly automated pipeline to facilitate data analysis is a critical step that facilitates the transition from technology adoption to rapid data generation, analysis and publication. In this portion of the review, we discuss the key components of a primary analysis pipeline: sequence alignment, read de-duplication and conversion of data into a generic format in preparation for downstream analysis (Figure 5A).
Figure 5:
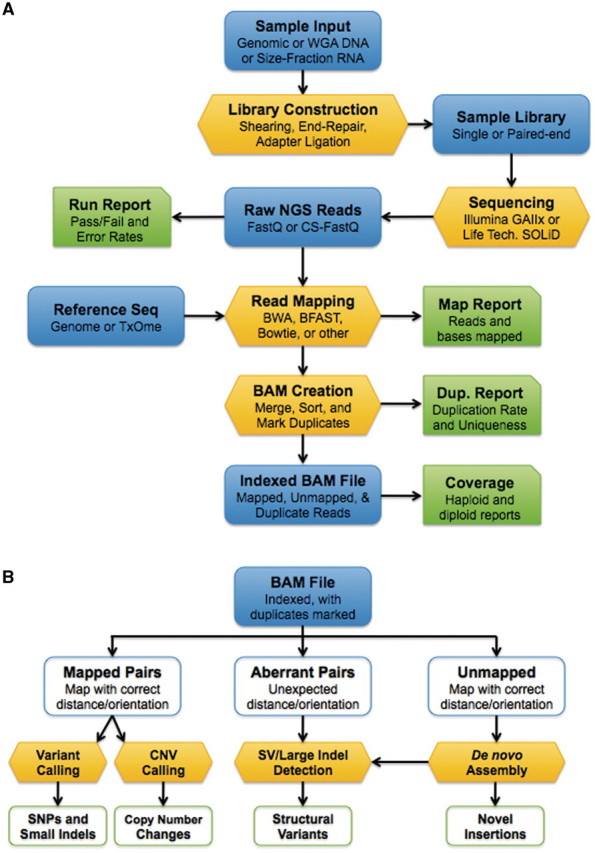
Basic workflows for next-generation sequencing. (A) Sequencing and alignment. Libraries constructed from genomic DNA or RNA are sequenced on massively parallel instruments (e.g. Illumina or SOLiD). The resulting NGS reads are mapped to a reference sequence. Mapped and unmapped reads are imported into SAM/BAM format and marked for PCR/optical duplicates. (B) Post-BAM downstream analysis. The FLAG field of the BAM file indicates the mapping status for each read. Mapped, properly paired reads (or mapped fragment-end reads) are used for SNP/indel detection and copy number estimation. Aberrantly mapped reads, in which reads in a pair map with unexpected distance or orientations, are mined for evidence of structural variation. Finally, de novo assembly of unmapped reads yields predictions of structural variants and novel insertions.
Sequence alignment
The key first step in the analysis of next-generation resequencing data is the alignment, or mapping, of sequence reads to a reference sequence. Three characteristics of NGS data complicate this task. First, the read lengths are relatively short (36–250 bp) compared to traditional capillary-based sequencing, which not only provides less information to use for mapping, but also decreases the likelihood that a read can be mapped to a single, unique location. Second, reads from NGS platforms are of imperfect quality; that is, they contain higher rates of sequencing error. On the Roche/454 platform, for example, homopolymeric sequences are often over- or under-called [40], resulting in reads that contain gaps relative to the reference sequence. On the Illumina GAIIx platform, base quality is a function of read position [3], with the highest-quality bases at the start of the read. The third complication presented by NGS platforms is the sheer volume of data. A single run produces millions of sequencing reads, whose alignment to a large reference sequence requires significant computing power.
Recent years have seen a plethora of short-read alignment tools to support next-generation data analysis. Reads produced on the Roche/454 platform are long enough that traditional algorithms like BLAT [41] and SSAHA2 [42] can be used effectively to map them. The high-throughput and short-read length of the Illumina/Solexa platform, however, presented a significant algorithmic challenge. One of the first tools to address it was the mapping and alignment with qualities algorithm, or MAQ [43]. Compared to the vendor-provided software for Illumina data alignment, MAQ offered several advantages. It considered base quality scores during sequence alignment, which helped to address the variable quality of sequence across a read. Second, it assigned a mapping quality score to quantify the algorithm’s confidence that a read was correctly placed. Finally, MAQ made use of read pairing information (for Illumina paired-end libraries) to improve mapping accuracy and identify aberrantly-mapped pairs. MAQ was widely adopted by the NGS community, and utilized in WGS of human [2, 3] and cancer [12, 13, 16] genomes.
Efficient mapping of short reads to a large reference sequence has remained a considerable computational challenge, spurring the development of dozens of alignment algorithms (Table 3). Some, like Novoalign (http://www.novocraft.com), sought to improve upon the sensitivity of Illumina read alignment. At least three aligners (Bowtie [44], BWA [45] and SOAP2 [46]) have leveraged the Burrows–Wheeler transformation (BWT) algorithm, to dramatically decrease alignment time. Indeed, these algorithms can map a single lane of Illumina data (∼20 million reads) in a matter of hours, compared to the several days required by Maq or Novoalign.
Table 3:
Selected mapping and alignment tools for massively parallel sequencing data
| Aligner | Description | URL |
|---|---|---|
| Illumina platform | ||
| ELAND | Vendor-provided aligner for Illumina data | http://www.illumina.com |
| Bowtie | Ultrafast, memory-efficient short-read aligner for Illumina data | http://bowtie-bio.sourceforge.net |
| Novoalign | A sensitive aligner for Illumina data that uses the Needleman–Wunsch algorithm | http://www.novocraft.com |
| SOAP | Short oligo analysis package for alignment of Illumina data | http://soap.genomics.org.cn/ |
| MrFAST | A mapper that allows alignments to multiple locations for CNV detection | http://mrfast.sourceforge.net/ |
| SOLiD platform | ||
| Corona-lite | Vendor-provided aligner for SOLiD data | http://solidsoftwaretools.com |
| SHRiMP | Efficient Smith–Waterman mapper with colorspace correction | http://compbio.cs.toronto.edu/shrimp/ |
| 454 Platform | ||
| Newbler | Vendor-provided aligner and assembler for 454 data | http://www.454.com |
| SSAHA2 | SAM-friendly sequence search and alignment by hashing program | http://www.sanger.ac.uk/resources/software |
| BWA-SW | SAM-friendly Smith–Waterman implementation of BWA for long reads | http://bio-bwa.sourceforge.net |
| Multi-platform | ||
| BFAST | BLAT-like fast aligner for Illumina and SOLiD data | http://bfast.sourceforge.net |
| BWA | Burrows-Wheeler aligner for Illumina, SOLiD, and 454 data | http://bio-bwa.sourceforge.net |
| Maq | A widely used mapping tool for Illumina and SOLiD; now deprecated by BWA | http://maq.sourceforge.net |
The SOLiD platform (Life Technologies) utilizes a unique di-base encoding scheme in which each base is interrogated twice, to help distinguish sequencing errors from true variation. Indeed, a recently published study applied SOLiD sequencing to characterize an entire genome with only ∼18× haploid coverage [6]. While the vendor-provided software for mapping SOLiD data is available, independent groups have developed their own. SHRiMP [47] is a rapid implementation of Smith–Waterman alignment that performs colorspace-correction while aligning reads. The BLAT-like fast alignment software tool (BFAST [48]) maps reads in color space and allows gaps, which enabled the identification of ∼190 000 small (1–21 bp) indels in the recent sequencing of a glioblastoma cell line [20].
Identifying redundant sequences
Early during the rise of NGS, it became apparent that many of the reads from massively parallel sequencing instruments were identical—same sequence, start site and orientation—suggesting that they represent multiple reads of the same unique DNA fragment, possibly amplified by PCR during the sequencing workflow [49–52]. It is critical to identify and remove these duplicate reads prior to variant calling, since the unintended amplification of PCR-introduced errors can yield skew variant allele frequencies and thereby decrease variant detection sensitivity and specificity [50].
SAMtools ([53], http://samtools.sourceforge.net) includes utilities for the removal of PCR duplicates from single-end or paired-end libraries. However, a superior solution is offered by the Picard suite (http://picard.sourceforge.net), which not only applies optimal fragment-based duplicate identification, but marks duplicate reads using the FLAG field rather than removing them from a SAM file.
The SAM/BAM format
The definition of the sequence alignment map (SAM) format and its binary equivalent (BAM) was a critical achievement for NGS data analysis. The SAM format specification (http://samtools.sourceforge.net/SAM1.pdf) describes a generic format for storing both sequencing reads and their alignment to a reference sequence or assembly. SAM/BAM format is relatively compact, but flexible enough to accommodate relevant information from different sequencing platforms and short-read aligners. A single SAM/BAM file can store mapped, unmapped, and even QC-failed reads from a sequencing run, and indexed to allow rapid access. This means that, if desired, the raw sequencing data can be fully recapitulated from the SAM/BAM file.
One key field of the SAM format specification is the FLAG, a ‘bitwise’ representation of several read properties, which can be true or false. Each property is set to on (1) or off (0); the bits that are set to on, when combined, represent an integer value. Thus, a single field in the SAM format specification indicates if a read is paired, properly paired, mapped, read1 or read2, quality-failed, or marked as duplicate. Thus, SAM/BAM files can contain extensive information about a read, its properties, and its alignment to a reference sequence. A freely available software package, SAMtools [53], provides the utilities for creating, sorting, combining, indexing, viewing, and manipulating SAM/BAM files. For these reasons, SAM/BAM format has been widely adopted by the sequencing community.
Possibilities for outsourcing sequencing
The availability of sequencing services offered by private companies [4] such as Complete Genomics, as well as the Beijing Genomics Institute and other centers, have raised the possibility of ‘outsourcing’ massively parallel sequencing. This option may be attractive to investigators because it mitigates the considerable financial and personnel investment required for NGS instruments [4]. Furthermore, the development of NGS data analysis packages for cloud computing [54] suggests that computationally intense analyses may be run on rented hardware, thus removing the cost of purchasing and maintaining such equipment.
The possibility of outsourcing DNA sequencing to a third party deserves careful consideration. There are important concerns related to privacy and security of the data—since DNA and RNA contain information that could be used to identify an individual, keeping that information in confidence, and safe from intrusion, is of the utmost importance for many investigators. The ethical and legal responsibilities surrounding human samples continue to gain prominence; suggesting that permitting third parties to perform the sequencing faces, at the very least, an uphill battle. Transparency in the data generation process is also a key issue; since the primary analysis of NGS data is so critical to the final results, every step between receiving a sample and providing a BAM file must be carefully documented.
Despite these difficulties, it is clear that some companies and institutions will have the capacity to perform sequencing for outside parties, and some investigators are bound to find sequencing-as-a-service appealing for their research. Furthermore, recent studies in which NGS technologies uncovered important genes for Mendelian disease [21, 22] illustrate the potential of sequencing data to enhance clinical research. For these reasons, the following sections on downstream analysis have the expectation of sequencing data in a BAM file, which seems the most likely endpoint for both primary analysis pipelines and outsourced sequencing.
DOWNSTREAM ANALYSIS OF NGS DATA
A key advantage of converting NGS data to SAM/BAM format is that all downstream analysis can be driven from a single data file (Figure 5B). Properly mapped reads can be used to identify SNPs/indels and to infer genome-wide copy number. Aberrantly mapped read pairs can be screened for evidence of underlying structural variation, while de novo assembly of unmapped reads [34–37] enables the characterization of novel insertions and SV breakpoints. In this section of the review, we discuss some of the algorithms that have been developed for detecting these types of variation in NGS data.
SNPs
Massively parallel sequencing data has proven ideal for the identification of SNPs [55, 56]. Indeed, some ∼3–4-million SNPs per individual were reported for the WGS studies presented in Figure 1; of these, the vast majority (74–90%) [2–9] corresponded to known variants in the National Center for Biotechnology Information’s database of sequence variation in humans (dbSNP). This high overlap suggests that the vast majority of reported variants are real human polymorphisms. Yet the significant fraction of novel SNPs (10–26%) identified from whole genome sequencing implies that a substantial portion of rare variation remains to be discovered. Efforts such as the 1000 Genomes Project (http://www.1000genomes.org) hope to catalog these by sequencing the genomes of thousands of individuals. In cancer, most of the validated somatic single nucleotide variants (SNVs) are neither present in dbSNP nor shared amongst other tumors [12, 13, 16]. Accurate detection of single nucleotide variation, therefore, remains an important aspect of NGS.
Numerous algorithms for calling SNPs in NGS data have been developed in recent years. Bayesian methods (e.g. Atlas-SNP [56], SOAPsnp [55]) utilize prior probability calculations to determine the most probable genotype (reference or variant) based upon available sequence information. Other packages (e.g. SAMtools [53], VarScan [57]) include numerous utilities for detection and filtering of variant calls based on heuristic and probabilistic models, reinforced with empirical knowledge of massively parallel sequencing platforms. No one tool single-handedly outperforms the others. Indeed, a combination of variant calling algorithms, each tuned to perform optimally for the dataset in hand, is likely to yield the best combination of sensitivity and specificity for variant detection in human genomes.
False positives during SNP calling generally arise from two phenomena. The first source is sequencing error, which is more prevalent for NGS platforms than traditional capillary-based methods. While sequencing errors are often random, certain platform-specific and platform-independent trends have become evident. On the Illumina/Solexa platform, sequencing error is positively correlated with read position; errors tend to occur near the ends of reads. In contrast, errors on the Roche/454 platform are not dependent on read position, but tend to cluster around homopolymeric sequences that are under- or over-called during 454 pyrosequencing.
Alignment artifacts are the second major source of false positive SNP calls. The relatively short-read lengths from NGS platforms and complexity of the human reference genome make read mis-alignments inevitable. Paralogous sequences and low-copy repeats that differ by only a few bases can give rise to reads that, when aligned incorrectly, appear to support a substitution at the same position. Thus, these types of errors can manifest even in regions of deep coverage. A window-based filtering approach that identifies clusters of SNP calls (i.e. three SNPs within 10 bp) can help remove some of these artifacts.
Indels
Detection of small insertions and deletions in NGS data has proven more difficult, particularly due to the relatively short-read length typical of most platforms. Computationally speaking, aligning reads with substitutions (SNPs) to a reference sequence is much easier than aligning reads with gaps (indels). While the longer reads of the 454 platform seem to address this problem, indels detected in 454 data tend to carry a high false-positive rate, primarily due to the inability of pyrosequencing technology to resolve homopolymers (runs of a single nucleotide) longer than 4–5 bases. The growing read length of the Illumina/Solexa platform (currently 100 bp) coupled with improvements in gapped short-read alignment (BWA, Novoalign), makes it feasible to detect insertions of up to 30 bp and deletions of nearly any size. We developed a tool, called VarScan (http://varscan.sourceforge.net) [57] that performs indel detection using gapped alignments of massively parallel sequencing data. The Pindel tool takes another approach to indel detection that leverages the mate pairing information from paired-end sequencing on Illumina or SOLiD platforms. By isolating mate pairs where only one read is mapped, and performing split-read alignment of the unmapped read, Pindel identifies slightly larger indel events that are refractory to direct gapped alignment.
Despite these advances, accurate indel detection using massively parallel sequencing data remains challenging. One reason for this is the relatively short-read lengths of NGS platforms, which limits their ability to detect large events, particularly for insertions. Furthermore, indels predicted in NGS datasets, particularly single-base events, suffer high false positive rates due to alignment artifacts and sequencing error. The combination of paired-end sequencing (to increase mapping accuracy) and localized de novo assembly (to remove local mis-alignments and resolve breakpoints) [34–37] improves the performance of indel detection, though not nearly to levels of sensitivity and specificity that are achievable for SNPs.
Structural variation
Massively parallel sequencing data is particularly advantageous for the study of structural variation (SV). Not only does it offer the sensitivity to detect SVs across a wide range of sizes (1–1000 kb), but also enables precise identification of structural breakpoints at base-pair resolution [59–62]. Most sequence-based approaches to SV detection extend seminal work by Volik et al. [63] and Raphael et al. [64]. Their approach used traditional 3730 sequencing to perform end-sequence profiling (ESP) of bacterial artificial chromosomes (BACs). When mapped to the human genome, aberrations in distance and/or orientation between end-sequence read pairs revealed the presence of underlying structural variation.
The ESP method has since been adapted to characterize structural variation in human genomes using paired-end sequencing on the Roche/454 [59], Illumina [65] and SOLiD platforms [6]. Our group has developed an automated pipeline for SV prediction from Illumina paired-end sequencing data. The software algorithm, BreakDancer [39], utilizes data in BAM format to conduct de novo prediction and in silico confirmation of structural variation. The confidence score for each SV prediction is estimated using a Poisson model that takes into consideration the number of supporting reads, the size of the anchoring regions, and the coverage of the genome. BreakDancerMax outputs five types of SVs: insertions, large deletions (>100 bp), inversions, intra-chromosomal rearrangements and inter-chromosomal translocations. Alignment artifacts in short-read data appear to be the most significant source of false positives from BreakDancer and other SV prediction algorithms. To remove false positives, and to precisely define the breakpoints of each variant, we perform de novo assembly using TIGRA (unpublished) of all read pairs that have at least one end mapped to the predicted intervals. AbySS [66], Velvet [34] and other short-read assemblers are well-suited to localized de novo assembly for this purpose. Even the most advanced pipelines for SV detection suffer a high false positive rate [67], suggesting SV detection using NGS data is still in its infancy. However, theoretical work shows the possibility, at least in principle, of controlling false-positives by appropriately tuning redundancy [61].
CNV
Massively parallel, WGS enables detection of CNV at unprecedented resolution. It is important, however, to account for certain biases when utilizing sequencing coverage to infer copy number. First, variable G + C content throughout the genome is known to influence sequence coverage on most NGS platforms. On the Illumina platform, for example, regions with significantly low (<20%) or high (>60%) G + C content are under-represented in shotgun sequencing [3]. To address this bias, Yoon et al. [68] segmented the genome into 100-bp windows, and adjusted each window’s read counts based on the observed deviation in coverage for a given G + C percentage. Mapping bias is another important contributor to variation in sequencing coverage, particularly for the short (35–50 bp) reads produced on Illumina and SOLiD platforms. Campbell et al. [65] proposed a method to correct for mapping bias based on simulations of Illumina 2 × 35 bp reads, which they mapped to the genome using MAQ. Next, they divided the genome into non-overlapping ‘windows’ of unequal width such that each window contained roughly the same number of mapped reads.
After correcting for G + C content and uniqueness, the normalized read depth offers a uniform representation of copy number across the genome. To identify regions of significant copy number change, Campbell et al. [65] adapted a circular binary segmentation algorithm for SNP array data. Their adaptation is implemented in R as the ‘DNAcopy’ library of the Bioconductor project (http://www.bioconductor.org). A similar method, correlational matrix diagonal segmentation (CMDS) [69], enables copy number estimation across a population of samples.
CONCLUSION
The rise of massively parallel sequencing has fundamentally changed the study of genetics and genomics. Whole genome sequencing of 10 individuals and several tumor samples has only begun to reveal the extent and nature of human sequence variation. To date, the majority of NGS has taken place inside of major genome centers. However, the widespread adoption of new sequencing instruments throughout the world suggests that this pattern will change. It should be noted that NGS as a research tool presents substantial challenges—in production, in data management, and in downstream analysis. Investigators stand to benefit from strategies for quality control and data analysis that produced the first studies enabled by NGS technologies. It is clear that new sequencing technologies hold incredible promise for research; their capabilities in the hands of investigators will undoubtedly accelerate our understanding of human genetics.
Key Points.
The widespread adoption and varied applications of massively parallel sequencing suggest that it will play a pivotal role in human genetics in coming years.
Quality control procedures and streamlined workflows can help eliminate some of the production-associated issues—such as sample contamination and variable run quality.
While the bioinformatics challenges presented by NGS are considerable, numerous software tools and algorithms have been developed to facilitate data-management, short-read alignment and the identification of sequence variants.
The incredible throughput of NGS calls for the implementation of automated pipelines, which help speed discovery from the adoption of new sequencing technology to high-throughput research and publication.
FUNDING
This work was supported by the National Human Genome Research Institute [grant number HG003079, PI Richard K. Wilson].
Acknowledgements
We thank Michael C. Wendl for critical reading of the manuscript. We also thank Robert S. Fulton, Lucinda Fulton, David Dooling, David E. Larson, Ken Chen, Michael D. McLellan, Nathan Dees, and Christopher C. Harris of the Genome Center at Washington University in St. Louis for their contributions to discussions related to this review.
Biographies
Daniel C. Koboldt works in the medical genomics group of the Genome Center at Washington University in St. Louis, and maintains a blog on next-generation sequencing at http://www.massgenomics.org.
Li Ding is assistant director and head of the medical genomics group at the Genome Center and a research assistant professor at Washington University in St. Louis.
Elaine R. Mardis is co-director of the Genome Center and an associate professor of genetics at Washington University in St. Louis.
Richard K. Wilson is director of the Genome Center and a professor of genetics at Washington University in St. Louis.
References
- 1.Mardis ER. The impact of next-generation sequencing technology on genetics. Trends Genet. 2008;24(3):133–41. doi: 10.1016/j.tig.2007.12.007. [DOI] [PubMed] [Google Scholar]
- 2.Ahn SM, Kim TH, Lee S, et al. The first Korean genome sequence and analysis: full genome sequencing for a socio-ethnic group. Genome Res. 2009;19(9):1622–9. doi: 10.1101/gr.092197.109. [DOI] [PMC free article] [PubMed] [Google Scholar]
- 3.Bentley DR, Balasubramanian S, Swerdlow HP, et al. Accurate whole human genome sequencing using reversible terminator chemistry. Nature. 2008;456(7218):53–9. doi: 10.1038/nature07517. [DOI] [PMC free article] [PubMed] [Google Scholar]
- 4.Drmanac R, Sparks AB, Callow MJ, et al. Human genome sequencing using unchained base reads on self-assembling DNA nanoarrays. Science. 327(5961):78–81. doi: 10.1126/science.1181498. [DOI] [PubMed] [Google Scholar]
- 5.Kim JI, Ju YS, Park H, et al. A highly annotated whole-genome sequence of a Korean individual. Nature. 2009;460(7258):1011–5. doi: 10.1038/nature08211. [DOI] [PMC free article] [PubMed] [Google Scholar]
- 6.McKernan KJ, Peckham HE, Costa GL, et al. Sequence and structural variation in a human genome uncovered by short-read, massively parallel ligation sequencing using two-base encoding. Genome Res. 2009;19(9):1527–41. doi: 10.1101/gr.091868.109. [DOI] [PMC free article] [PubMed] [Google Scholar]
- 7.Pushkarev D, Neff NF, Quake SR. Single-molecule sequencing of an individual human genome. Nat Biotechnol. 2009;27(9):847–52. doi: 10.1038/nbt.1561. [DOI] [PMC free article] [PubMed] [Google Scholar]
- 8.Wang J, Wang W, Li R, et al. The diploid genome sequence of an Asian individual. Nature. 2008;456(7218):60–5. doi: 10.1038/nature07484. [DOI] [PMC free article] [PubMed] [Google Scholar]
- 9.Wheeler DA, Srinivasan M, Egholm M, et al. The complete genome of an individual by massively parallel DNA sequencing. Nature. 2008;452(7189):872–6. doi: 10.1038/nature06884. [DOI] [PubMed] [Google Scholar]
- 10.Schuster SC, Miller W, Ratan A, et al. Complete Khoisan and Bantu genomes from southern Africa. Nature. 2010;463(7283):943–7. doi: 10.1038/nature08795. [DOI] [PMC free article] [PubMed] [Google Scholar]
- 11.Church GM. The personal genome project. Mol Syst Biol. 2005;1:2005.0030. doi: 10.1038/msb4100040. [DOI] [PMC free article] [PubMed] [Google Scholar]
- 12.Ley TJ, Mardis ER, Ding L, et al. DNA sequencing of a cytogenetically normal acute myeloid leukaemia genome. Nature. 2008;456(7218):66–72. doi: 10.1038/nature07485. [DOI] [PMC free article] [PubMed] [Google Scholar]
- 13.Mardis ER, Ding L, Dooling DJ, et al. Recurring mutations found by sequencing an acute myeloid leukemia genome. N Engl J Med. 2009;361(11):1058–66. doi: 10.1056/NEJMoa0903840. [DOI] [PMC free article] [PubMed] [Google Scholar]
- 14.Pleasance ED, Cheetham RK, Stephens PJ, et al. A comprehensive catalogue of somatic mutations from a human cancer genome. Nature. 2010;463(7278):191–6. doi: 10.1038/nature08658. [DOI] [PMC free article] [PubMed] [Google Scholar]
- 15.Pleasance ED, Stephens PJ, O'Meara S, et al. A small-cell lung cancer genome with complex signatures of tobacco exposure. Nature. 2010;463(7278):184–90. doi: 10.1038/nature08629. [DOI] [PMC free article] [PubMed] [Google Scholar]
- 16.Shah SP, Morin RD, Khattra J, et al. Mutational evolution in a lobular breast tumour profiled at single nucleotide resolution. Nature. 2009;461(7265):809–13. doi: 10.1038/nature08489. [DOI] [PubMed] [Google Scholar]
- 17.Ding L, Ellis MJ, Li S, et al. Genome remodelling in a basal-like breast cancer metastasis and xenograft. Nature. 2010;464(7291):999–1005. doi: 10.1038/nature08989. [DOI] [PMC free article] [PubMed] [Google Scholar]
- 18.Sherry ST, Ward MH, Kholodov M, et al. dbSNP: the NCBI database of genetic variation. Nucleic Acids Res. 2001;29(1):308–11. doi: 10.1093/nar/29.1.308. [DOI] [PMC free article] [PubMed] [Google Scholar]
- 19.Snyder M, Du J, Gerstein M. Personal genome sequencing: current approaches and challenges. Genes Dev. 24(5):423–31. doi: 10.1101/gad.1864110. [DOI] [PMC free article] [PubMed] [Google Scholar]
- 20.Clark MJ, Homer N, O'Connor BD, et al. U87MG decoded: the genomic sequence of a cytogenetically aberrant human cancer cell line. PLoS Genet. 2010;6(1):e1000832. doi: 10.1371/journal.pgen.1000832. [DOI] [PMC free article] [PubMed] [Google Scholar]
- 21.Roach JC, Glusman G, Smit AF, et al. Analysis of genetic inheritance in a family quartet by whole-genome sequencing. Science. 2010;328(5978):636–9. doi: 10.1126/science.1186802. [DOI] [PMC free article] [PubMed] [Google Scholar]
- 22.Lupski JR, Reid JG, Gonzaga-Jauregui C, et al. Whole-genome sequencing in a patient with charcot-marie-tooth neuropathy. N Engl J Med. 2010;362(13):1181–91. doi: 10.1056/NEJMoa0908094. [DOI] [PMC free article] [PubMed] [Google Scholar]
- 23.Turner EH, Ng SB, Nickerson DA, et al. Methods for genomic partitioning. Annu Rev Genomics Hum Genet. 2009;10:263–84. doi: 10.1146/annurev-genom-082908-150112. [DOI] [PubMed] [Google Scholar]
- 24.Mamanova L, Coffey AJ, Scott CE, et al. Target-enrichment strategies for next-generation sequencing. Nat Methods. 2010;7(2):111–8. doi: 10.1038/nmeth.1419. [DOI] [PubMed] [Google Scholar]
- 25.Gnirke A, Melnikov A, Maguire J, et al. Solution hybrid selection with ultra-long oligonucleotides for massively parallel targeted sequencing. Nat Biotechnol. 2009;27(2):182–9. doi: 10.1038/nbt.1523. [DOI] [PMC free article] [PubMed] [Google Scholar]
- 26.Albert TJ, Molla MN, Muzny DM, et al. Direct selection of human genomic loci by microarray hybridization. Nat Methods. 2007;4(11):903–5. doi: 10.1038/nmeth1111. [DOI] [PubMed] [Google Scholar]
- 27.Bashiardes S, Veile R, Helms C, et al. Direct genomic selection. Nat Methods. 2005;2(1):63–9. doi: 10.1038/nmeth0105-63. [DOI] [PubMed] [Google Scholar]
- 28.Hodges E, Xuan Z, Balija V, et al. Genome-wide in situ exon capture for selective resequencing. Nat Genet. 2007;39(12):1522–7. doi: 10.1038/ng.2007.42. [DOI] [PubMed] [Google Scholar]
- 29.Okou DT, Steinberg KM, Middle C, et al. Microarray-based genomic selection for high-throughput resequencing. Nat Methods. 2007;4(11):907–9. doi: 10.1038/nmeth1109. [DOI] [PubMed] [Google Scholar]
- 30.Ng SB, Turner EH, Robertson PD, et al. Targeted capture and massively parallel sequencing of 12 human exomes. Nature. 2009;461(7261):272–6. doi: 10.1038/nature08250. [DOI] [PMC free article] [PubMed] [Google Scholar]
- 31.Wang Z, Gerstein M, Snyder M. RNA-Seq: a revolutionary tool for transcriptomics. Nat Rev Genet. 2009;10(1):57–63. doi: 10.1038/nrg2484. [DOI] [PMC free article] [PubMed] [Google Scholar]
- 32.Chi SW, Zang JB, Mele A, et al. Argonaute HITS-CLIP decodes microRNA-mRNA interaction maps. Nature. 2009;460(7254):479–86. doi: 10.1038/nature08170. [DOI] [PMC free article] [PubMed] [Google Scholar]
- 33.Licatalosi DD, Mele A, Fak JJ, et al. HITS-CLIP yields genome-wide insights into brain alternative RNA processing. Nature. 2008;456(7221):464–9. doi: 10.1038/nature07488. [DOI] [PMC free article] [PubMed] [Google Scholar]
- 34.Zerbino DR, Birney E. Velvet: algorithms for de novo short read assembly using de Bruijn graphs. Genome Res. 2008;18(5):821–9. doi: 10.1101/gr.074492.107. [DOI] [PMC free article] [PubMed] [Google Scholar]
- 35.Young AL, Abaan HO, Zerbino D, et al. A new strategy for genome assembly using short sequence reads and reduced representation libraries. Genome Res. 2010;20(2):249–56. doi: 10.1101/gr.097956.109. [DOI] [PMC free article] [PubMed] [Google Scholar]
- 36.Li R, Zhu H, Ruan J, et al. De novo assembly of human genomes with massively parallel short read sequencing. Genome Res. 2010;20(2):265–72. doi: 10.1101/gr.097261.109. [DOI] [PMC free article] [PubMed] [Google Scholar]
- 37.Simpson JT, Wong K, Jackman SD, et al. ABySS: a parallel assembler for short read sequence data. Genome Res. 2009;19(6):1117–23. doi: 10.1101/gr.089532.108. [DOI] [PMC free article] [PubMed] [Google Scholar]
- 38.Raphael BJ, Volik S, Yu P, et al. A sequence-based survey of the complex structural organization of tumor genomes. Genome Biol. 2008;9(3):R59. doi: 10.1186/gb-2008-9-3-r59. [DOI] [PMC free article] [PubMed] [Google Scholar]
- 39.Chen K, Wallis JW, McLellan MD, et al. BreakDancer: an algorithm for high-resolution mapping of genomic structural variation. Nat Methods. 2009;6(9):677–81. doi: 10.1038/nmeth.1363. [DOI] [PMC free article] [PubMed] [Google Scholar]
- 40.Margulies M, Egholm M, Altman WE, et al. Genome sequencing in microfabricated high-density picolitre reactors. Nature. 2005;437(7057):376–80. doi: 10.1038/nature03959. [DOI] [PMC free article] [PubMed] [Google Scholar]
- 41.Kent WJ. BLAT – the BLAST-like alignment tool. Genome Res. 2002;12(4):656–64. doi: 10.1101/gr.229202. [DOI] [PMC free article] [PubMed] [Google Scholar]
- 42.Ning Z, Cox AJ, Mullikin JC. SSAHA: a fast search method for large DNA databases. Genome Res. 2001;11(10):1725–9. doi: 10.1101/gr.194201. [DOI] [PMC free article] [PubMed] [Google Scholar]
- 43.Li H, Ruan J, Durbin R. Mapping short DNA sequencing reads and calling variants using mapping quality scores. Genome Res. 2008;18(11):1851–8. doi: 10.1101/gr.078212.108. [DOI] [PMC free article] [PubMed] [Google Scholar]
- 44.Langmead B, Trapnell C, Pop M, et al. Ultrafast and memory-efficient alignment of short DNA sequences to the human genome. Genome Biol. 2009;10(3):R25. doi: 10.1186/gb-2009-10-3-r25. [DOI] [PMC free article] [PubMed] [Google Scholar]
- 45.Li H, Durbin R. Fast and accurate short read alignment with Burrows-Wheeler transform. Bioinformatics. 2009;25(14):1754–60. doi: 10.1093/bioinformatics/btp324. [DOI] [PMC free article] [PubMed] [Google Scholar]
- 46.Li R, Yu C, Li Y, et al. SOAP2: an improved ultrafast tool for short read alignment. Bioinformatics. 2009;25(15):1966–7. doi: 10.1093/bioinformatics/btp336. [DOI] [PubMed] [Google Scholar]
- 47.Rumble SM, Lacroute P, Dalca AV, et al. SHRiMP: accurate mapping of short color-space reads. PLoS Comput Biol. 2009;5(5):e1000386. doi: 10.1371/journal.pcbi.1000386. [DOI] [PMC free article] [PubMed] [Google Scholar]
- 48.Homer N, Merriman B, Nelson SF. BFAST: an alignment tool for large scale genome resequencing. PLoS ONE. 2009;4(11):e7767. doi: 10.1371/journal.pone.0007767. [DOI] [PMC free article] [PubMed] [Google Scholar]
- 49.Niu B, Fu L, Sun S, et al. Artificial and natural duplicates in pyrosequencing reads of metagenomic data. BMC Bioinformatics. 2010;11(187) doi: 10.1186/1471-2105-11-187. [DOI] [PMC free article] [PubMed] [Google Scholar]
- 50.Kozarewa I, Ning Z, Quail MA, et al. Amplification-free Illumina sequencing-library preparation facilitates improved mapping and assembly of (G+C)-biased genomes. Nat Methods. 2009;6(4):291–5. doi: 10.1038/nmeth.1311. [DOI] [PMC free article] [PubMed] [Google Scholar]
- 51.Yeager M, Xiao N, Hayes RB, et al. Comprehensive resequence analysis of a 136 kb region of human chromosome 8q24 associated with prostate and colon cancers. Hum Genet. 2008;124(2):161–70. doi: 10.1007/s00439-008-0535-3. [DOI] [PMC free article] [PubMed] [Google Scholar]
- 52.Harismendy O, Frazer K. Method for improving sequence coverage uniformity of targeted genomic intervals amplified by LR-PCR using Illumina GA sequencing-by-synthesis technology. Biotechniques. 2009;46(3):229–31. doi: 10.2144/000113082. [DOI] [PubMed] [Google Scholar]
- 53.Li H, Handsaker B, Wysoker A, et al. The sequence alignment/map format and SAMtools. Bioinformatics. 2009;25(16):2078–9. doi: 10.1093/bioinformatics/btp352. [DOI] [PMC free article] [PubMed] [Google Scholar]
- 54.Langmead B, Schatz MC, Lin J, et al. Searching for SNPs with cloud computing. Genome Biol. 2009;10(11):R134. doi: 10.1186/gb-2009-10-11-r134. [DOI] [PMC free article] [PubMed] [Google Scholar]
- 55.Li R, Li Y, Fang X, et al. SNP detection for massively parallel whole-genome resequencing. Genome Res. 2009;19(6):1124–32. doi: 10.1101/gr.088013.108. [DOI] [PMC free article] [PubMed] [Google Scholar]
- 56.Shen Y, Wan Z, Coarfa C, et al. A SNP discovery method to assess variant allele probability from next-generation resequencing data. Genome Res. 20(2):273–80. doi: 10.1101/gr.096388.109. [DOI] [PMC free article] [PubMed] [Google Scholar]
- 57.Koboldt DC, Chen K, Wylie T, et al. VarScan: variant detection in massively parallel sequencing of individual and pooled samples. Bioinformatics. 2009;25(17):2283–5. doi: 10.1093/bioinformatics/btp373. [DOI] [PMC free article] [PubMed] [Google Scholar]
- 58.Ye K, Schulz MH, Long Q, et al. Pindel: a pattern growth approach to detect break points of large deletions and medium sized insertions from paired-end short reads. Bioinformatics. 2009;25(21):2865–71. doi: 10.1093/bioinformatics/btp394. [DOI] [PMC free article] [PubMed] [Google Scholar]
- 59.Korbel JO, Urban AE, Affourtit JP, et al. Paired-end mapping reveals extensive structural variation in the human genome. Science. 2007;318(5849):420–6. doi: 10.1126/science.1149504. [DOI] [PMC free article] [PubMed] [Google Scholar]
- 60.Lam HY, Mu XJ, Stutz AM, et al. Nucleotide-resolution analysis of structural variants using BreakSeq and a breakpoint library. Nat Biotechnol. 2010;28(1):47–55. doi: 10.1038/nbt.1600. [DOI] [PMC free article] [PubMed] [Google Scholar]
- 61.Wendl MC, Wilson RK. Statistical aspects of discerning indel-type structural variation via DNA sequence alignment. BMC Genomics. 2009;10:359. doi: 10.1186/1471-2164-10-359. [DOI] [PMC free article] [PubMed] [Google Scholar]
- 62.Bashir A, Volik S, Collins C, et al. Evaluation of paired-end sequencing strategies for detection of genome rearrangements in cancer. PLoS Comput Biol. 2008;4(4):e1000051. doi: 10.1371/journal.pcbi.1000051. [DOI] [PMC free article] [PubMed] [Google Scholar]
- 63.Volik S, Zhao S, Chin K, et al. End-sequence profiling: sequence-based analysis of aberrant genomes. Proc Natl Acad Sci USA. 2003;100(13):7696–701. doi: 10.1073/pnas.1232418100. [DOI] [PMC free article] [PubMed] [Google Scholar]
- 64.Raphael BJ, Volik S, Collins C, et al. Reconstructing tumor genome architectures. Bioinformatics. 2003;19(Suppl 2):ii162–71. doi: 10.1093/bioinformatics/btg1074. [DOI] [PubMed] [Google Scholar]
- 65.Campbell PJ, Stephens PJ, Pleasance ED, et al. Identification of somatically acquired rearrangements in cancer using genome-wide massively parallel paired-end sequencing. Nat Genet. 2008;40(6):722–9. doi: 10.1038/ng.128. [DOI] [PMC free article] [PubMed] [Google Scholar]
- 66.Birol I, Jackman SD, Nielsen CB, et al. De novo transcriptome assembly with ABySS. Bioinformatics. 2009;25(21):2872–7. doi: 10.1093/bioinformatics/btp367. [DOI] [PubMed] [Google Scholar]
- 67.Hormozdiari F, Alkan C, Eichler EE, et al. Combinatorial algorithms for structural variation detection in high-throughput sequenced genomes. Genome Res. 2009;19(7):1270–8. doi: 10.1101/gr.088633.108. [DOI] [PMC free article] [PubMed] [Google Scholar]
- 68.Yoon S, Xuan Z, Makarov V, et al. Sensitive and accurate detection of copy number variants using read depth of coverage. Genome Res. 2009;19(9):1586–92. doi: 10.1101/gr.092981.109. [DOI] [PMC free article] [PubMed] [Google Scholar]
- 69.Zhang Q, Ding L, Larson DE, et al. CMDS: a population-based method for identifying recurrent DNA copy number aberrations in cancer from high-resolution data. Bioinformatics. 26(4):464–9. doi: 10.1093/bioinformatics/btp708. [DOI] [PMC free article] [PubMed] [Google Scholar]
- 70.Loman N. Genomics: high-throughput “next-generation” sequencing facilities map. High-throughput Sequencing Map. 2010 http://pathogenomics.bham.ac.uk/hts. [Google Scholar]
- 71.Hadfield J. Microarrays: Illumina BeadStation, Affymetrix. Google Maps. 2009. Genomics: NextGen sequencers; Illumina (Solexa), ABI SOLiD, Roche/454. http://maps.google.com/maps/ms?ie=UTF8&oe=UTF8&msa=0&msid=105818748019109863589.00046217bff07919c1e07. [Google Scholar]