

Abstract
Background. Autosomal dominant polycystic kidney disease (ADPKD) is a common genetic disease that results in the development of cystic kidneys and liver. Pkd2(WS25/−) mice are a key genetic mouse model of human ADPKD that recapitulate the ‘molecular recessive’ nature of human ADPKD. Providing the foundation for future long-term studies, the present work documents distinct patterns of long-term cyst growth in the kidneys and liver of male and female pkd2(WS25/−) mice.
Methods. Gravimetric measurements documented the progression of kidney and liver growth in male and female pkd2(WS25/−) mice over 12 months. A fast imaging with steady-state precision–magnetic resonance imaging (FISP-MRI) technique to measure kidney and liver organ and cyst volumes was optimized and validated. Longitudinal FISP-MRI analyses of changes in cyst volumes were performed in pkd2(WS25/−) mice over 15 months.
Results. Male and female pkd2(WS25/−) mice had significant increases in kidney weights after 4 months of age. The progression of kidney growth was minimal after 4 months of age. Liver cyst growth in male pkd2(WS25/−) mice was minimal after 4 months of age but showed an accelerated rate of growth after 8 months of age. Female pkd2(WS25/−) mice also showed accelerated growth but this was delayed in time when compared with male pkd2(WS25/−) mice.
Conclusions. Pkd2(WS25/−) mice are a genetic mouse model that recapitulates the early phenotypic characteristics of human ADPKD kidney cystogenesis. Male pkd2(WS25/−) mice consistently display a late progression in liver growth that is seen in clinically impacted livers of human ADPKD patients.
Keywords: Autosomal dominant polycystic kidney disease (ADPKD), Fast imaging with steady-state precision (FISP), Magnetic resonance imaging (MRI)
Introduction
Occurring in ∼1 in 800 live births, autosomal dominant polycystic kidney disease (ADPKD) is the most common life-threatening hereditary disease in the USA. The most prominent feature of ADPKD is the development of polycystic kidneys that leads to the progressive loss of renal function. ADPKD accounts for ∼4% of all patients requiring renal replacement therapy in the USA [1]. The most prevalent extra-renal manifestation of ADPKD is the formation of liver cysts. While liver function is generally maintained, cystic livers can reach seven times their normal volume [2] and cystic livers contribute significantly to ADPKD morbidity and mortality. In ADPKD kidneys, longitudinal computed tomography (CT) and quantitative magnetic resonance imaging (MRI) studies [3,4] show that cyst and organ volumes correlate directly with the degree of renal function impairment and cyst volume increases occur in an age-dependent manner [5–7]. Similarly, in ADPKD livers, MRI studies show that hepatic cysts are highly prevalent and increase progressively in volume over time [8,9]. The availability of genetic animal models with phenotypes that closely parallels the human disease will allow mechanistic studies to be performed and mechanism-based therapies to be tested.
Human ADPKD is linked to mutations in either PKD1 (∼85% of cases) or PKD2 (∼15% of cases). ADPKD is likely a ‘molecular recessive’ disease where individuals have a germline mutation in one allele and undergo spontaneous mutations in the remaining allele within individual somatic cells during the subject's lifetime. Accordingly, homozygous pkd1(−/−) and pkd2(−/−) knockout mice die in utero or in the early post-partum period. Heterozygous pkd1(+/−) and pkd2(+/−) mice can develop cysts but do so at a rate that precludes them serving as a useful model. To address the need for a genetic animal model that mirrors the phenotype of human ADPKD, pkd2(WS25/−) mice were engineered [10]. These mice have a true knockout of one of the pkd2 alleles while the second pkd2 allele (i.e. WS25) was engineered to undergo rapid rates of recombination. The recombination events results in reversion back to a wild-type configuration or conversion to a true knockout configuration. By 3 months of age, all pkd2(WS25/−) mice develop discernible cysts in both their kidneys and liver [10]. These mimetic features make pkd2(WS25/−) mice a potentially powerful model to study the mechanisms of disease progression and efficacy of medical therapies. To date, however, little is known about the progression of cyst disease in pkd2(WS25/−) mice. To non-invasively track cyst progression within individual mice, a fast imaging with steady-state precision (FISP)-MRI technique was first optimized and validated. Gravimetric and FISP-MRI measurements of organ weights, organ volumes and cyst volumes were then used to document the long-term growth characteristics of kidney and liver cysts in male and female pkd2(WS25/−) mice.
Materials and methods
Pkd2(WS25/−) mouse model
C57BL/6 pkd2(WS25/−) mice were developed and provided by Stefan Somlo [10]. The animals were cared for in the Center for Laboratory Animal Care at UC-Denver Anschutz Medical Center and all experimental protocols were approved by the UC-Denver Animal Care and Use Committee. C57BL/6 Pkd2(+/−) and C57BL/6 pkd2(WS25/+) breeding pairs generated pkd2(WS25/−) mice. Mice were genotyped by Southern blotting, as previously described [10]. At interim time points, some mice were subjected to MRI analysis (see below). At each final time point, mice were weighed, euthanized (pentobarbital, 60 mg/kg body weight), kidneys and liver removed and weighed.
Magnetic resonance imaging
MRI studies were performed on a Bruker 4.7-Tesla PharmaScan (Bruker Medical, Billerica, MA). Animals were anaesthetized (60 mg/kg xylazine, 10 mg/kg ketamine), injected into the tail vein with Omniscan® (gadodiamide, GE Healthcare; 0.1 mmol/kg) and inserted into a volume coil (38 mm diameter; tuned to the 1H frequency of 200 MHz) [11,12]. Three distinct sequences were initially applied: Bruker rapid acquisition with relaxation enhancement (RARE) proton density-weighted MRI (TR/TE = 3000/32 ms; number of averages = 4; flip angle = 180°; total acquisition time = 6 min 35 s); Bruker multi-slice multi-echo (MSME) T1-weighted MRI (TR/TE = 720/11 ms; number of averages = 4; flip angle = 90°; total acquisition time = 12 min 16 s) and Bruker FISP-MRI (TR/TE = 3.8/1.9 ms; number of averages = 4; flip angle = 60°; total acquisition time = 2 min 24 s). The slice thickness was 0.1 cm; fields of view ranged between 3.6 and 4.0 cm; slice orientation was axial or coronal; and the matrix size was 256 × 256 [13]. FISP-MRI was the most effective method and was used on the subsequent longitudinal studies of five female pkd2(WS25/−) mice and one male pkd2(WS25/−) mouse between 3 and 15 months of age. The study survival times of the five female mice in the study were 7 (one), 11 (one), 13 (one) and 15 months (two) of age. The pre-mature animal deaths occurred after failing to recover from MRI anaesthesia and were not considered directly associated with their genetic background.
Volumetric analysis
Total organ and cyst volumes of kidneys and liver were measured on serial FISP-MRI images using NIH Image J. For each slice, the perimeter of each kidney and the liver was electronically outlined and the total number of pixels recorded. The perimeters of all kidney and liver cysts were similarly measured and recorded. The values were converted to cubic centimetres and multiplied by the slice thickness to get the organ and cyst volumes per slice. The organ and cyst volumes within all the slices were summed to get the total volumes. The coefficient of variation of seven repeated measurements of the same organ (i.e. intra-operator error) was ∼2.2% [11]. Parenchymal volumes for kidneys and liver were calculated by subtracting the total cyst volume from the total organ volume.
Statistical analysis
Group data were presented as the mean ± the standard error of the mean. All statistical analyses ware carried out using the InStat 2.0.9 statistical analysis software. A non-parametric (Mann–Whitney Test) analysis of unpaired samples was performed on the gravimetric data within each time point. P-values < 0.05 were considered statistically significant.
Results
Gadolinium-enhanced FISP-MRI provides sensitive imaging of kidney and liver cysts
The present study sought to establish an MRI methodology with the sensitivity, contrast and resolution that allows accurate and concurrent measurements of cyst volumes within the kidneys and liver of pkd2(WS25/−) mice. In each MRI technique tested, gadolinium markedly increased the intensity of the detected signals (data not shown). Compared with RARE-MRI and MSME-MRI, FISP-MRI consistently produced the clearest images of tissues and cysts. FISP-MRI combines a mixture of T2-weighted and T1-weighted contrast to produce homogeneously bright signals of fluids (i.e. cyst fluids) while also having excellent delineation of parenchymal tissues [14–16]. The rapid (2 min and 24 s) acquisition time also reduced the effect of breathing artefacts. Images from H&E sections (Figure 1A) and FISP-MRI sections (Figure 1B) through a similar region of the same kidney demonstrate the comparative capacities of the two techniques to detect the presence of cysts. The resolution of FISP-MRI allows 0.3 mm diameter cysts to be detected and discriminated (Figure 1C). Examples of longitudinal FISP-MRI imaging of a cystic kidney and cystic liver are shown in Figure 2. Figure 2A–C shows the emergence and growth of cysts in the kidney of a pkd2(WS25/−) mouse at 5, 6 and 7 months of age, respectively. Figure 2D and E shows the longitudinal images of a cystic liver at 7 and 13 months, respectively. The capacity to measure cyst and organ volumes using serial FISP-MRI images was validated by comparing FISP-MRI organ volumes and gravimetric organ weights measured from the same animal (Figure 3). This included normal organs from pkd2(+/+) mice (n = 6) and cystic organs from pkd2(WS25/−) mice (n = 3). Linear regression analysis showed a strong correlation between organ weights and volumes for both kidney (y = 1.00x + 0.04; r2 = 0.975; n = 18 [two kidneys in nine animals]) and liver (y = 0.96x + 0.03; r2 = 0.932; n = 9). FISP-MRI volume measurements were subsequently incorporated into studies of cyst growth patterns of kidneys and liver cysts in pkd2(WS25/−) mice.
Fig. 1.
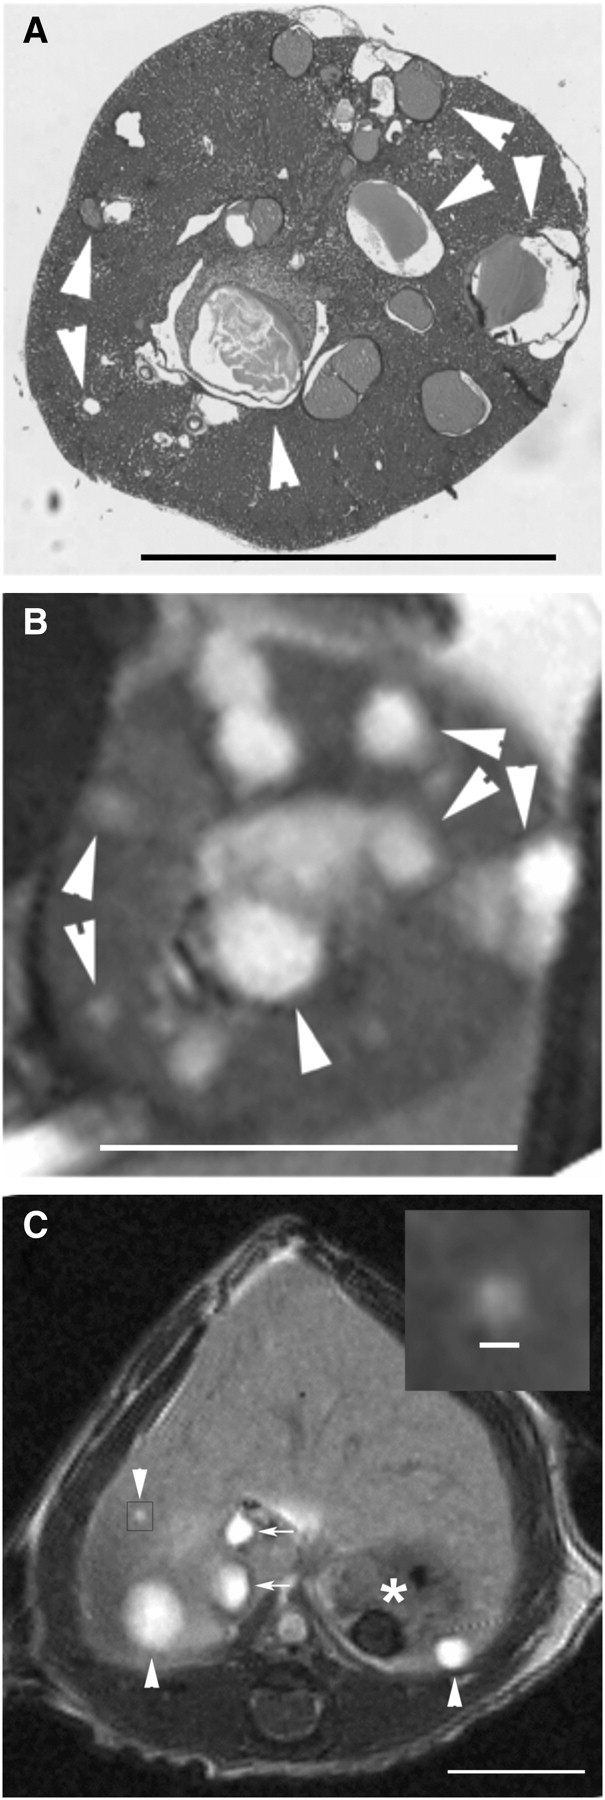
Characteristics of FISP-MRI of kidney and liver cysts. Images from axially oriented H&E (A) and FISP-MRI (B) sections through a cystic kidney from a 6-month-old male pkd2(WS25/−) mouse show the comparative capacity of the two techniques to image cysts. While not perfectly matched in orientation, the images have several cysts in common (arrowheads; bar = 5 mm). Axial imaging of liver (C) shows a relatively homogeneous signal density (bar = 5 mm). The stomach (asterisk) and portal vein/vena cava (arrows) are also observed. The gall bladder is not seen in this section. Within the body of the liver, liver cysts of various sizes are observed (arrowheads). A contrast-adjusted image of the smallest cyst (inset bar = 0.3 mm) highlights the resolution of FISP-MRI detection.
Fig. 2.

Longitudinal FISP-MRI imaging of cysts in pkd2(WS25/−) mice. FISP-MRI images displayed the ability to discern kidney and liver cyst growth longitudinally within the same animal. Coronal mid-organ images of the right kidney in a female pkd2(WS25/−) mouse after (A) 5, (B) 6 and (C) 7 months of age are shown (bar = 5 mm). Arrowheads point to cysts. Axial mid-organ images of the liver in a female pkd2(WS25/−) mouse after (D) 7 and (E) 13 months of age are shown. Arrowheads point to cysts; the stomach (asterisk) and portal vein/vena cava (arrows) are also observed. The gall bladder is not seen in these sections. The liver hilum appears as a diffuse white area in the mid-liver region at this level.
Fig. 3.
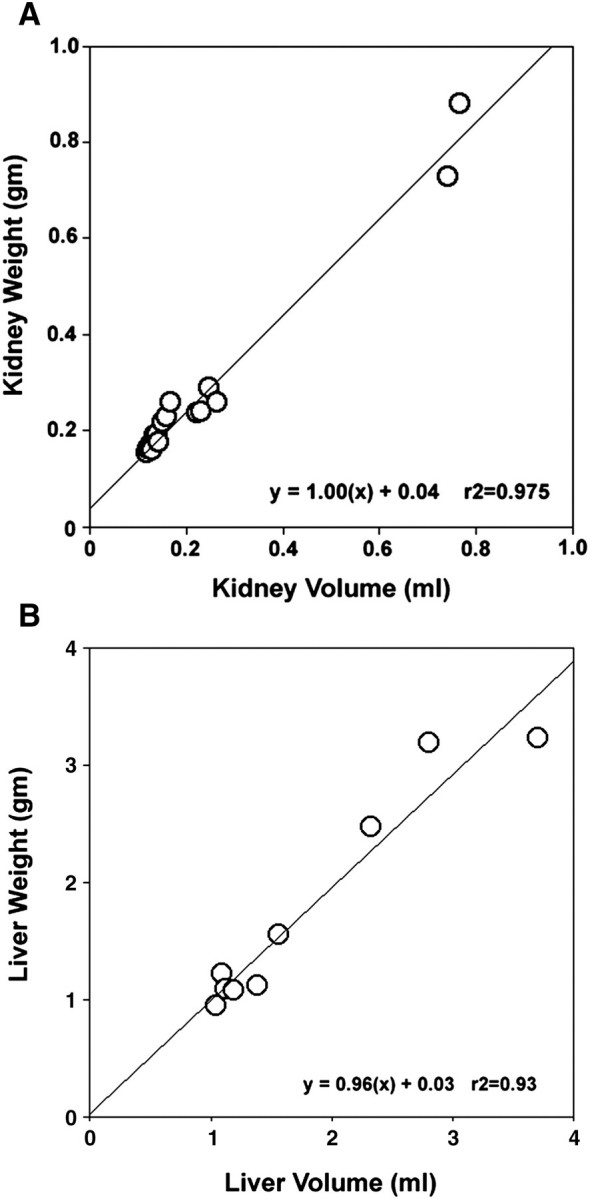
Validation of FISP-MRI organ volume measurements. Using both pkd2(+/+) (n = 6) and pkd2(WS25/−) (n = 3) mice, (A) linear regression analysis showed that MRI-calculated kidney volumes were highly correlated with gravimetric kidney weights (r2=0.975) and (B) MRI-calculated liver volumes were strongly correlated with gravimetric liver weights (r2=0.932).
Kidneys in pkd2(WS25/−) mice display early cystogenesis
An initial comparison of the left versus right kidney weights in pkd2(WS25/−) mice showed that the left or right kidneys could increase in weight independently of the other kidney (Figure 4). In subsequent analyses, left and right kidney weights were combined and presented as total kidney weights. At 4 months of age, kidneys in male and female pkd2(WS25/−) mice were, respectively, 40 and 31% larger than organs from age-matched pkd2(+/+) mice (Figures 4B and 5A; Table 1). Interestingly, between 4 and 12 months of age, there was no accelerated progression of kidney growth. After 12 months, male pkd2(WS25/−) kidneys were still 40% larger than male pkd2(+/+) kidneys and female pkd2(WS25/−) kidneys were 29% larger than female pkd2(+/+) kidneys. FISP-MRI analysis largely corroborated these findings (Figure 5C). The kidneys of the male pkd2(WS25/−) mouse showed a progression in cyst volumes between 5 and 15 months of age that was larger than predicted by the average gravimetric measurements, but values were within the range of individual measurements. The right and left kidney cyst volumes were 0.046 and 0.098 mL at 5 months of age and 0.282 and 0.480 mL at 13 months of age. In four of the five female pkd2(WS25/−) mice, kidney cyst volumes paralleled the average gravimetric findings. These eight kidneys all had measurable but modest cyst volumes at 5 months of age (range at 5 months, 0.004–0.048 mL) and little increase in the cyst volumes in the subsequent months (range at 13 months, 0.003–0.075 mL). The two kidneys from the remaining female pkd2(WS25/−) mouse had a distinct pattern of cyst growth with significant volumes at 5 months of age (right, 0.257 mL; left, 0.219 mL) and robust increases over the following 6 months (11 months of age: right, 0.708 mL; left, 0.453 mL). The underlying reason for this distinct phenotype is unclear, but the observation highlights the variability that can occur in this model and the utility of FISP-MRI longitudinal measurements.
Fig. 4.

Left versus right kidney weights in pkd2(WS25/−) mice. Measurements were made in mice at 4, 8 and 12 months of age. Left and right kidney weights from male pkd2(+/+) mice (open circles) were relatively consistent (r2= 0.70; regression line is shown). In contrast, left and right kidney weights in male pkd2(WS25/−) mice (closed circles) varied significantly (r2 = 0.19; line not shown). This variation did not appear to have a left or right preference.
Fig. 5.
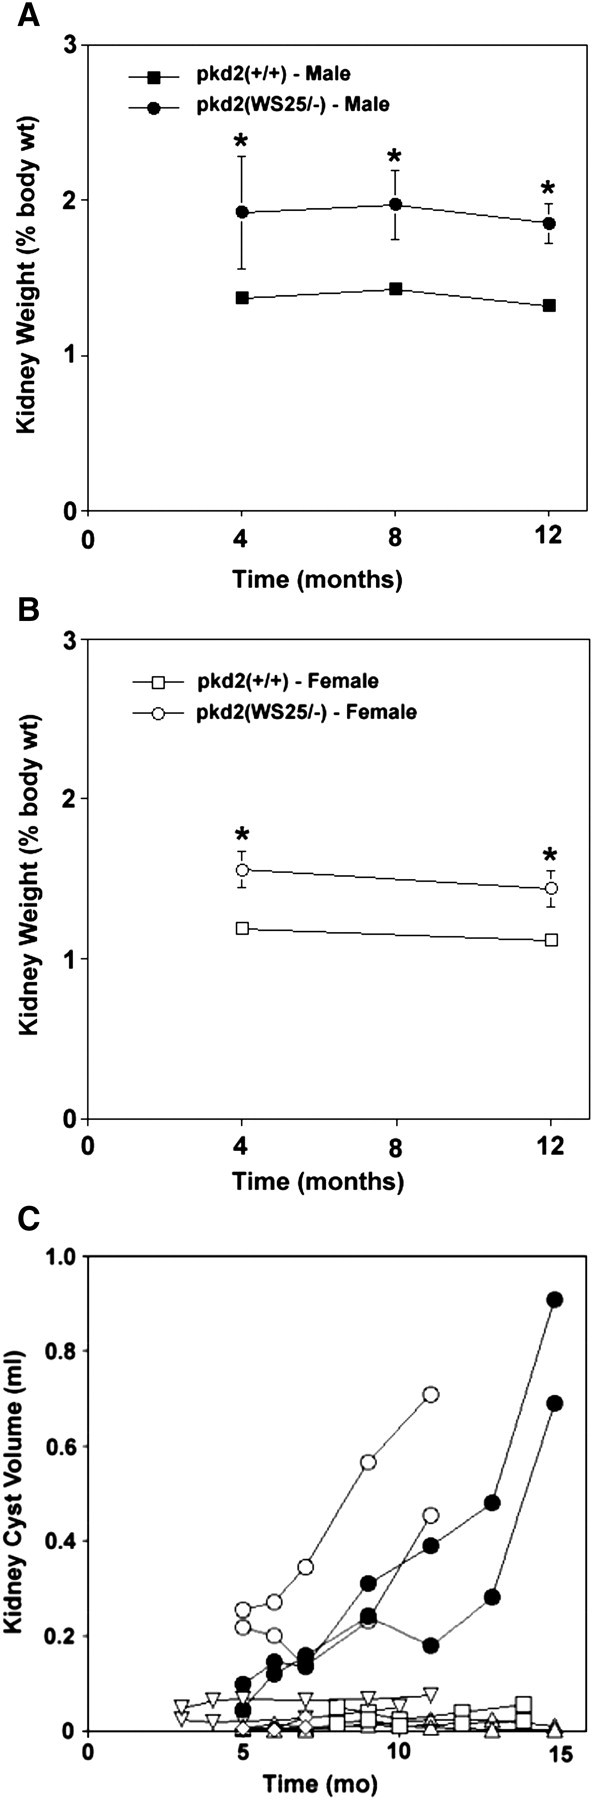
Temporal changes in kidneys in pkd2(WS25/−) mice. (A) Kidney weights in male pkd2(WS25/−) mice (closed circles) were significantly greater than kidney weights in pkd2(+/+) mice (closed squares) after 4 months. The comparative difference in pkd2(WS25/−) mice versus pkd2(+/+) mice remained constant after 8 and 12 months of age. (B) Kidney weights in female pkd2(WS25/−) mice (open circles) were significantly greater than kidney weights in pkd2(+/+) mice (open squares) at 4 months of age. This comparative difference remained relatively constant at 12 months of age. (C) FISP-MRI-determined kidney cyst volumes in a male pkd2(WS25/−) mouse (closed circle) were progressively increased between 5 and 15 months of age. Kidney cyst volumes in female pkd2(WS25/−) mice (open symbols) were measurable, but minimal, with little increase in volume in four of five mice. One female pkd2(WS25/−) mouse (open circles) had large cyst volumes at 5 months of age and showed marked rates of increase between 5 and 11 months of age in both kidneys.
Table 1.
Gravimetric organ measurements in pkd2 mice
| Female |
Male |
||||||
|---|---|---|---|---|---|---|---|
| Months | (+/+) | (WS25/−) | P-value | (+/+) | (WS25/−) | P-value | |
| 4 | n | 14 | 9 | 10 | 12 | ||
| Body weight (g) | 24.2 + 0.8 | 24.1 + 0.7 | 31.4 + 0.9 | 28.5 + 0.6 | |||
| Kidney weight (g) | 0.29 + 0.01 | 0.38 + 0.03 | * | 0.43 + 0.03 | 0.55 + 0.10 | NS | |
| % BW | 1.19 + 0.02 | 1.56 + 0.11 | * | 1.37 + 0.04 | 1.92 + 0.36 | * | |
| Liver weight (g) | 1.14 + 0.06 | 1.20 + 0.09 | NS | 1.51 + 0.07 | 1.47 + 0.09 | NS | |
| % BW | 4.54 + 0.10 | 4.96 + 0.14 | * | 4.77 + 0.08 | 5.08 + 0.29 | NS | |
| 8 | n | 10 | 11 | ||||
| Body weight (g) | 39.1 + 1.7 | 38.1 + 2.5 | |||||
| Kidney weight (g) | 0.56 + 0.03 | 0.72 + 0.06 | * | ||||
| % BW | 1.43 + 0.03 | 1.97 + 0.22 | * | ||||
| Liver weight (g) | 1.79 + 0.06 | 2.73 + 0.59 | NS | ||||
| % BW | 4.61 + 0.08 | 6.81 + 1.00 | * | ||||
| 12 | n | 6 | 4 | 17 | 21 | ||
| Body weight (g) | 32.0 + 2.0 | 29.9 + 2.9 | 40.4 + 1.8 | 41.7 + 4.6 | |||
| Kidney weight (g) | 0.36 + 0.02 | 0.43 + 0.05 | NS | 0.53 + 0.02 | 0.77 + 0.11 | * | |
| % BW | 1.12 + 0.01 | 1.44 + 0.11 | * | 1.32 + 0.05 | 1.85 + 0.13 | * | |
| Liver weight (g) | 1.31 + 0.09 | 1.62 + 0.35 | NS | 1.86 + 0.10 | 6.26 + 1.04 | * | |
| % BW | 4.01 + 0.06 | 5.41 + 1.11 | * | 4.64 + 0.20 | 14.76 + 2.25 | * | |
NS, not significant; *P < 0.05.
Livers in pkd2(WS25/−) mice display long-term cyst progression
Liver growth patterns in pkd2(WS25/−) mice are distinct from the kidney growth patterns. At 4 months of age, liver weights in female pkd2(WS25/−) mice increased by <10% and no significant difference was measured in the livers of the male counterparts (Figure 6A and B; Table 1). In 12-month-old female mice, pkd2(WS25/−) liver weights were modestly increased by 35% when compared to pkd2(+/+) mice. Male pkd2(WS25/−) mice, however, showed a striking rate of liver weight increase after 8 (∼50% increase over w.t.) and 12 months of age (>300% increase over w.t.). Liver cyst volumes in pkd2(WS25/−) mice mirrored and advanced these findings (Figure 6C). The liver cyst volume in the male pkd2(WS25/−) mouse was 0.318 mL at 5 months of age, ∼20% greater than the normal mouse liver volume. This volume increased modestly after 6 and 7 months of age. Between 7 and 15 months of age, however, the liver cysts underwent an accelerated rate of increase in volume. After 15 months of age, the liver cyst volume was 9.535 mL or over five times the volume of normal mouse livers. The liver cyst volumes in female pkd2(WS25/−) mice showed a similar pattern of growth as the male pkd2(WS25/−) mouse, but the onset was delayed in two of the mice. All five female mice had modest liver cyst volumes during the first 9 months of age. After 11 months, however, two of the female pkd2(WS25/−) mice had a similar accelerated growth rate that was present in the male pkd2(WS25/−) liver. The liver cyst volumes in the other two female mice were increasing in volume in a manner that suggested they were following a similar but delayed pattern of volume increase.
Fig. 6.
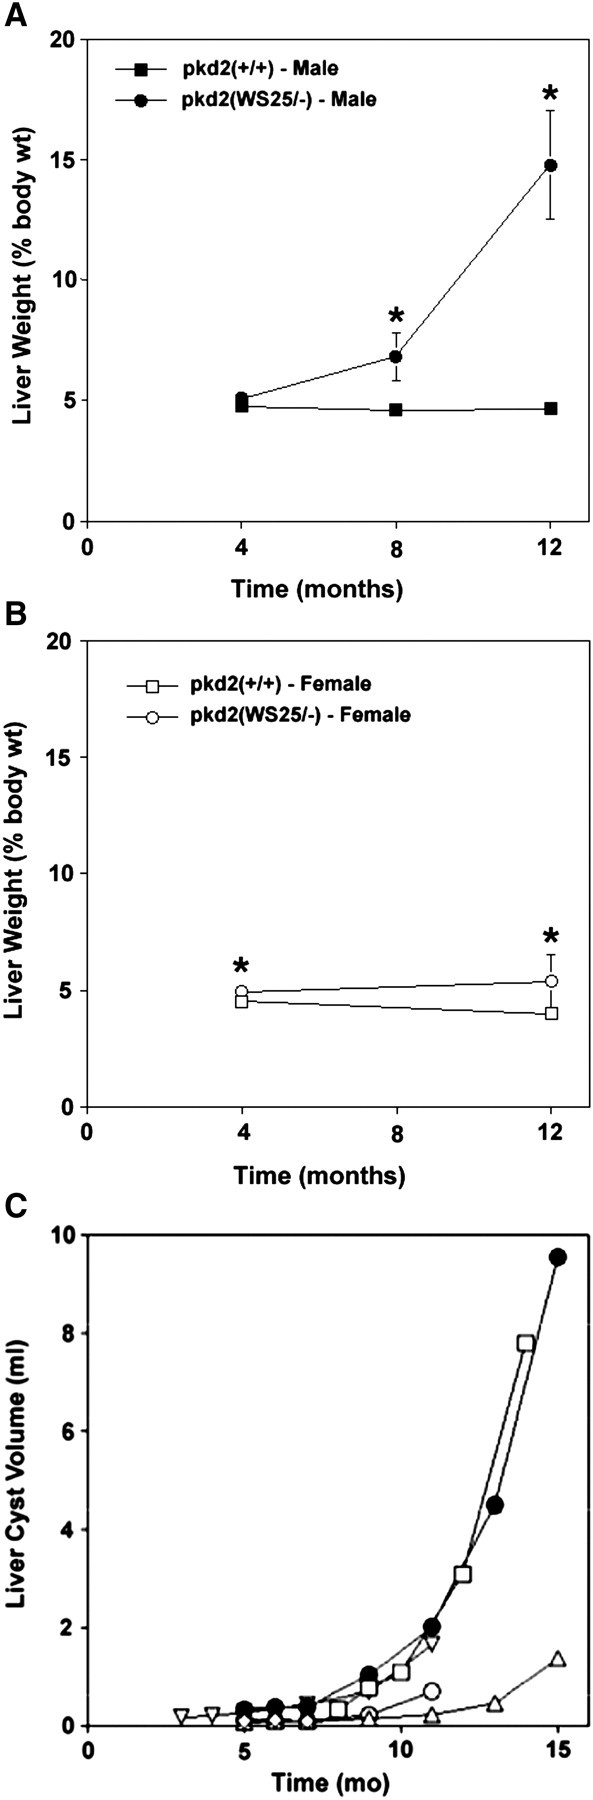
Temporal changes in livers in pkd2(WS25/−) mice. (A) At 4 months of age, liver weights in male pkd2(WS25/−) mice (closed circles) were not significantly different than those from pkd2(+/+) mice (closed squares). At 8 months of age, there was a significant increase in liver weights in male pkd2(WS25/−) mice and an even more dramatic increase after 12 months of age. (B) At 4 months of age, liver weights in female pkd2(WS25/−) mice (open circles) were significantly but minimally greater than liver weights in pkd2(+/+) mice (open squares). There was little increase in female pkd2(WS25/−) liver weights between 4 and 12 months of age. (C) The liver cyst volume in the male pkd2(WS25/−) mouse (closed circles) was modest up through 7 months of age but underwent progressive increases in volume between 9 and 15 months of age. Female pkd2(WS25/−) mice (open symbols) had modest liver cyst volumes during the initial 9 months of life but then also began to display progressive increases in cyst volumes.
Patterns of parenchymal volume changes are different in pkd2(WS25/−) kidneys and liver
In human ADPKD kidneys, non-cystic kidney mass (∼parenchymal mass) has been reported to increase modestly [4], remain relatively constant [5] or decrease [3] with disease progression. The parenchyma in pkd2(WS25/−) mouse kidneys showed a modest but variable decrease in mass when compared to the kidney masses in wild-type mice of the same age (Figure 7A). The parenchymal mass of human ADPKD livers remains relatively constant during disease progression [8]. Similarly, liver parenchymal volumes in pkd2(WS25/−) mice increased in mass at a rate that mirrored the gains in liver mass in pkd2(+/+) mice between 5 and 11 months of age (Figure 7B).
Fig. 7.
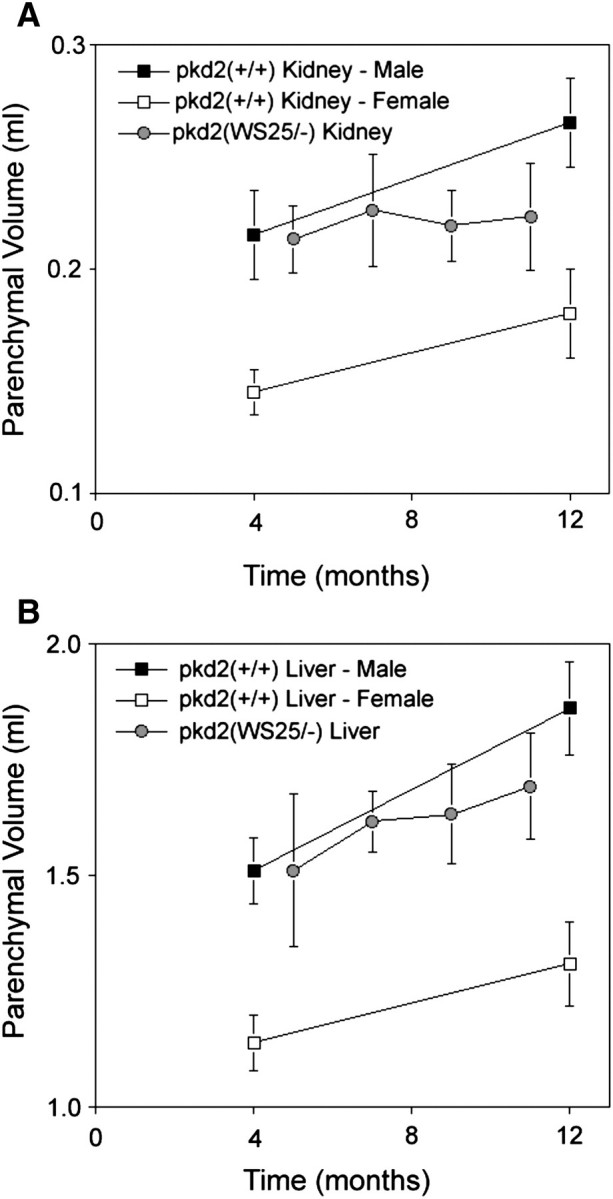
Longitudinal assessment of parenchymal volumes in pkd2(WS25/−) mice. Kidneys and livers in male pkd2(+/+) mice (closed squares) and female pkd2(+/+) mice (open squares) increased in mass between 4 and 12 months of age. (A) MRI-determined kidney parenchymal volumes (grey circles; one male, three to four females) appeared relatively constant but variable between 5, 7, 9 and 11 months of age. (B) MRI-determined liver parenchymal volumes (grey circles; one male, three to four females) appeared to increase at a rate similar to the rate of liver mass increase seen in wild-type mice.
Discussion
The present study makes two significant contributions. Firstly, the study describes and validates the efficacy of FISP-MRI in the rapid and quantitative imaging of kidney and liver cysts in mice. Secondly, the study characterized and compared the long-term patterns and sex dependence of kidney and liver cyst growth in pkd2(WS25/−) mice, an important genetic mouse model of human ADPKD.
FISP-MRI allows longitudinal quantitation of kidney and liver cyst growth
Non-invasive imaging of kidneys and liver is pivotal in the diagnosis and evaluation of ADPKD patients [17]. More recently, it has advanced the ability of investigators to monitor the efficacy of putative medical therapies. Ultrasound has historically been the primary imaging modality for ADPKD diagnosis [18] but has limited spatial resolution and limited quantitative utility [19]. With its high resolution and capacity for quantitative and longitudinal measurements [3–7], CT and MRI are becoming the primary imaging modalities in the long-term care of ADPKD patients. Paralleling these clinical advancements, MRI techniques have been applied in experimental mouse models to follow the onset and progression of kidney cyst growth [20–23]. The present study is the first report on MRI imaging of liver cysts in mice, demonstrates the accuracy in measuring kidney and liver cyst volumes and promotes the case for incorporating FISP-MRI into long-term mouse studies of ADPKD. Importantly, longitudinal FISP-MRI should reduce the number of required animals and help minimize the inter-animal variability that has historically confounded studies in models of cyst disease.
Pkd2(WS25/−) mice as a model of kidney cyst growth in human ADPKD patients
Through their genetic design, pkd2(WS25/−) mice mimic the molecular recessive nature of human ADPKD [10]. Previous studies have shown that cysts are present in both kidneys and liver in all pkd2(WS25/−) mice that are >10 weeks of age [10] and indicated that cyst volumes appear to increase over time [24], though the pattern of this progression had not been delineated. Furthermore, gender differences in kidney and liver cyst growth have not been previously described in pkd2(WS25/−) mice.
In human ADPKD patients, longitudinal CT studies on a limited number of subjects found kidney volumes increased by ∼50 mL/year [3,4]. The kidney cyst growth has been reported elsewhere to have an apparent exponential rate of growth [25]. While ADPKD kidney cyst disease is more severe in men versus women, both men and women have a similar pattern of cyst growth. The present study indicates that pkd2(WS25/−) mice are an excellent model to study the initial effects of kidney cystogenesis. During their first 4 months of life, male and female pkd2(WS25/−) mice showed 40 and 31% increases in kidney weights, respectively (Figure 4). This percentage increase in weight provides an appropriate window to evaluate the effects of therapeutic interventions. Organ weights are relatively consistent in wild-type mice (Table 1) but were more variable in pkd2(WS25/−) mice. Supported by the longitudinal cyst volume measurements, this variability is likely impacted by the timing of WS25 recombination/cystogenesis, the number of cells with WS25 recombination events and the rate of individual cyst growth in pkd2(WS25/−) mice. When performing pre-study power analyses, investigators should take into account this variability in the pkd2(WS25/−) mice. Pkd2(WS25/−) mice may be more limited as a model to characterize the later kidney cyst growth associated with disease progression. While cystic kidneys in individual mice had accelerated rates of volume increase, there was no significant increase in kidney weights between 4 and 12 months of age across a population of pkd2(WS25/−) mice (Figure 4).
Pkd2(WS25/−) mice as a model of liver cyst growth in human ADPKD patients
In human ADPKD, over 50% of ADPKD subjects under 25 years of age have discernible liver cysts [9]. This number exceeds 90% in ADPKD subjects over 35 years of age. Liver cyst volumes in ADPKD patients also increase with advancing age, but the rates are markedly variable between individuals. Importantly, it is the emergence and growth of the grossly cystic livers in a subset of ADPKD patients over 40 years of age that accounts for the bulk of the morbidity and mortality of the liver manifestations of ADPKD. The present studies demonstrate that male pkd2(WS25/−) mice reproducibly develop grossly cystic livers and may serve as an excellent model to identify molecular and cellular pathways that can drive the late term progression of liver cyst growth.
An area where there is disparity in the pkd2(WS25/−) mouse modelling of human ADPKD liver disease is in sex dependence. In human ADPKD, women have much more severe liver cyst disease and there is a strong positive correlation between oestrogen exposure and ADPKD liver cyst growth [26,27]. Comparative MRI studies [9] have found that women between the ages of 35 and 45 years had significantly greater average liver cyst volumes than their male counterparts and a greater propensity to have grossly cystic livers. Female pkd2(WS25/−) mice, however, had a modest increase in liver weight after 12 months of age and an apparent delayed increase in liver cyst volumes when compared with male pkd2(WS25/−) mice. The mechanisms responsible for the delayed liver cyst progression in female pkd2(WS25/−) mice versus female human ADPKD patients remains to be determined and constrains the use of pkd2(WS25/−) mice in studies directed at understanding the role of oestrogen in driving ADPKD liver cyst growth.
Conclusion
In summary, FISP-MRI provides a rapid, sensitive and accurate method to quantitatively measure cyst, organ and parenchymal volumes in mouse kidneys and liver. Pkd2(WS25/−) mice, a genetic homologue of human ADPKD, closely model the phenotypic characteristics of early kidney cystogenesis in human ADPKD. While male pkd(WS25/−) mice have a limited capacity to investigate the contributions of oestrogen in human ADPKD liver cyst disease, they do have a robust liver cyst growth phenotype that can be used to study other contributing mechanisms that underlie long-term cyst progression in human ADPKD livers.
Supplementary Material
Acknowledgments
Initially developed and characterized in Stefan Somlo's laboratory (Yale University), pkd2(WS25/−) breeding pairs were graciously provided for this study. This work was supported, in part, by a UC-Denver Chancellor's Bridge Grant and an investigator-initiated grant from Wyeth Pharmaceuticals (R.B.D.), NIH P30 CA046934 and UL1 RR025780 grants (N.J.S.) and NIH DK-056851 and DK-074835 (C.L.E.).
Supplementary data
Supplementary data are available online at http://ndt.oxfordjournals.org.
Conflict of interest statement. None declared.
References
- 1.Harris PC, Torres VE. Polycystic kidney disease. Annu Rev Med. 2009;60:321–337. doi: 10.1146/annurev.med.60.101707.125712. [DOI] [PMC free article] [PubMed] [Google Scholar]
- 2.Wall WJ. Liver transplantation for polycystic liver disease. N Engl J Med. 2007;356:1560. doi: 10.1056/NEJMicm055470. [DOI] [PubMed] [Google Scholar]
- 3.King BF, Reed JE, Bergstrahl EJ, Sheedy PF, Torres VE. Quantification and longitudinal trends of kidney, renal cyst and renal parenchymal volumes in ADPKD. J Am Soc Nephrol. 2000;11:1505–1511. doi: 10.1681/ASN.V1181505. [DOI] [PubMed] [Google Scholar]
- 4.Sise C, Kusaka M, Wetzel LH, et al. Volumetric determination of progression in ADPKD by computed tomography. Kidney Int. 2000;58:2492–2501. doi: 10.1046/j.1523-1755.2000.00433.x. [DOI] [PubMed] [Google Scholar]
- 5.Chapman AB, Guay-Woodford LM, Grantham JJ, et al. Renal structure in early ADPKD: the consortium for radiologic imaging studies of polycystic kidney disease cohort. Kidney Int. 2003;64:1035–1045. doi: 10.1046/j.1523-1755.2003.00185.x. [DOI] [PubMed] [Google Scholar]
- 6.Lee YR, Lee KB. Reliability of MRI for measuring the volumetric indices in ADPKD: correlation with hypertension and renal function. Nephron Clin Pract. 2006;103:c173–c180. doi: 10.1159/000092915. [DOI] [PubMed] [Google Scholar]
- 7.Kistler AD, Poster D, Krauer F, et al. Increases in kidney volume in ADPKD can be detected within 6 months. Kidney Int. 2009;75:235–241. doi: 10.1038/ki.2008.558. [DOI] [PubMed] [Google Scholar]
- 8.Everson GT, Scherzinger A, Berger-Leff N, et al. Polycystic liver disease: quantitation of parenchymal and cyst volumes from computed tomography images and clinical correlates of hepatic cysts. Hepatology. 1988;8:1627–1634. doi: 10.1002/hep.1840080626. [DOI] [PubMed] [Google Scholar]
- 9.Bae KT, Zhu F, Chapman AB, et al. MRI evaluation of hepatic cysts in early ADPKD. Clin J Am Soc Nephrol. 2006;1:64–69. doi: 10.2215/CJN.00080605. [DOI] [PubMed] [Google Scholar]
- 10.Wu G, D'Agati V, Cai Y, et al. Somatic inactivation of Pkd2 results polycystic kidney disease. Cell. 1998;93:177–188. doi: 10.1016/s0092-8674(00)81570-6. [DOI] [PubMed] [Google Scholar]
- 11.Serkova NJ, Van Rheen Z, Tobias M, Pitzer JE, Wilinson JE, Stringer KA. Utility of MRI and NMR-based metabolomics for quantification of inflammatory lung injury. Am J Physiol. 2008;295:L152–L161. doi: 10.1152/ajplung.00515.2007. [DOI] [PMC free article] [PubMed] [Google Scholar]
- 12.Troiani T, Serkova NJ, Gustafson KL, et al. Investigation of two dosing schedules of vandetanib (ZD6474) in combination with irinotecan in a human colon cancer xenograft model. Clin Cancer Res. 2007;13:6450–6458. doi: 10.1158/1078-0432.CCR-07-1094. [DOI] [PubMed] [Google Scholar]
- 13.Weidensteiner C, Rausch M, McSheeny PM, Allegrini PR. Quantitative dynamic contrast-enhanced MRI in tumor-bearing rats and mice with inversion recovery TrueFISP and two contrast agents at 4.7 T. J Magn Reson Imaging. 2006;24:646–656. doi: 10.1002/jmri.20676. [DOI] [PubMed] [Google Scholar]
- 14.Herborn CU, Vogt F, Lauenstein TC, Goyen M, Debatin JF, Ruehm SG. MRI of the liver: can true FISP replace HASTE. J Magn Reson Imaging. 2003;17:190–196. doi: 10.1002/jmri.10248. [DOI] [PubMed] [Google Scholar]
- 15.Hecht EM, Lee VS, Tanpitukpongse TP, et al. MRI of pelvic floor dysfunction: dynamic true FISP versus HASTE. AJR Am J Roentgenol. 2008;191:352–358. doi: 10.2214/AJR.07.3403. [DOI] [PubMed] [Google Scholar]
- 16.Pei XL, Xie JX. Functional MRI: evaluation of chronic kidney disease with perfusion imaging. Acad Radiol. 2009;16:88–95. doi: 10.1016/j.acra.2008.07.002. [DOI] [PubMed] [Google Scholar]
- 17.Grantham JJ. Autosomal dominant polycystic kidney disease. N Engl J Med. 2008;359:1477–1485. doi: 10.1056/NEJMcp0804458. [DOI] [PubMed] [Google Scholar]
- 18.Belibi FA, Edelstein CL. Unified ultrasonographic diagnostic criteria for polycystic kidney disease. J Am Soc Nephrol. 2009;20:6–8. doi: 10.1681/ASN.2008111164. [DOI] [PubMed] [Google Scholar]
- 19.Serkova NJ, Garg K, Bradshaw-Pierce EL. Oncologic imaging endpoints for the assessment of therapy response. Recent Pat Anticancer Drug Discov. 2009;4:36–53. doi: 10.2174/157489209787002434. [DOI] [PubMed] [Google Scholar]
- 20.Towner RA, Yamaguchi T, Philbrick FJ, Holub BJ, Janzen EG, Takahashi H. In vivo proton MRI and localized spectroscopic analysis of PKD in DBA/2FG-pcy mice. Magn Reson Imaging. 1991;9:429–434. doi: 10.1016/0730-725x(91)90432-l. [DOI] [PubMed] [Google Scholar]
- 21.Sun Y, Zhou J, Stayner C, et al. MRI assessment of a murine model or recessive polycystic kidney disease. Comp Med. 2002;52:433–438. [PubMed] [Google Scholar]
- 22.Kobayashi H, Kawamoto S, Brechbiel MW, et al. Micro-MRI methods to detect renal cysts in mice. Kidney Int. 2004;65:1511–1516. doi: 10.1111/j.1523-1755.2004.00532.x. [DOI] [PubMed] [Google Scholar]
- 23.Wallace DP, Hou YP, Huang ZL, et al. Tracking kidney volume in mice with polycystic kidney disease by MRI. Kidney Int. 2008;73:778–781. doi: 10.1038/sj.ki.5002771. [DOI] [PubMed] [Google Scholar]
- 24.Wu G, Markowitz GS, Li L, et al. Cardiac defects and renal failure in mice with targeted mutations in Pkd2 mice. Nat Genet. 2000;24:75–78. doi: 10.1038/71724. [DOI] [PubMed] [Google Scholar]
- 25.Grantham JJ, Torres VE, Chapman AB, et al. Volume progression in polycystic kidney disease. N Engl J Med. 2006;354:2122–2130. doi: 10.1056/NEJMoa054341. [DOI] [PubMed] [Google Scholar]
- 26.Gabow PA, Johnson AM, Kaehny WD, Manco-Johnson ML, Duley IT, Everson GT. Risk factors for the development of hepatic cysts in autosomal dominant polycystic kidney disease. Hepatology. 1990;11:1033–1037. doi: 10.1002/hep.1840110619. [DOI] [PubMed] [Google Scholar]
- 27.Shrestha R, Mckinley C, Russ P, et al. Postmenopausal estrogen therapy selectively stimulates hepatic enlargement in women with ADPKD. Hepatology. 1997;26:1282–1286. doi: 10.1002/hep.510260528. [DOI] [PubMed] [Google Scholar]
Associated Data
This section collects any data citations, data availability statements, or supplementary materials included in this article.