Abstract
Iron sulfide was synthesized by reacting aqueous solutions of sodium sulfide and ferrous chloride for 3 days. By X-ray powder diffraction (XRPD), the resultant phase was determined to be primarily nanocrystalline mackinawite (space group: P4/nmm) with unit cell parameters a = b = 3.67 Å and c = 5.20 Å. Iron K-edge XAS analysis also indicated the dominance of mackinawite. Lattice expansion of synthetic mackinawite was observed along the c-axis relative to well-crystalline mackinawite. Compared with relatively short-aged phase, the mackinawite prepared here was composed of larger crystallites with less elongated lattice spacings. The direct observation of lattice fringes by HR-TEM verified the applicability of Bragg diffraction in determining the lattice parameters of nanocrystalline mackinawite from XRPD patterns. Estimated particle size and external specific surface area (SSAext) of nanocrystalline mackinawite varied significantly with the methods used. The use of Scherrer equation for measuring crystallite size based on XRPD patterns is limited by uncertainty of the Scherrer constant (K) due to the presence of polydisperse particles. The presence of polycrystalline particles may also lead to inaccurate particle size estimation by Scherrer equation, given that crystallite and particle sizes are not equivalent. The TEM observation yielded the smallest SSAext of 103 m2/g. This measurement was not representative of dispersed particles due to particle aggregation from drying during sample preparation. In contrast, EGME method and PCS measurement yielded higher SSAext (276–345 m2/g by EGME and 424 ± 130 m2/g by PCS). These were in reasonable agreement with those previously measured by the methods insensitive to particle aggregation.
1. Introduction
Mackinawite (tetragonal FeS) comprises a major fraction of acid-volatile sulfides (Berner, 1964; Rickard, 1974). Due to its chalcophilic nature and reducing capability, mackinawite exhibits high reactivity with a range of chemical species. For example, this mineral phase is known as an effective sorbent for divalent metals (Kornicker, 1988; Morse and Arakaki, 1993; Wharton et al., 2000; Jeong et al., 2007). Also, it has been found to immobilize Cr(VI) through its reduction to the less mobile Cr(III) species (Patterson et al., 1997; Mullet et al., 2004). In addition, mackinawite has been shown to mediate reductive transformation of halogenated organic pollutants (Butler and Hayes, 1998; Butler and Hayes, 2000; Jeong and Hayes, 2003; Jeong and Hayes, 2007).
Mackinawite belongs to P4/nmm space group (Taylor and Finger, 1970). In the mackinawite crystal, each Fe atom is coordinated by four sulfurs in an almost perfect tetrahedron (Taylor and Finger, 1970). These tetrahedrons share edges to form a layer structure (Fig. 1). Within the layers, each Fe atom is in a square coordination with four Fe atoms at a relatively short distance of 2.60 Å, resulting in the metallic conducting property of mackinawite (Taylor and Finger, 1970; Vaughan and Ridout, 1971). These layers are stacked along the c-axis and held together by weak van der Waals forces (Vaughan and Craig, 1978).
Fig. 1.
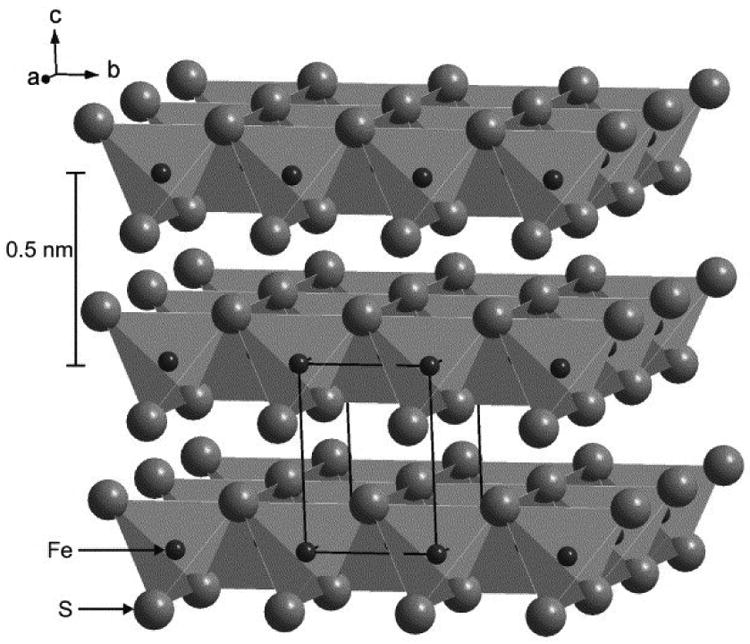
Schematic diagram of mackinawite structure viewed from ∼30° above the (001) plane (Wolthers et al., 2005). The tetragonal unit call is indicated. This figure was reprinted with the permission of Elsevier Science Ltd. (2005).
Amorphous FeS or disordered mackinawite, the initial precipitate formed in anoxic aquatic environments, is thought to be nanocrystalline mackinawite (Rickard et al., 1995; Wolthers et al., 2003). Within days, this initial precipitate develops into a more crystalline phase (Rickard, 1995; Wilkin and Barnes, 1996). However, complete transformation to well-crystalline mackinawite requires up to two years in anoxic solutions at 25°C (Rickard, 1995). Consistent with its nanocrystalline nature, mackinawite is rarely observed in sediments (Morse and Rickard, 2004). Although mackinawite is ultimately transformed to more stable phases such as greigite and pyrite, this mineral can persist for long periods of time under reduced conditions at low temperatures (Berner, 1981; Benning et al., 2000). In general, three approaches have been used to synthesize mackinawite at low temperatures: (1) by reaction of sulfide solution with metallic iron (Berner, 1964), (2) by reaction of sulfide solution with ferrous iron solutions (Rickard, 1969), and (3) via sulfate-reducing bacteria (Watson et al., 2000). The first approach usually leads to more crystalline mackinawite (Lennie and Vaughan, 1996; Mullet et al., 2002). In contrast, the other methods lead to less crystalline phases that are more similar to those found in natural environments (Berner, 1967b; Spadini et al., 2003; Wolthers et al., 2003).
A significant variation in the solubility of mackinawite has been reported (Berner, 1967a; Tewari et al., 1978; Davison et al., 1999; Benning et al., 2000; Wolthers et al., 2005; Rickard, 2006). This suggests that the physicochemical properties of nanocrystalline mackinawite are strongly affected by preparation conditions, which result in differences in the crystal structure and particle size. Thus, characterization of these properties is necessary for evaluating the relative stability and reactivity of nanocrystalline mackinawite. The crystal structure of nanocrystalline mackinawite may deviate from its well-crystalline equivalent. For example, Wolthers et al. (2003) observed significant lattice expansion of their nanocrystalline mackinawite relative to well-crystalline mackinawite. However, determination of the structural properties of nanocrystalline phases is neither simple nor straightforward. For example, determination of the lattice parameters of nanocrystalline phases by X-ray diffraction may be questionable since an infinite periodicity is assumed in this approach (Michel et al., 2005; Rickard and Morse, 2005). Since many properties of nanocrystalline minerals are strongly size-dependent, the particle size of nanocrystalline mackinawite needs to be accurately measured. Also, accurate determination of the specific surface area may be critical for assessing the reactivity of nanocrystalline mackinawite in surface-mediated reactions relative to well-crystalline mackinawite or other minerals. Although the size and specific surface area of nanocrystalline particles have been measured by various techniques, variability in the measured results is frequently encountered due to systematic errors and potential artifacts associated with sample preparation requirements of the commonly used techniques.
In this study, nanocrystalline mackinawite was prepared by reacting solutions containing sulfide and ferrous iron. First, the mineralogical purity and structural properties of this nanocrystalline phase were examined by X-ray powder diffraction (XRPD), X-ray absorption spectroscopy (XAS), and transmission electron microscopy (TEM). The validity of Bragg's law for the determination of the crystal structure of nanoparticles was also evaluated. Second, the size and specific surface area of nanocrystalline mackinawite were estimated by XRPD, TEM, ethylene glycol monoethyl ether (EGME) method, and photon correlation spectroscopy (PCS). The measured results are compared and evaluated in the context of the inherent drawbacks of each technique. The data obtained here provide particle property information needed for assessing the reactivity of nanocrystalline mackinawite in aquatic environments. Although some of these techniques have been previously applied to characterization of nanocrystalline mackinawite, this study presents the first reporting of EGME and PCS methods, an evaluation of Scherrer equation in determining the crystallite size of nanocrystalline mackinawite, and a direct observation of its short- and long-range order by XAS and TEM.
2. Material and Methods
2.1. Mackinawite Synthesis
Anoxic conditions were maintained for all experiments. Mackinawite synthesis was conducted inside an anaerobic chamber (Coy Inc., Grass Lake, MI) with atmospheric composition of 5% H2 in N2. All aqueous solutions were prepared with the deoxygenated water that had been prepared by purging Milli-Q water with high purity N2 for at least 30 min. Mackinawite was prepared by mixing 1.2 L of 1.1 M Na2S solution with 2.0 L of 0.57 M FeCl2 solution (Butler and Hayes, 1998). The resultant mixture contained a slight excess amount of sulfide, thus preventing soluble ferrous species from precipitating as an iron hyr(oxide) phase and adsorbing on the mackinawite precipitate (Jeong, 2005). The precipitate was allowed to age for 3 days by vigorous mixing with a magnetic stirrer. The supernatant was removed after centrifuging at 10,000 rpm for 15 min, and then the precipitate was washed with deoxygenated water. This solid rinsing procedure was repeated a total of eight times. Subsequently, the solid was freeze-dried under vacuum. Potential changes in surface properties of mackinawite by freeze-drying were found to be recovered by particle resuspension as noted by Ohfuji and Rickard, 2006. The freeze-dried samples were ground in a mortar, sealed in glass vials capped with Teflon-coated rubber septa, and stored inside the anaerobic chamber until used for subsequent analysis. When taken out from the chamber for the analysis of XRPD, XAS, and TEM, all samples were kept in sealed vials or vacuum desiccators to minimize oxygen exposure during the transfer.
2.2. X-ray Powder Diffraction (XRPD)
Prior to the diffraction data collection, synthetic mackinawite was divided into magnetic and non-magnetic portions by a hand magnet inside the anaerobic chamber. The diffraction patterns of these two portions were obtained from a Rigaku 12 kW rotating anode generator at 40 kV and 100 mV with Cu-Kα radiation. Diffraction data were collected in the range of 10° < 2θ < 75° at a rate of 0.05° 2θ per sec. Although no special measure was taken, a comparison of the repeated scans indicated that the minimal oxidation had occurred during the data collection. A diffraction pattern was also obtained for LaB6 powders to account for instrumental broadening effect in the crystallite size determination. For detailed structure information, the diffractograms were analyzed using JADE7 (Materials Data Inc.). From the diffraction patterns, the background was subtracted out using polynomial fitting. Also, Kα2 diffraction components were removed. Peak positions and widths were determined by fitting the diffraction patterns with Pearson VII functions.
2.3. X-ray Absorption Spectroscopy (XAS)
A sample for X-ray absorption spectroscopy (XAS) was prepared by applying the mackinawite powder as a thin, uniform layer to Kapton tape inside the anaerobic chamber. The sample was brought into a sample holder box that was continuously purged with He gas. Iron K-edge X-ray absorption spectra of the sample were obtained using a Si(220) monochromator at beam line 4-3 in the Stanford Synchrotron Radiation Laboratory (SSRL). A total of six scans were collected in transmission mode at room temperature. The XAS spectra were quantitatively analyzed using the EXAFSPAK software (George and Pickering, 1995). As indicated by the lack of apparent difference among the spectra (data not shown), the radiation-induced oxidation of mackinawite, if it occurred, was not significant.
2.4. Transmission Electron Microcopy (TEM)
For transmission electron microscopy (TEM) analysis, one gram of the mackinawite powder was resuspended in 1.0 L H2O and dispersed by vigorous magnetic stirring. This suspension was subsequently diluted with N2-purged ethanol. The ethanolic suspension was applied to an ultrathin carbon film on a copper grid (Ted Pella, Inc.) using a micropipette. The sample was dried under vacuum prior to the analysis. TEM images and selected area electron diffraction (SAED) patterns were collected with a JEOL 2010F analytical electron microscope operating at 200 kV.
2.5. Ethylene Glycol Monoethyl Ether (EGME) Method
Ethylene Glycol Monoethyl Ether (EGME) method (Carter et al., 1965) was used to measure the surface area of synthetic mackinawite. This method involved wetting the mackinawite powder with ethylene glycol monoethyl ether (a polar liquid), equilibrating, and removing the excess liquid by evacuation. The sample was periodically weighed until a constant mass was reached. Then, the surface area was calculated from the mass of the retained liquid, assuming that a monomolecular layer of this liquid formed on the surface with its molecular coverage of 52×10-16 cm2/molecule (Carter et al., 1965). The detailed procedure of this method is described in the Appendix. In parallel, the surface area of Ca-montmorillonite (SAz-1, obtained from the Source Clay Mineral Repository at the University of Missouri at Columbia) was measured as a reference.
2.6. Photon Correlation Spectroscopy (PCS)
One gram per liter of aqueous mackinawite suspension was prepared using two deagglomeration methods, magnetic stirring and sonication. Although the size measurement by photon correlation spectroscopy (PCS) is affected by particle aggregation, these sample preparation methods led to similar results, indicating that nanocrystalline mackinawite particles were effectively deagglomerated by both methods. No background salts were added. Since the suspension pH (∼9.3) was far from the point of zero charge of mackinawite (2.9; Wilder and Seward, 2002), this created a stable dispersion of particles, as evidenced by no apparent particle settling over months. The initial suspension was further diluted and analyzed for particle size using a Sub-Micron Particle Analyzer N4 MD (Coulter Electron, Inc., Hialeah, FL) at λ = 632.8 nm and θ = 90° using PCS theory described elsewhere (Quirantes et al., 1996).
3. Results
3.1. Mineralogy and Crystal Structure
3.1.1. XRPD
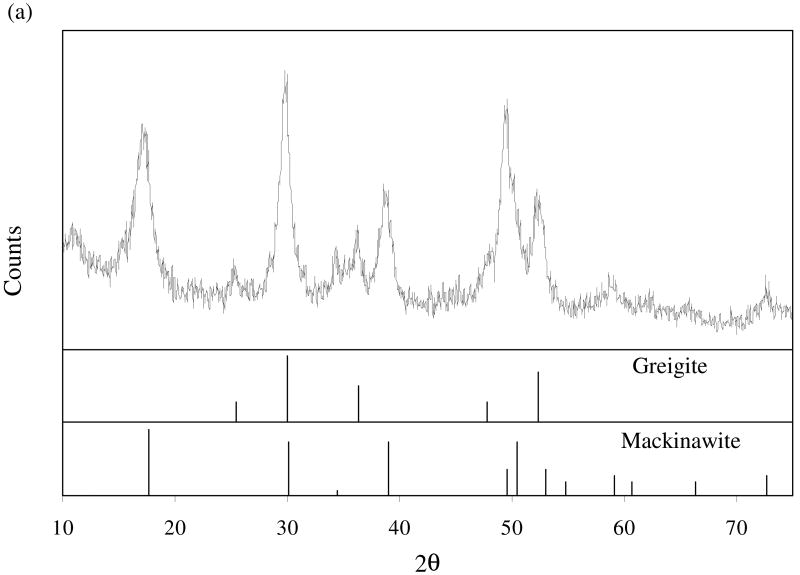
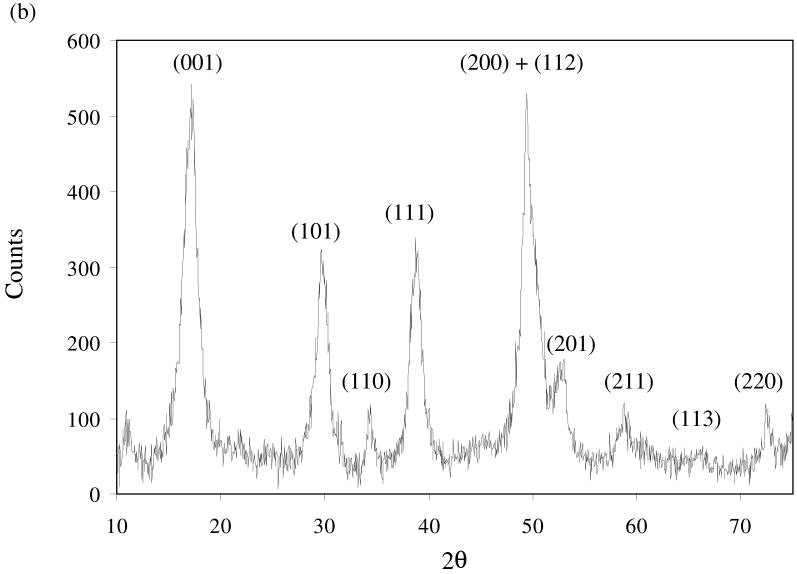
Of the total mass produced, the magnetic portion accounted for 6%, with the remainder being non-magnetic. Fig. 2 shows the diffractograms of the magnetic portion (a) and the non-magnetic portion (b). In both diffractograms, the diffraction peaks are broad and weak, indicating a poor degree of crystallization or a small crystallite size. For the non-magnetic portion, the diffraction patterns are similar to those previously reported for synthetic mackinawite (Rickard, 1969; Wolthers et al., 2003). For the magnetic portion, the diffraction patterns correspond to those of mackinawite and greigite. While greigite (cubic Fe3S4) exhibits a strong ferrimagnetism (Vaughan and Ridout, 1971), mackinawite is paramagnetic (Vaughan and Craig, 1978). Therefore, the detection of mackinawite in the magnetic portion (Fig. 2a) suggests its close structural relationship with greigite.
Fig. 2.
X-ray diffraction patterns for the magnetic portion (a) and the non-magnetic portion (b) of synthetic mackinawite. In part (a), the diffraction data for reference minerals are obtained from JADE7 (Materials Data Inc.). In part (b), the diffraction peaks are indexed for mackinawite.
The lattice spacings were derived from the diffractogram of the non-magnetic portion (Fig. 2b) and summarized in Table 1. The mackinawite phase prepared here exhibits significantly elongated lattice spacings compared with well-crystalline mackinawite (Lennie at al., 1995). The lattice expansion relative to well-crystalline mackinawite has been observed and attributed to both intercalation of water molecules between the layers of mackinawite and lattice relaxation with decreasing crystallite size (Wolthers et al., 2003). Compared with the mackinawite prepared by Wolthers et al. (2003), the lattice spacings of synthetic mackinawite in this study are shorter. The 3-day aging in this study resulted in a higher degree of crystallization than the shorter aging in their study (< 0.5 h). The prior study also showed that the lattice spacings of mackinawite decreased with aging time.
Table 1.
Comparison of X-ray diffraction data for various mackinawite phases
| hkl | Synthetic Mka | Synthetic MkAb | Synthetic MkBb | Crystalline Mkc | ||||
|---|---|---|---|---|---|---|---|---|
| d (Å) | I/Io (%) | d (Å) | I/Io (%) | d (Å) | I/Io (%) | d (Å) | I/Io (%) | |
| 001 | 5.196 | 100 | 6.60 | 100 | 5.48 | 100 | 5.0328 | 100 |
| 101 | 2.989 | 42 | 3.33 | 51 | 3.36 | 41 | 2.9672 | 50 |
| 110 | 2.617 | 4 | 2.84 | 27 | 2.58 | 7 | 2.5976 | 8 |
| 111 | 2.323 | 38 | 2.42 | 41 | 2.3 | 47 | 2.3082 | 70 |
| 200 | 1.845 | 37 | 2.00 | 35 | 1.95 | 10 | 1.8368 | 38 |
| 112 | 1.809 | 92 | 1.88 | 52 | 1.83 | 29 | 1.8074 | 82 |
| 201 | 1.730 | 19 | 1.77 | 50 | 1.73 | 23 | 1.7254 | 29 |
| 003 | 1.84 | 44 | 1.81 | 30 | 1.6776 | 9 | ||
| 211 | 1.579 | 16 | 1.63 | 21 | 1.57 | 12 | 1.5617 | 12 |
| 103 | 1.5260 | 6 | ||||||
| 220 | 1.306 | 14 | 1.2988 | 11 | ||||
Non-magnetic portion of synthetic mackinawite aged for 3 days (this study).
Synthetic mackinawite aged for < 0.5 h (Wolthers et al., 2003).
Well-crystalline mackinawite (Lennie at al., 1995).
As can be seen in Fig. 2b, the reflection peaks of (001), (101), and (111) are intense and distinct, while the other peaks are either weak or significantly overlapping. Therefore, only these three peaks were used to extract the unit cell parameters of mackinawite (a = b ≠ c for tetragonal system) as follows:
| (1) |
The unit cell parameters obtained are compared with those from other mackinawite phases in Table 2. The nanocrystalline mackinawite in this study has the unit cell dimensions along the a- and b-axes comparable to well-crystalline mackinawite, with a slightly elongated value along the c-axis. Using the unit cell parameters in Table 2, the density of the nanocrystalline mackinawite was calculated (4.37 g/cm3) and used for estimation of the specific surface area.
Table 2.
Unit cell parameters for synthetic mackinawite
| a = b (Å) | c (Å) | |
|---|---|---|
| Synthetic Mka | 3.67 | 5.20 |
| Synthetic MkAb | 4.02 | 6.60 |
| Synthetic MkBb | 3.65 | 5.48 |
| Crystalline Mkc | 3.6735(4) | 5.0328(7) |
Synthetic mackinawite aged for 3 days (this study).
Synthetic mackinawite aged for < 0.5 h (Wolthers et al., 2003).
Well-crystalline mackinawite (Lennie at al., 1995).
3.1.2. XAS
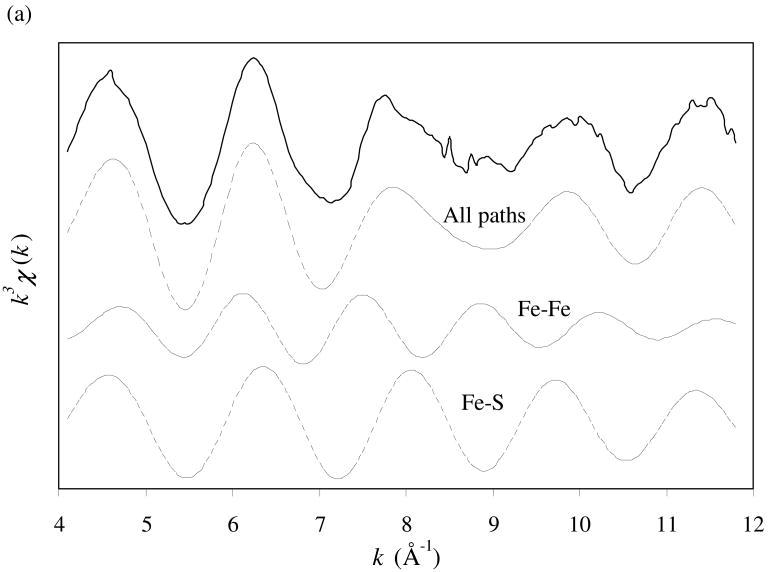
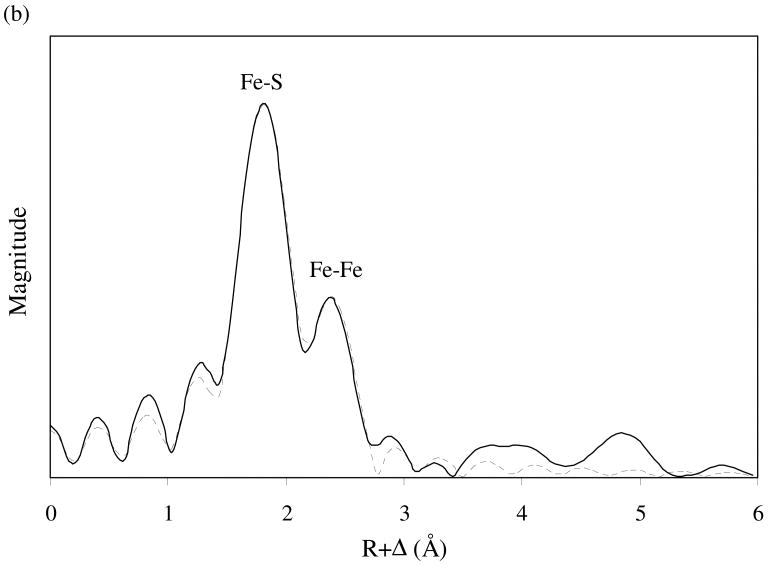
Iron K-edge X-ray absorption spectroscopy (XAS) data were collected. X-ray absorption near-edge structure (XANES) analysis provides the qualitative information on the local coordination environment around iron, whereas X-ray absorption fine structure (EXAFS) analysis allows the quantitative determination of the bonding distances and coordination numbers of neighboring atoms around iron. The iron K-edge XANES spectra of synthetic mackinawite (data not shown) feature a sharp pre-edge below the absorption edge, indicating tetrahedral coordination of sulfur atoms around Fe atom (Waychunas et al., 1983). The k3-weighted iron K-edge EXAFS spectrum of synthetic mackinawite and the corresponding Fourier transform are presented in Fig. 3. The structural parameters were determined by fitting the data using FEFF 8.10 (Ankudinov et al., 2000). As shown in Fig. 3, the experimental data are comprised of at least two main coordination shells around iron. The first shell is characterized by four sulfurs at 2.24 Å around the central Fe atom, and the second shell by four irons at 2.63 Å around the central Fe atom. These distances are in close agreement with those previously reported for mackinawite (Taylor and Finger, 1970). Moreover, the short distance for the Fe-Fe pairs is consistent with the metallic property of mackinawite (Vaughan and Ridout, 1971; Kjekshus et al., 1972). Consistent with the XRPD observation, little contribution of greigite is found in the iron K-edge EXAFS spectrum of synthetic mackinawite, ruling out significant formation of greigite as an amorphous phase or an embedded form within the mackinawite crystals.
Fig. 3.
k3-weighted iron K-edge EXAFS spectrum of synthetic mackinawite (a) and the corresponding Fourier transform (b). The solid lines represent the experimental data, and the dashed lines represent the best model fit. In part (a), the components of the model fit are included.
3.1.3. TEM
Fig. 4 shows the selected area electron diffraction (SAED) pattern (a) and HR-TEM image (b) of synthetic mackinawite. Consistent with the XRPD pattern, the SAED pattern matches that of mackinawite. As shown in Fig. 4a, no distinct ring is observed for (001) reflection (only spots). This is due to a preferential deposition of mackinawite particles with their basal plane lying parallel to the TEM grid. The other reflections exhibit weak and diffuse Debye rings with strong and distinct spots, indicative of single crystal diffraction. These results suggest different degrees of crystallization for synthetic mackinawite in this study. For example, a small fraction of well-crystalline particles could be present with randomly oriented poorly-crystalline particles.
Fig. 4.
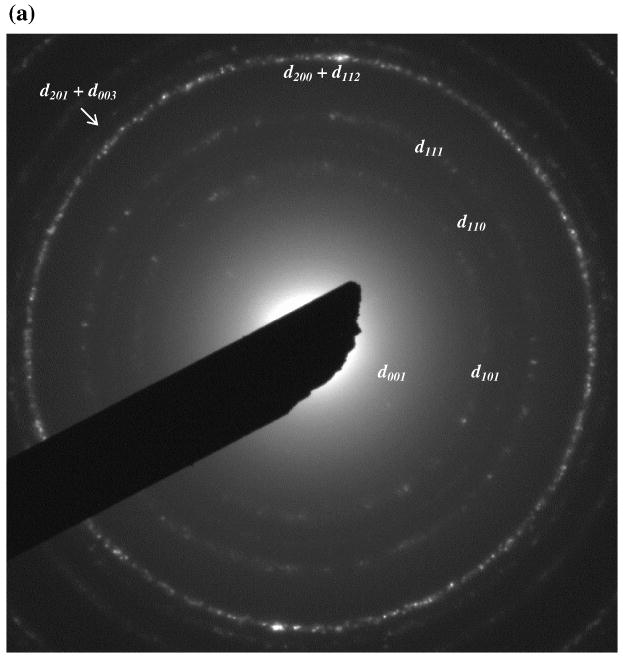
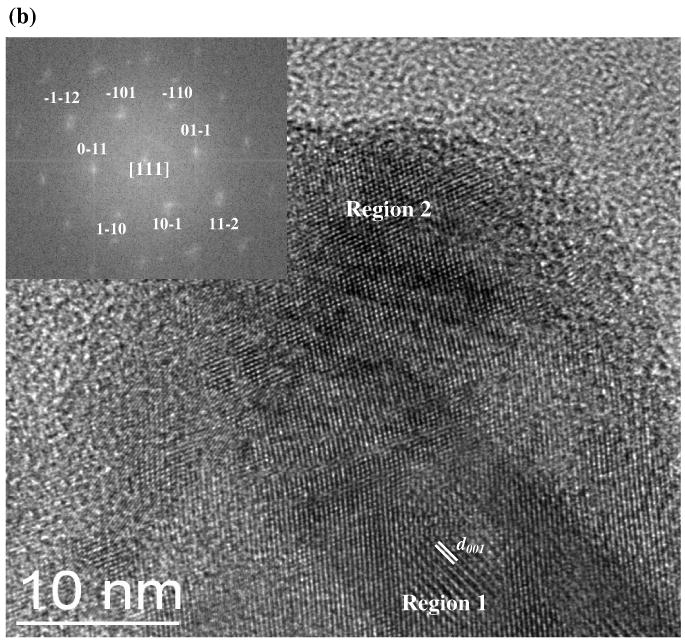
SAED pattern (a) and HR-TEM image (b) of synthetic mackinawite. In part (a), the Debye-rings are indexed for mackinawite. The fast-Fourier transform of Region 2 is presented in the inset of part (b).
The HR-TEM image of synthetic mackinawite is shown in Fig. 4b, where particles overlap with each other, making it difficult to identify particle boundaries. The layered structure characteristic of mackinawite is clearly shown by a crystal with its basal (001) plane perpendicular to the grid (see Region 1, Fig. 4b). From these intensity modulations, the unit cell parameter along the c-axis was determined to be 5.3 Å. Although relatively weak compared with the (001) lattice fringes, other lattice fringes with smaller spacings were also observed. As indicated by the fast-Fourier transform of Region 2 (see inset in Fig. 4b), a crystal in Region 2 is aligned with the zone axis [111] parallel to the beam direction, with d101, d110, and d112 located at 3.1 Å, 2.7 Å, and 1.9 Å, respectively. Notably, the directly observed lattice fringes by HR-TEM are only slightly larger than the lattice spacing extracted from XRPD analysis. Considering the resolution of HR-TEM, such small differences (∼0.1 Å) may be insignificant.
3.2. Particle Size and Specific Surface Area
3.2.1. XRPD
Crystallite size (i.e., the coherently diffracting domain) can be estimated using Scherrer equation:
| (2) |
where Dhkl is the length of the crystallite in a direction perpendicular to the reflection planes (hkl), K is the Scherrer constant, β is a measure of the line broadening, λ is the wavelength of the X-ray, and θ is the angular position of the reflection peak. The Scherrer constant depends on the choice of the line broadening: K = 0.9 when full-width at half-maximum (FWHM) is used, while K = 1.05 when integral breadth (IB) is used (Klug and Alexander, 1974). As discussed later, the K value is also dependent on particle size distribution (Langford and Wilson, 1978). For example, the appropriate K value was reported to be as low as 0.5 for highly polydispersed samples (Pielaszek, 2003). Using Eqn. (2), the crystallite dimensions of synthetic mackinawite were determined for the intense and distinct reflection peaks as follows: D001 = 5.2 nm, D101 = 6.1 nm, and D111 = 6.6 nm by FWHM at K = 0.9; D001 = 4.3 nm, D101 = 5.8 nm, and D111 =6.8 nm by IB at K = 1.05; and D001 = 2.9 nm, D101 = 3.4 nm, and D111 = 3.7 nm by FWHM at K = 0.5. The variation of Dhkl suggests a size-dependence of the mackinawite crystallites on the crystallographic orientation. Further, the relative order of D001 < D101 < D111 suggests that the crystallite of synthetic mackinawite is more elongated along the a-axis (or b-axis) than the c-axis. Given that the dimension of the mackinawite crystallites along the c-axis (Dc) is equal to D001, the dimension along the a-axis (or b-axis) (Da = Db) was calculated using D101 and D111 by the following relationships (Jeong, 2005):
| (3) |
| (4) |
| (5) |
where a, b, and c are the unit cell parameters, and h, k, and l are the Miller indices. The average crystallite dimensions were 7.0 nm × 7.0 nm × 5.2 nm by FWHM at K = 0.9, 8.0 nm × 8.0 nm × 4.3 nm by IB at K = 1.05, and 3.9 nm × 3.9 nm × 2.9 nm by FWHM at K = 0.5. Using the crystallite dimensions of the nanocrystalline mackinawite, the specific surface area associated with its external surfaces (SSAext) was estimated as follows
| (6) |
where ρ is the density of the nanocrystalline mackinawite (4.37 g/cm3). The SSAext values by XRPD analysis are compared with those estimated by other methods in Table 3.
Table 3.
Particle size and SSAext values of nanocrystalline mackinawite by different methods
| Method | Particle dimensiona | SSAext (m2/g) | Reference |
|---|---|---|---|
| XRPD, FWHM (K = 0.9) | 7.0 nm × 5.2 nm | 219 | this study |
| XRPD, IB (K = 1.05) | 8.0 nm × 4.3 nm | 220 | this study |
| XRPD, FWHM (K = 0.5) | 3.9 nm × 2.9 nm | 392 | this study |
| TEM | 21.7 nm × 7.5 nm | 103 | this study |
| EGME | 276b, 294c, 345d | this study | |
| PCS | 3.5 nm | 424 ± 130 | this study |
| BET | 53.0 ± 46.3 | Kornicker (1988) | |
| BET | 36.5 | Rickard (1997) | |
| BET | 0.05 | Butler and Hayes (1998) | |
| BET | 16–21 | Benning et al. (2000) | |
| BET | 80 | Wilder and Seward (2002) | |
| BET | 47 ± 1 | Wolthers et al. (2003) | |
| TEM | 20–400 nm | 4–73 | Wolthers et al. (2003) |
| SEM + XRPD | 10–35 nm | 40–140 | Rickard (1997) |
| Microscopy | 33 nm | 44 | Rickard (1975) |
| HR-TEM | (3–10.8) nm × (2-5.7) nm | 380 ± 10 | Ohfuji and Rickard (2006) |
| LAXRPD | 4.2 ± 0.5 nm | 350 | Wolthers et al. (2003) |
For single numbers, diameter is given; for paired numbers, length is followed by thickness.
Nc is estimated by FWHM at K = 0.9.
Nc is estimated by IB at K = 1.05.
Nc is estimated by FWHM at K = 0.5.
3.2.2. TEM
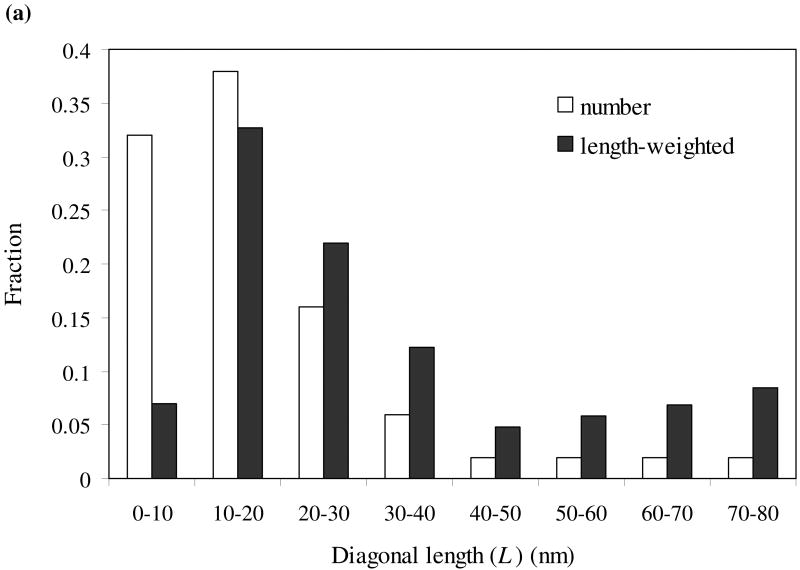
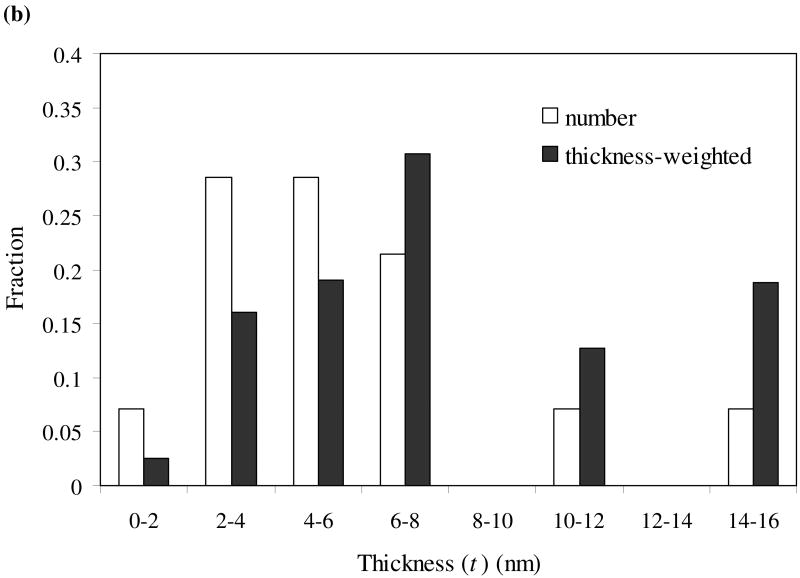
As shown from the TEM image in Fig. 5a, the mackinawite nanoparticles are irregularly shaped and strongly aggregated, with most particles oriented with the basal (001) plane parallel to the grid (//-particles) and a small fraction oriented with the basal plane perpendicular to the grid (⊥-particles). Assuming a plate-like habit of the mackinawite particles, diagonal lengths (L) were measured from //-particles, while both diagonal length and thickness (the dimension along the c-axis; t) were measured from ⊥-particles. Particle size distributions (PSDs) of the nanocrystalline mackinawite are shown in Fig. 6. Since the probability of finding the particles with a certain dimension is determined by both the number of these particles and the dimension, the number-based PSDs were weighted by the dimensions. As shown in Fig. 6, the mackinawite particles are found to be polydispersed, with the diagonal length ranging from ∼1 nm to ∼75 nm and the thickness from ∼2 nm to ∼15 nm. Apparently, the PSDs do not follow Gaussian distributions. The mean diagonal length and thickness were estimated from the weighted PSDs as follows:
Fig. 5.
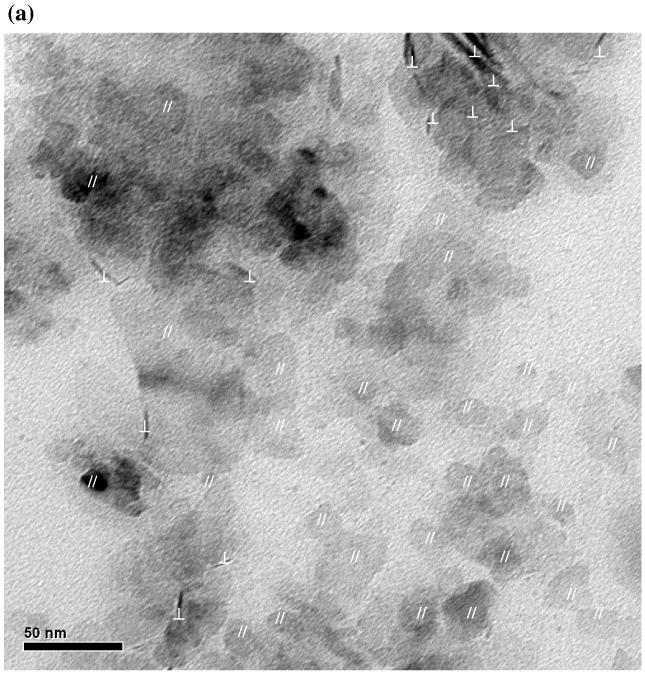
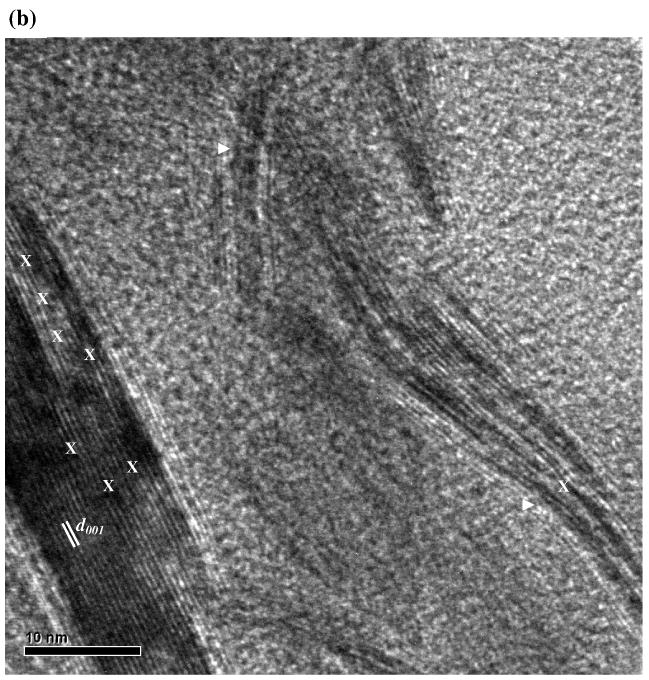
TEM images of synthetic mackinawite at low magnification (a) and high magnification (b). In part (a), mackinawite particles lying with the (001) plane parallel and perpendicular to the TEM grid are indicated by // and ⊥, respectively. In part (b), edge dislocations and curvature structures are indicated by X and ▷, respectively.
Fig. 6.
Particle size distribution of synthetic mackinawite from TEM observation: diagonal length (a) and thickness (b).
| (7) |
| (8) |
where fw(Li) and fw(ti) are the weighted frequency functions for diagonal length and thickness, respectively. The mean particle dimension along the a- and b-axes (La = Lb) was found to be 21.7 nm long, with the mean thickness of 7.5 nm. Using this information, the SSAext of the nanocrystalline mackinawite was estimated to be 103 m2/g.
As shown in Fig. 5b, small angle boundaries that consist of a series of edge dislocations along the c-axis are noted. The presence of such extended crystal defects indicates the polycrystalline nature of the mackinawite prepared in this study. Also, curvatures and irregular boundaries were observed along the (001) lattice fringes as reported for biogenic iron sulfide (Watson et al., 2000) and synthetic mackinawite (Ohfuji and Rickard, 2006).
3.2.3. EGME Method
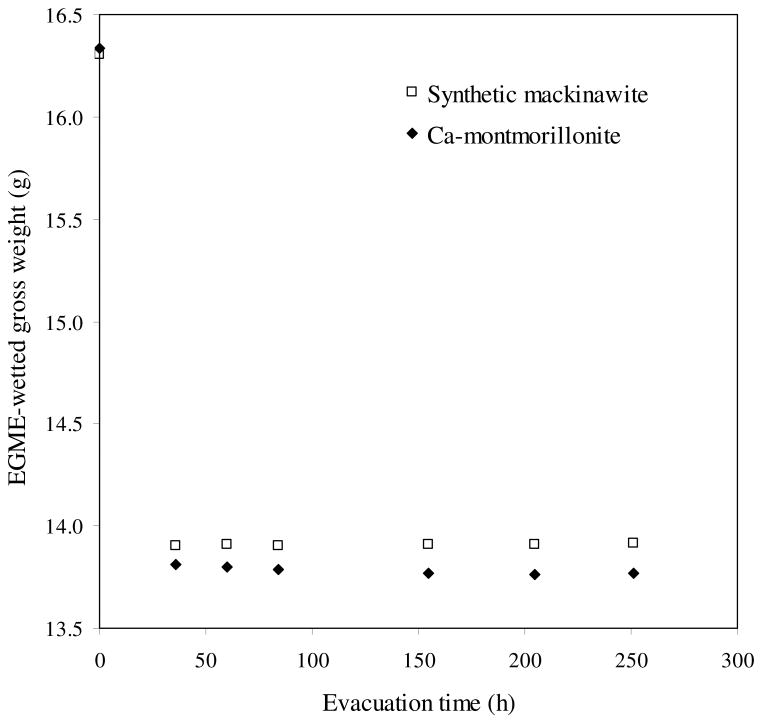
Specific surface area of synthetic mackinawite was estimated by monitoring ethylene glycol monoethyl ether (EGME) uptake. Fig. 7 shows the gross weight change of EGME-sorbed synthetic mackinawite and Ca-montmorillonite (a reference) as a function of evacuation time. Steady levels were reached by the first sampling time (35 h). Per unit mass, the amount of EGME retained by the nanocrystalline mackinawite was greater than that by the tested swelling clay, Ca-montmorillonite. The total specific surface areas (SSAtot) were determined to be 1,068 ± 19 m2/g for synthetic mackinawite and 746 ± 13 m2/g for Ca-montmorillonite. The estimated SSAtot of Ca-montmorillonite is close to a previously reported value of 767 m2/g by EGME method (Cerato and Lutenegger, 2002). The high SSAtot of the nanocrystalline mackinawite cannot be accounted for by its external surface alone. As previously mentioned, synthetic mackinawite has lattice expansion along the c-axis possibly due to the inclusion of water molecules in its interlayers that would be accessible to EGME (a polar liquid).
Fig. 7.
Change of the gross weights of EGME-sorbed synthetic mackinawite and Ca-montmorillonite as a function of evacuation time.
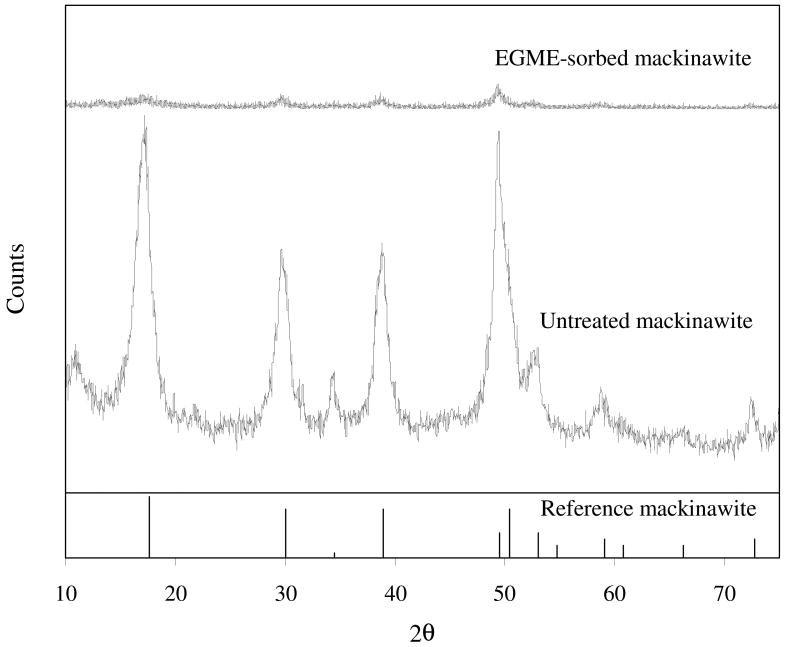
The XRPD patterns of EGME-sorbed mackinawite and the untreated phase are given in Fig. 8. Compared with the untreated mackinawite, the EGME-sorbed sample shows no distinguishable shift in the diffraction peak positions but a significant decrease in the peak intensities. Previously, the diffraction peak positions of montmorillonite were found to shift to lower angles (i.e., lattice expansion) due to the intercalation of glycols in the interlayers (Bradley, 1945). While the individual layers in montmorillonite are strongly held together by electrostatic forces (McBride, 1994), the layers in mackinawite are only weakly held by van der Waals force (Vaughan and Craig, 1978). Thus, the EGME sorption in the interlayers of mackinawite is thought to break apart the entire crystal structure (as evidenced by the decreased peak intensities) rather than cause the lattice expansion along the c-axis. Consequently, both external surface area and the original interlayer area of the nanocrystalline mackinawite are hypothesized to be measured by EGME method. This hypothesis could be further strengthened by spectroscopic analysis such as TEM and Raman spectroscopy. The specific surface area associated with the two basal planes and the interlayers of mackinawite (SSAbasal+int) is given by
Fig. 8.
X-ray diffraction pattern of EGME-sorbed synthetic mackinawite compared with that of untreated mackinawite. The diffraction data for reference mackinawite are obtained from JADE7 (Materials Data Inc.).
| (9) |
where φ is the wetability of EGME on the interlayers of mackinawite (0 ≤ φ ≤ 1). Taking the difference between SSAtot and SSAbasal+int as the specific surface area associated with the edges (SSAedge) and assuming complete wetting on the interlayers (i.e., φ = 1), the SSAbasal+int and SSAedge of the nanocrystalline mackinawite were estimated to be 880 m2/g and 188 m2/g, respectively. To compare with those estimated by other methods, the SSAext by EGME method was calculated as follows:
| (10) |
where Nc is the number of unit cells within a single crystallite along the c-axis (10.0 by FWHM at K = 0.9, 8.3 by IB at K = 1.05, and 5.6 by FWHM at K = 0.5). Again, assuming φ = 1, the SSAext of synthetic mackinawite by EGME method was estimated to be 276–345 m2/g.
3.2.4. PCS
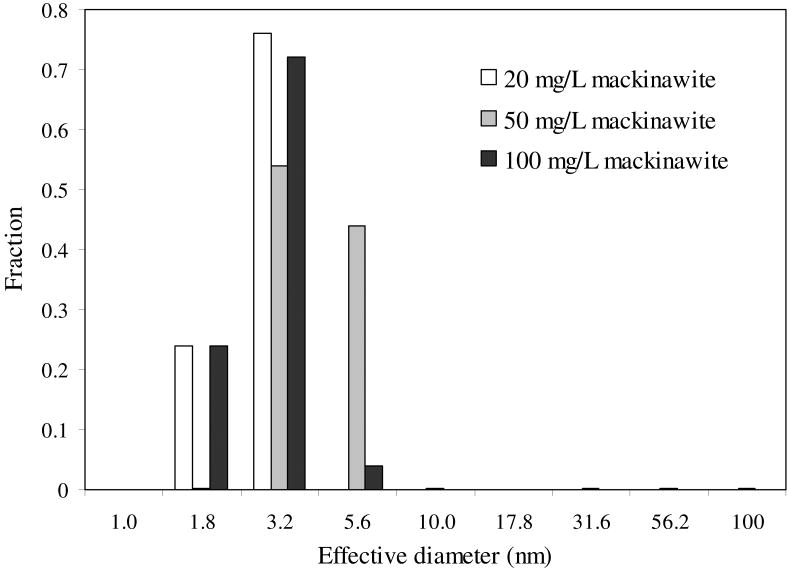
Photon Correlation Spectroscopy (PCS) does not accurately measure the size of mackinawite nanoparticles when they form aggregates in aqueous suspensions. To minimize and assess this, different but low concentrations of mackinawite suspensions (20–100 mg/L) within the operative limit for the intensity of scattering lights were analyzed by PCS. The mean effective diameters of the suspensions at 20 mg/L, 50 mg/ L, and 100 mg/L are 2.7 nm, 5.0 nm, and 2.8 nm, respectively. While not entirely eliminating the possibility of particle aggregation, the relatively small particle size and lack of an apparent trend between the particle sizes and the suspension concentrations suggest that particle aggregation was not significant under the measurement conditions.
Fig. 9 shows the mass-weighted PSD of synthetic mackinawite. Most particles are shown to range in diameter between ∼1.8 nm and ∼5.6 nm. Also, much larger particles (maybe aggregates) at less than 1% of total mass are continuously distributed up to 1,000 nm in diameter. These features are consistent with the SAED observation that a small fraction of well-crystalline large particles are present in a bulk of poorly-crystalline smaller particles. From the PSD in Fig. 9, the SSAext of the nanocrystalline mackinawite was estimated to be 424 ± 130 m2/g assuming spherical geometry. Such a large error by this analysis can result from the presence of a small fraction of big particles masking the signal from a surplus of small particles (Walther, 2003).
Fig. 9.
Particle size distribution of synthetic mackinawite from PCS measurement.
4. Discussion
4.1. Mineralogy and Crystal Structure
By XRPD analysis combined with a magnet separation, mackinawite was found to be the major phase, with greigite accounting for at most a few percent by mass. This is also supported by both XANES and EXAFS analyses of the local coordination environment around iron. The detection of mackinawite from the magnetic portion indicates that greigite likely forms by subsequent transformation of mackinawite, not direct precipitation from the solution phase. Previous studies (Berner, 1967a; Horiuchi, 1971; Wada, 1977; Lennie et al., 1997; Pósfai et al., 1998; Boursiquot et al., 2001) support the transformation of mackinawite to greigite via a solid-state pathway. This transformation was also observed in reaction of mackinawite with dissolved sulfide (Vaughan and Ridout, 1971; Rickard et al., 2001), indicating that the excess sulfide used for mackinawite synthesis here could mediate the partial oxidation of mackinawite to greigite. Although great care was taken to maintain anoxic conditions, oxygen contamination during the sample preparation and analysis could promote greigite formation (Lennie et al., 1997; Benning et al., 2000; Boursiquot et al., 2001). Water has also been proposed as an oxidizing agent for this transformation reaction (Jeong, 2005; Rickard and Morse, 2005).
Application of Bragg's law to the structural analysis of nanocrystalline materials has been questioned since this approach assumes the infinite periodicity of lattices (Michel et al., 2005; Rickard and Morse, 2005). Previously, the breakdown of this law was inferred from absent or weak lattice spacing features of nanocrystalline mackinawite in the SAED patterns (Ohfuji and Rickard, 2006). In contrast, the observed XRPD and SAED patterns in this study do not show such structural disorder. The direct determination of the lattice spacings from HR-TEM images also indicates that Bragg's law is applicable to the nanocrystalline mackinawite in this study.
By XRPD analysis, the unit cell of the nanocrystalline mackinawite was observed to be elongated along the c-axis compared with the well-crystalline mackinawite prepared by Lennie et al. (1995). As shown in Table 2, the unit cell contracts rapidly along the a- and b-axes with aging, but relatively slowly along the c-axis, supporting the hypothesis that both intercalation of water molecules in the interlayers and lattice relaxation lead to the lattice expansion of mackinawite along the c-axis but only lattice relaxation occurs along the a- and b-axes (Wolthers et al., 2003).
4.2. Particle Size and Specific Surface Area
A significant variation of the particle size and external specific surface area (SSAext) by different methods is noted for synthetic mackinawite prepared here (Table 3). The SSAext estimated by TEM analysis is the smallest, followed by the values obtained from XRPD analysis using both FWHM and IB approaches, EGME method, and PCS measurement. The observed variation in SSAext is caused by the limitations of each method, including underlying theoretical assumptions and experimental artifacts arising from sample handling and preparation.
4.2.1. XRPD
Application of Scherrer equation provides a measure of crystallite size since the coherent diffraction domain from XRPD analysis is bounded by extended crystal defects (e.g., stacking faults, twins, and grain boundaries) within particles (Hannay, 1967; Zhang et al., 2003). When a significant fraction of polycrystalline particles are present, the use of Scherrer equation will not yield accurate estimates of particle size and SSAext (Guinier, 1994). Previously, the crystallite size of nanocrystalline mackinawite estimated by Scherrer equation (Wolthers et al., 2003) was found to be similar to the particle size measured by neutron scattering analysis (Watson et al., 2000), suggesting that formation of polycrystalline particles was insignificant in relatively short-aged (< 0.5 h) mackinawite prepared by Wolthers et al. (2003). As noted by HR-TEM image in Fig. 5b, however, the translational symmetry of the nanocrystalline mackinawite is broken by small angle grain boundaries, indicating the presence of polycrystalline particles.
Another potential limitation of Scherrer equation comes from diffraction peak broadening by microstrain (Klug and Alexander, 1974). When non-uniform crystal defects are significant, the crystallite size will be underestimated by neglecting the microstrain component in Scherrer equation (van Berkum et al., 1994). Nonetheless, the microstrain broadening was not expected to be significant for the mackinawite prepared here. For example, despite non-stoichiometric compositions reported for mackinawite (Berner, 1964; Rickard, 1969; Ward, 1970; Sweeney and Kaplan, 1973; Rickard, 1997), the Rietveld refinement study of synthetic mackinawite (Lennie et al., 1995) showed that crystal defects such as sulfur vacancies and iron surplus were below the detection limit. Also, crystal defects such as edge dislocations and curvatures were shown to be limited along the grain boundaries of mackinawite due to its robust layer structure (Ohfuji and Rickard, 2006). Consistent with these observations, no evident defects were found in the interior of the mackinawite crystallites in this study. If the strain broadening effect were significant for synthetic mackinawite, the crystallite size would be underestimated by Scherrer equation. However, the underestimation of the crystallite size by neglecting the strain effect would be overwhelmed by the overestimation due to a broad particle size distribution as discussed below.
The choice of the Scherrer constant (K) is critical in the application of Scherrer equation. When crystallites vary significantly in size, a smaller K value than the one typically applied to a uniform size distribution should be used (Langford and Wilson, 1978). As illustrated by the SAED pattern (Fig. 4a), the nanocrystalline mackinawite shows a great variation in crystallite size. Thus, the use of K values close to unity (e.g., 0.9 by FWHM and 1.05 by IB) would significantly overestimate the crystallite size and thus underestimate the surface area. Notably, the SSAext by XRPD analysis is much smaller than the values estimated by EGEM method and PCS measurement. The use of K = 0.5 in FWHM approach results in SSAext = 392 m2/g, which is closer to those by these two methods.
Although no truly amorphous form of mackinawite is thought to be present (Wolthers et al., 2003; Rickard and Morse, 2005), such a phase would be removed with the background subtraction from the diffraction pattern in XRPD analysis. The presence of amorphous-like phase, even at only a few percent, could significantly contribute to the surface area of mackinawite, resulting in an underestimation of the actual surface area if present.
4.2.2. TEM
In Table 3, TEM analysis yielded the smallest SSAext among the methods used. As shown in Fig. 5a, the lack of distinct particle boundaries due to significant particle overlapping causes overestimation of the particle size and underestimation of SSAext by TEM analysis. The observed particle aggregation resulted from drying of mackinawite suspensions on the TEM grid under vacuum (Walther, 2003). Identification of fine particles with less than ∼2 nm in size is hindered by insufficient diffraction intensity. When overlapping with larger particles, the fine particles are difficult to identify due to the poor contrast. The tailing at the lower end of the PSDs of the nanocrystalline mackinawite (Fig. 6) suggests the presence of very fine particles that are not resolved by TEM.
4.2.3. EGME Method
The surface area of the nanocrystalline mackinawite estimated by EGME method is much larger compared to those of amorphous materials such as hydrous ferric oxide (159–720 m2/g; Dzombak and Morel, 1990) and amorphous silica (100–200 m2/g; Dixit and van Cappellen, 2002), and even comparable to those of activated carbons with microporous structures (881–1,093 m2/g; Nakai et al., 1993). This suggests that the area associated with both the external surfaces and interlayers can be measured by EGME method. Similar to its ability to wet the interlayers of swelling clays, the polar liquid, EGME may penetrate the interlayers of the nanocrystalline mackinawite. As shown in Fig. 8, however, its penetration between the interlayers apparently breaks apart the mackinawite structure rather than causing the lattice expansion along the c-axis.
Although complete wetting of the interlayers (i.e., φ = 1) was assumed to estimate the SSAext of the nanocrystalline mackinawite, a small fraction of the interlayers might not be completely wet by EGME as indicated by the weak diffraction peaks of EGME-sorbed mackinawite (Fig. 8). Under this circumstance, the assumption of φ = 1 would underestimate the SSAext of the nanocrystalline mackinawite. This may explain the lower SSAext by EGME method compared with the PCS-based estimate (Table 3). Also, EGME method requires information on Nc, which is independently assessed from XRPD analysis. As shown in Table 3, the SSAext determined using Nc by FWHM at K = 0.5 is larger than the other estimates based on different Nc values. This indicates that the uncertainty of Nc makes it difficult to accurately determine the SSAext of the nanocrystalline mackinawite using this approach. Nonetheless, EGME method is relatively simple and easy, and does not require expensive instrumentation. Most importantly, this method is not sensitive to particle aggregation state, which may lead to artifacts in the surface area estimates using TEM analysis or PCS measurement.
4.2.4. PCS
The highest SSAext was obtained from PCS measurement. This may be explained by the tendency of other methods to underestimate the surface area due to non-uniform crystallites in XRPD analysis, particle aggregation and low resolution of fine particles in TEM analysis, and incomplete wetability of EGME by the interlayers in EGME method. It should also be noted that PCS analysis is based on the assumption of spherical geometry. However, as indicated by both XRPD and TEM analyses (Table 3), the mackinawite particles are longer along the a- and b-axes than the c-axis. In such a case, the simultaneous presence of both translational diffusion and rotational diffusion complicates the particle size determination by PCS (Quirantes et al., 1996). Nonetheless, PCS provides an easy in-situ method for particle size determination. Also, the particle size and SSAext of poorly crystalline or amorphous phases can be measured by PCS.
4.2.5. Comparison with other studies
The large variation of the SSAext of mackinawite in Table 3 can be attributed to a variety of causes. First of all, differences in preparation methods and conditions from one laboratory to another may lead to variability of the crystallinity, aggregation state, and ultimately surface area of nanocrystalline mackinawite. Different surface area estimation methods are also expected to significantly contribute to the variation of surface areas due to either theoretical or sample preparation limitations as discussed here. In Wolthers et al. (2003), both conventional microscopic tools (e.g., TEM) and BET analysis yielded lower SSAext estimates than those reported here. As previously discussed, the microscopic approaches are significantly affected by particle aggregation. In BET analysis, freeze-drying of the mackinawite nanoparticles prior to gas adsorption measurement results in particle aggregation (Kornicker, 1988; Rickard, 1997; Watson et al., 2000; Wolthers et al., 2003). Due to inaccessibility of non-polar gases (e.g., N2 and Ar) to particle boundaries within aggregates, BET analysis tends to underestimate the SSAext. This is likely the reason for the extremely low SSAext of nanocrystalline mackinawite by Butler and Hayes (1998) and the low SSAext from BET analysis in Table 3. The SSAext of nanocrystalline mackinawite determined by conventional microscopic or BET analysis is more likely to reflect the degree of particle aggregation than the surface area of the particles dispersed in aqueous suspensions. In contrast, the surface area determination by HR-TEM (Ohfuji and Rickard, 2006) and LAXRPD (Wolthers et al., 2003) yielded much larger SSAext values (Table 3). Similarly, neutron scattering analysis gave high SSAext values of 400–500 m2/g for biologically produced iron sulfides (Watson et al., 2000). As shown in Table 3, the SSAext estimates by XRPD analysis using FWHM at K = 0.5, EGME method, and PCS measurement in this study are in reasonable agreement with those measured by the methods that are insensitive to particle aggregation.
Acknowledgments
The authors thank Dr. Kai Sun for TEM data collection using JEOL 2010F, which is operated by the support of NSF grant #DMR-9871177. The authors also thank two reviewers (Dr. Wolthers and an anonymous reviewer) and the associate editor Dr. George Helz for their invaluable comments. XAS data were collected at the Stanford Synchrotron Radiation Laboratory (SSRL), a national user facility operated by Stanford University on behalf of the U.S. Department of Energy, Office of Basic Energy Sciences. Funding for this research was provided by NIEHS grant No. P42 ES04911-12 and SERDP contract No. W912HQ-04-C-0035. This paper is not subject to review by either agency; it therefore does not necessarily reflect the sponsors' view, and no official endorsement should be inferred.
Appendix
EGME Method for Surface Area Determination
-
Pre-drying of samples (synthetic mackinawite and Ca-montmorillonite)
Freeze-dry synthetic mackinawite until vacuum pressure is below 100 millitorr.
Oven-dry Ca-montmorillonite at 210°C overnight.
-
Preparation of CaCl2-EGME solvate
Weigh 220 g of 40-mesh CaCl2 in a 1 liter beaker and dry in an oven at 210°C for at least one hour to remove all trace water.
Transfer 43 mL of EGME liquid into a 400 mL beaker.
Remove CaCl2 from the oven, weigh out 200 g without cooling, and add to the beaker containing EGME liquid. Mix immediately and thoroughly with a spatula.
After the CaCl2-EGME solvate has cooled, transfer it into a glass vessel and spread it uniformly over the bottom.
Store the vessel in a sealed desiccator.
-
Sorption of EGME by samples
Purge EGME liquid with N2 gas for at least 30 min to remove the dissolved oxygen.
Weigh an aluminum vessel and its lid.
Weigh about 1.1 g of a sample into the aluminum vessel and spread the sample evenly over the bottom of the vessel. Determine the net mass of sample, vessel, and lid to the nearest 0.001 g.
Wet the sample with about 3 mL of the purged EGME liquid to form sample-adsorbate slurry.
Place the aluminum vessel with the sample-adsorbate slurry into a vacuum desiccator that contains anhydrous CaCl2 on the bottom of the desiccator. Also, transfer the vessel of CaCl2-EGME solvate into the same vacuum desiccator.
Evacuate the desiccator using a vacuum pump with a capacity of at least 635 mm Hg and then refill with N2 gas. Repeat this step three times. This procedure will decrease the oxygen level inside the desiccator during the next step.
Allow 1 hour for the sample-adsorbate slurry to equilibrate.
Begin the evacuation. Regularly, stop the evacuation and measure the net mass of sample, aluminum vessel, and its lid.
Repeat the above step until the net mass does not vary more than 0.001 g.
-
Calculate the specific surface area of the sample as follows:
(A1) where SSA = specific surface area (m2/g), Ma = the mass of EGME retained by the sample (g), 0.000286 = the mass of EGME required to form a monomolecular layer on a square meter of surface (g/m2), and Ms = the mass of the initially added sample (g).
Footnotes
Publisher's Disclaimer: This is a PDF file of an unedited manuscript that has been accepted for publication. As a service to our customers we are providing this early version of the manuscript. The manuscript will undergo copyediting, typesetting, and review of the resulting proof before it is published in its final citable form. Please note that during the production process errors may be discovered which could affect the content, and all legal disclaimers that apply to the journal pertain.
References
- Ankudinov A, Ravel B, Rehr JJ. FEFF 8.10. Univ. of Washington; Seattle: 2000. [Google Scholar]
- Benning LG, Wilkin RT, Barnes HL. Reaction pathways in the Fe-S system below 100 degrees C. Chem Geol. 2000;167:25–51. [Google Scholar]
- Berner RA. Iron sulfides formed from aqueous solution at low temperatures and atmospheric pressures. J Geol. 1964;72:293–306. [Google Scholar]
- Berner RA. Thermodynamic stability of sedimentary iron sulfides. Am J Sci. 1967a;265:773–785. [Google Scholar]
- Berner RA. Diagenesis of iron sulfide in recent marine sediments. In: Lauf GH, editor. Estuaries. American Association for the Advancement of Science; Washington: 1967b. pp. 268–272. [Google Scholar]
- Berner RA. A new geochemical classification of sedimentary environments. J Sediment Petrol. 1981;51:359–365. [Google Scholar]
- Boursiquot S, Mullet M, Abdelmoula M, Génin JM, Ehrhardt JJ. The dry oxidation of tetragonal FeS1-x mackinawite. Phys Chem Minerals. 2001;28:600–611. [Google Scholar]
- Bradley WF. Molecular associations between montmorillonite and some polyfunctional organic liquids. J Amer Chem Soc. 1945;67:975–981. [Google Scholar]
- Butler EC, Hayes KF. Effects of solution composition and pH on the reductive dechlorination of hexachloroethane by iron sulfide. Environ Sci Technol. 1998;32:1276–1284. [Google Scholar]
- Butler EC, Hayes KF. Kinetics of the transformation of halogenated aliphatic compounds by iron sulfide. Environ Sci Technol. 2000;34:422–429. [Google Scholar]
- Carter DL, Heilman MD, Gonzalez CL. Ethylene glycol monoethyl ether for determining surface area of silicate minerals. Soil Sci. 1965;100:356–360. [Google Scholar]
- Cerato AB, Lutenegger AJ. Determination of surface area of fine-grained solis by the ethylene glycol monoethyl ether (EGME) method. Geotech Testing J. 2002;25(3):1–7. [Google Scholar]
- Davison W, Philips N, Tabner BJ. Soluble iron sulfide species in natural waters: reappraisal of their stoichiometry and stability constants. Aquat Sci. 1999;61:23–43. [Google Scholar]
- Dixit S, van Cappellen P. Surface chemistry and reactivity of biogenic silica. Geochim Cosmochim Acta. 2002;66:2559–2568. [Google Scholar]
- Dzombak DA, Morel FMM. Surface Complexation Modeling, Hydrous Ferric Oxide. John Wiley and Sons; 1990. [Google Scholar]
- George GN, Pickering IJ. EXAFSPAK. Stanford Synchrotron Radiation Laboratory; 1995. [Google Scholar]
- Guinier A. X-ray Diffraction in Crystals, Imperfect Crystals, and Amorphous Bodies. Dover Publications, Inc.; 1994. [Google Scholar]
- Hannay NB. Solid-State Chemistry. Prentice-Hall, Inc.; 1967. [Google Scholar]
- Horiuchi S. Electron beam heating transformation of mackinawite (FeS) to greigite (Fe3S4) Zeitschrift fur Anorganische und Allgemeine Chemie. 1971;386:196–200. [Google Scholar]
- Jeong HY, Hayes KF. Impact of transition metals on reductive dechlorination rate of hexachloroethane by mackinawite. Environ Sci Technol. 2003;37:4650–4655. doi: 10.1021/es0340533. [DOI] [PubMed] [Google Scholar]
- Jeong HY. Ph D thesis. Univ. of Michigan; 2005. Removal of heavy metals and reductive dechlorination of chlorinated organic pollutants by nanosized FeS. [Google Scholar]
- Jeong HY, Hayes KF. Reductive dechlorination of tetrachloroethylene and trichloroethylene by mackinawite (FeS) in the presence of metals: reaction rates. Environ Sci Technol. 2007;41:6390–6396. doi: 10.1021/es0706394. [DOI] [PubMed] [Google Scholar]
- Jeong HY, Klaue B, Blum JD, Hayes KF. Sorption of mercuric ion by synthetic mackinawite (FeS) Environ Sci Technol. 2007 doi: 10.1021/es070289l. accepted. [DOI] [PubMed] [Google Scholar]
- Kjekshus A, Nicholson DG, Mukherjee AD. On the bonding in tetragonal FeS. Acta Chem Scand. 1972;26:1105–1110. [Google Scholar]
- Klug HP, Alexander LE. X-ray Diffraction Procedures: For Polycrystalline and Amorphous Materials. 2nd. John Wiley & Sons; 1974. [Google Scholar]
- Kornicker WA. Ph D thesis. Texas A&M Univ.; 1988. Interactions of divalent cations with pyrite and mackinawite in seawater and sodium-chloride solutions. [Google Scholar]
- Langford JI, Wilson AJC. Scherrer after sixty years: a survey and some new results in the determination of crystallite size. J Appl Cryst. 1978;11:102–113. [Google Scholar]
- Lennie AR, Redfern SAT, Schofield PF, Vaughan DJ. Synthesis and Rietveld crystal structure refinement of mackinawite, tetragonal FeS. Min Magazine. 1995;59:677–683. [Google Scholar]
- Lennie AR, Vaughan DJ. Spectroscopic studies of iron sulfide formation and phase relations at low temperatures. Mineral Spectroscopy. 1996;5:117–131. [Google Scholar]
- Lennie AR, Redfern SAT, Champness PE, Stoddart CP, Schofield PF, Vaughan DJ. Transformation of mackinawite to greigite: an in situ X-ray powder diffraction and transmission electron microscope study. Am Mineral. 1997;82:302–309. [Google Scholar]
- McBride MB. Environmental Chemistry of Soils. Oxford University Press; 1994. [Google Scholar]
- Michel FM, Antao SM, Chupas PJ, Lee PL, Parise JB, Schoonen MAA. Short- to medium-range atomic order and crystallite size of the initial FeS precipitate from pair distribution function analysis. Chem Mater. 2005;17:6246–6255. [Google Scholar]
- Morse JW, Arakaki T. Adsorption and coprecipitation of divalent metals with mackinawite (FeS) Geochim Cosmochim Acta. 1993;57:3635–3640. [Google Scholar]
- Morse JW, Rickard D. Chemical dynamics of sedimentary acid volatile sulfide. Environ Sci Technol. 2004;38:131A–136A. doi: 10.1021/es040447y. [DOI] [PubMed] [Google Scholar]
- Mullet M, Boursiquot S, Abdelmoula M, Génin JM, Ehrhardt JJ. Surface chemistry and structural properties of mackinawite prepared by reaction of sulfide ions with metallic iron. Geochim Cosmochim Acta. 2002;66:829–836. [Google Scholar]
- Mullet M, Boursiquot S, Ehrhardt JJ. Removal of hexavalent chromium from solutions by mackinawite, tetragonal FeS. Colloids and Surf A. 2004;244:77–85. [Google Scholar]
- Nakai K, Sonoda J, Kondo S, Abe I. The analysis of surface and pores of the activated carbons by the adsorption of various gases. Pure & Appl Chem. 1993;65:2181–2187. [Google Scholar]
- Ohfuji H, Rickard D. High resolution transmission electron microscopic study of synthetic nanocrystalline mackinawite. Earth and Planetary Sc Lett. 2006;241:227–233. [Google Scholar]
- Patterson RR, Fendorf S, Fendorf M. Reduction of hexavalent chromium by amorphous iron sulfide. Environ Sci Tech. 1997;31:2039–2044. [Google Scholar]
- Pielaszek R. Ph D thesis. Warsaw Univ.; 2003. Diffraction studies of microstructure of nanocrystals exposed to high pressure. [Google Scholar]
- Pósfai M, Buseck PR, Bazylinski DA, Frankel RB. Iron sulfides from magnetotactic bacteria: structure, composition, and phase transitions. Am Mineral. 1998;83:1469–1481. [Google Scholar]
- Quirantes A, Ben-Taleb A, Delgado AV. Determination of size/shape of colloidal ellipsoids by photon correlation spectroscopy. Colloids Surf A. 1996;119:73–80. [Google Scholar]
- Rickard D. The chemistry of iron sulphide formation at low temperatures. Stockholm Contr Geol. 1969;26:67–95. [Google Scholar]
- Rickard D. Kinetics and mechanism of the sulfidation of goethite. Amer J Sci. 1974;274:941–952. [Google Scholar]
- Rickard D. Kinetic and mechanism of pyrite formation at low temperatures. Am J Sci. 1975;275:636–652. [Google Scholar]
- Rickard D. Kinetics of FeS precipitation. Part I. competing reaction mechanisms. Geochim Cosmochim Acta. 1995;59:4367–4379. [Google Scholar]
- Rickard D, Schoonen MAA, Luther GW. The chemistry of iron sulfides in sedimentary environments. In: Vairavamurthy MA, Schoonen MAA, editors. Geochemical Transformations of Sedimentary Sulfur. 1995. pp. 168–193. (ACS Symposium Series 612). [Google Scholar]
- Rickard D. Kinetics of pyrite formation by the H2S oxidation of iron(II) monosulfide in aqueous solutions between 25 and 125°C: the rate equation. Geochim Cosmochim Acta. 1997;61:115–134. [Google Scholar]
- Rickard D, Butler IB, Oldroyd A. A novel iron sulphide mineral switch and its implications for Earth and planetary science. Earth and Planetary Sc Lett. 2001;189:85–91. [Google Scholar]
- Rickard D, Morse JW. Acid volatile sulfide (AVS) Mar Chem. 2005;97:141–197. [Google Scholar]
- Rickard D. The solubility of FeS. Geochim Cosmochim Acta. 2006;70:5779–5789. [Google Scholar]
- Spadini L, Bott M, Wehrli B, Manceau A. Analysis of the major Fe bearing phases in recent lake sediments by EXAFS spectroscopy. Aquat Geochem. 2003;9:1–17. [Google Scholar]
- Sweeney RE, Kaplan IR. Pyrite framboid formation: laboratory synthesis and marine sediments. Econ Geol. 1973;68:618–634. [Google Scholar]
- Taylor LA, Finger LW. Structural refinement and composition of mackinawite. Carnegie Institution of Washington Geophysical Laboratory Annual Report. 1970;69:318–322. [Google Scholar]
- Tewari PH, Wallace G, Campbell AB. The solubility of iron sulphides and their role in mass transport in Girdler-Sulphide heavy metal plants. Rep At Energy Can Ltd, AECL-5960. 1978:1–34. [Google Scholar]
- van Berkum JGM, Vermeulen AC, Delhez R, de Keijser TH, Mittemeijer EJ. Applicabilities of the Warren-Averbach analysis and an alternative analysis for separation of size and strain broadening. J Appl Crystallogr. 1994;27:345–357. [Google Scholar]
- Vaughan DJ, Ridout MS. Mössbauer studies of some sulphide minerals. J Inorg Nucl Chem. 1971;33:741–746. [Google Scholar]
- Vaughan DJ, Craig JR. Mineral Chemistry of Metal Sulfides. Cambridge University Press; 1978. [Google Scholar]
- Wada H. The synthesis of greigite from a polysulfide solution at about 100°C. Bull Chem Soc Jpn. 1977;50:2615–2617. [Google Scholar]
- Walther C. Comparison of colloid investigations by single particle analytical techniques-a case study on thorium-oxyhydroxides. Colloid Surf A. 2003;217:81–92. [Google Scholar]
- Ward JC. The structure and properties of some iron sulphides. Rev Pure and Appl Chem. 1970;175:175–205. [Google Scholar]
- Watson JHP, Cressey BA, Roberts AP, Ellwood DC, Charnock JM, Soper AK. Structural and magnetic studies on heavy-metal-adsorbing iron sulphide nanoparticles produced by sulphate-reducing bacteria. J Magn Magn Materials. 2000;214:13–30. [Google Scholar]
- Waychunas GA, Apted MJ, Brown GE., Jr X-ray K-edge absorption spectra of Fe minerals and model compounds: near-edge structure. Phys Chem Minerals. 1983;10:1–9. [Google Scholar]
- Wharton MJ, Atkins B, Charnock JM, Livens FR, Pattrick RAD, Collison D. An X-ray absorption spectroscopy study of the coprecipitation of Tc and Re with mackinawite (FeS) Appl Geochem. 2000;15:347–354. [Google Scholar]
- Wilder AM, Seward TM. The adsorption of gold(I) hydrosulphide complexes by iron sulphide surfaces. Geochim Cosmochim Acta. 2002;66:383–402. [Google Scholar]
- Wilkin RT, Barnes HL. Pyrite formation by reactions of iron monosulfides with dissolved inorganic and organic sulfur species. Geochim Cosmochim Acta. 1996;60:4167–4179. [Google Scholar]
- Wolthers M, van der Gaast SJ, Rickard D. The structure of disordered mackinawite. Am Mineral. 2003;88:2007–2015. [Google Scholar]
- Wolthers M, Charlet L, van Der Linde PR, Rickard D, van Der Weijden CH. Surface chemistry of disordered mackinawite (FeS) Geochim Cosmochim Acta. 2005;69:3469–3481. [Google Scholar]
- Zhang Z, Zhou F, Lavernia EJ. On the analysis of grain size in bulk nanocrystalline materials via X-ray diffraction. Metall Mater Trans. 2003;34A:1349–1355. [Google Scholar]


