

Abstract
We measured changes to cone photoreceptors in patients with early age-related macular degeneration. The data of 53 patients were compared with normative data for color matching measurements of long- and middle-wavelength-sensitive cones in the central macula. A four-parameter model quantified cone photopigment optical density and kinetics. Cone photopigment optical density was on average less for the patients than for normal subjects and was uncorrelated with visual acuity. More light was needed to reduce the photopigment density by 50% in the steady state for patients. These results imply that cone photopigment optical density is reduced by factors other than slowed kinetics.
1. INTRODUCTION
Age-related macular degeneration (AMD) is the most prevalent cause of loss of vision in industrialized countries,1 but the mechanisms leading to this loss are not yet understood. Central vision, dominated by cone photoreceptors, is lost to varying extents in different patients, over a number of years, and in a variety of patterns.2–9 The visual prognosis for an individual patient is often unpredictable, with vision loss due not only to atrophy8 but also to the onset and severity of exudative changes such as choroidal new vessels and retinal pigment epithelial detachments.10,11
Functional damage to cone photoreceptors has been shown to occur early in AMD, before atrophy or exudation,3,4,7,12–14 as well as damage to a variety of other aspects of cone pathway function.5,15–20 Several types of damage have been hypothesized to occur early in the disease.21–25 One type of model concerning the early stages of AMD will be referred to as the kinetic hypothesis (Table 1). This model postulates that the retinal pigment epithelium (RPE) and Bruch’s membrane become filled with debris, including lipids and lipoproteins from sources such as photoreceptor outer segments or from outside the photoreceptor/RPE cell complex.23–25 The debris is hypothesized to lead to slowed regeneration of photopigment due to slowed trafficking through the RPE. This hypothesis predicts that cones would have altered bleaching and kinetic measurements and, in extreme cases, less optical density at low light levels due to bleaching of photopigments. This theory makes no prediction concerning quantal catch, apart from decreased optical density. A variation of this hypothesis is that AMD is just a more extreme form of changes associated with normal aging. Slowed dark adaptation and photopigment kinetics have been reported for older subjects.26–29 While this theory does not readily account for the large individual differences in visual prognosis, clinical fundus findings, or timing of progression, it is possible by using in vivo methods to determine whether certain aspects of this theory are valid for the majority of a sample of patients with AMD.
Table 1.
Several Types of Potential Changes of Aging and Disease to Cone Photoreceptor/Retinal Pigment Epithelial Complex and the Result on Color Matching.
| Mechanism | Result |
|---|---|
| Decreased photopigment regeneration (Kinetic hypothesis) |
Photopigment bleaches at lower light levels |
| Abnormal cone orientation | Photopigment bleaches at higher light levels and lower optical density than in young, healthy subjects |
| Decreased photosensitivity | Lower optical density; more light is required to bleach photo- pigment |
| Decreased photopigment | Lower optical density, but regenera- tion is essentially unchanged |
| Cone loss | No change in color matching other than decreased discrimination |
The integrity of the cone outer segments is readily quantified in patients with AMD, despite the inherent problems in the optics of the older eye, by using a color matching technique.3,4,7,12 To quantify the amount of photopigment in long- and middle-wavelength-sensitive cones, the patient matches a standard light of intermediate wavelength with a mixture of longer- and shorter-wavelength lights. This match depends on the concentration of photopigment within the cones, the path length of light through the photopigment including photoreceptor directionality, and the extinction spectra of the photopigments. As long as there are sufficient cones to make a color match, the match is dependent only on the optical and photochemical properties of the functioning cones and not on the number of cones. Previously, several laboratories have shown that patients with AMD make color matches at low light levels that are significantly different from those made by normal subjects; these changes are consistent with low optical density of the cone photopigments.3,4,7,12 When patients spanning a wide range of stages of AMD were tested at low light levels, the color matches were related to the patient’s Stiles–Crawford effect,3 as may result from disruption or misalignment of cone photoreceptors in the more severe stages of disease. This implies that more, not less, light is required to bleach photopigments in severe cases. However, kinetic measurements were not taken in these patients.
Altered photosensitivity of the cone photopigments would also decrease the effective optical density and increase the amount of light required to bleach the photopigments. The outer segment need not be severely disrupted. Reduced optical density from either poorer guidance or reduced photosensitivity would not necessarily imply RPE damage early in the disease, while slowed kinetics (due to RPE damage) would not necessarily lead to low cone photopigment optical density until a steady state could not be maintained at the lowest light levels. Thus, measurements of color matches can distinguish between these models of AMD.
A. Color Match Illuminance Technique and Four-Parameter Model
To quantify cone photopigment optical density and kinetics, we developed a technique in which color matching was performed over a series of light levels.30,31 Steady-state matches are made by the subject, starting with a baseline light level dim enough that the photopigment is fully regenerated, then proceeding through a series of light levels, and finally reaching a level bright enough that the photopigment is in dilute concentration at steady state (>97% bleached). The resulting data are the log ratios of the amount of a long-wavelength primary to the amount of a middle-wavelength primary, log (R/G), plotted as a function of retinal illuminance (Fig. 1). The change of the color matches from low to high light level occurs as a result of the change in shape of the photopigment spectra with concentration, commonly referred to as self-screening of the photopigment. The important factor is that the spectral sensitivity of both long- and middle-wavelength photopigments changes with optical density, so that the color match settings shift predictably: more of the long-wavelength primary is required as the pigments become more dilute.32 Color matching at moderate light levels has been used successfully over a wide range of ages by several groups12,33–35 and by us over a wide range of retinal illuminances and ages.28,29,36 Data are fitted by using the Smith–Pokorny cone photopigment fundamentals.30,32,36
Fig. 1.
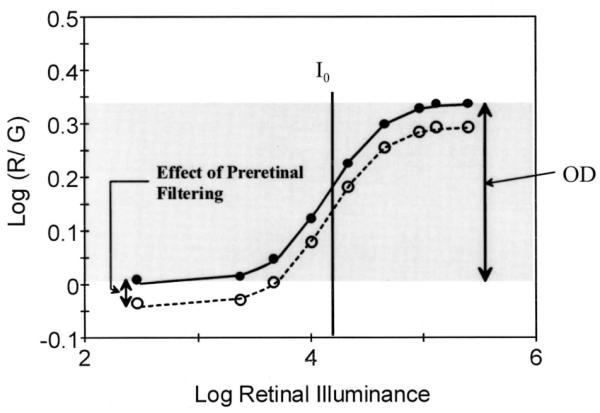
Color matching data from a control subject, showing how color matches change as a function of increasing retinal illuminance and the bleaching of photopigments. The four-parameter Gaussian model of these data provides quantitative estimates of cone photopigment optical density (OD), the amount of light required to bleach half the photopigment (I0), and the effect of preretinal filtering from cataractous lens or other sources on the height of the curve. The standard deviation is not shown.
In normal subjects over a broad range of ages, four parameters are necessary and sufficient to describe these data.28,29 A cumulative normal model, which is based on a Gaussian curve having symmetry about the mean, fits the data well (Fig. 1).28–31 The first parameter, optical density (OD), is calculated from the amplitude of the Gaussian function, which is steeper than a diffusion model.30
The half-bleach illuminance I0 is the retinal illumination needed to reduce the optical density by one half the value at baseline, indicating the position on the illuminance axis of the mean of the Gaussian function. I0 is altered by changes in the rate of photopigment regeneration. The third parameter, the baseline color match, describes the displacement from the horizontal axis of the curve. This parameter is altered by both optical density and preretinal filtering by the lens34 and other ocular media. The fourth parameter is the standard deviation of the Gaussian function σ and is also affected by kinetics. Slowed kinetics lead to photopigment bleaching at lower light levels, which may lead to a shallower slope that is fitted as an increased value of σ.
B. Changes with Aging and Disease
With aging, this color matching method has shown that kinetics, as measured by I0 , slow, while cone optical density is not decreased.28 There are only small individual differences across subjects, indicating well-regulated kinetics in normal subjects. Several methods have shown changes with normal aging in both the kinetics26–29 and the optical density of cone photopigment in the centralmost fovea.33,37,38
In retinal disease, this color matching technique has been able to reveal changes in optical density39–41 and kinetics.40,42,43 The two types of changes can be distin-guished in disease such as retinitis pigmentosa39 and diabetes.42 In this prospective study, we quantified the optical density and aspects of kinetics for cone photopigments of patients with early AMD, before exudation in the test eye or loss of visual acuity below 20/70.
2. METHODS
A. Subjects
Each prospective subject underwent a dilated examination by a retinal specialist (JW), who selected patients with a diagnosis of early AMD or identified subjects as normal for their age group. The criterion used to define early AMD was RPE mottling or soft drusen. Hard drusen were included as long as they did not match the pattern recognized as a form of dominant drusen: very regular, diffuse hard drusen with a stars in the night pattern, regular clustered hard drusen, or hard drusen located mainly outside the posterior pole with just a few macular drusen. The finding of a few small, hard drusen with no RPE changes was considered normal aging, and these subjects were not included in this study. A follow-up over 11 yr, on average, of the study population showed that 57% had choroidal neovascularization, 17% atrophy with major vision loss, 12% multiple large soft drusen, 12% RPE mottling and a few hard drusen, and 2% retinal pigment epithelial detachment. The patients were entered into a study in which clinical outcome data were collected initially for 5 yr, with further review ongoing. This report describes the baseline data and implications. On study entry, patients had at least 20/70 visual acuity and self-report of normal color vision in the test eye. Anomalous or dichromatic color vision that was previously undiagnosed was readily determined by the practice settings, since color matching is the diagnostic test for congenital color vision abnormalities.36 Patients were excluded from the parametric analysis who had any color vision anomaly, clinically evident exudation in the macula of the test eye, dominant drusen, Best’s disease, any form of pattern dystrophy including Stargardt’s/fundus flavimaculatus, glaucoma, abnormally high intraocular pressure, dense lenses on slit lamp examination, or a history of extended use of retinotoxic medications. Patients who had heart disease or were taking blood pressure medications were included, but not patients with insulin-dependent diabetes. This resulted in 53 patients, 24 females and 29 males, aged 71 ± 6 yr. After the purpose, procedure, and consequences of the study were explained, each subject signed a consent form and followed a protocol approved by the Institutional Review Board of the Schepens Eye Research Institute. The research followed the tenets of the Declaration of Helsinki.
The comparison population is the normative data published previously.28 These normal subjects had exceptionally healthy eyes for their age group and in addition were in good systemic health other than controlled hypertension in some of the older subjects.
B. Apparatus and Procedure
The apparatus was the previously described four-channel, Maxwellian view color matching device that has been used extensively in patients with retinal disease and control subjects spanning a broad age range.28,30,36,38–41 Eye positioning was performed by adjusting a bite-bar system in three dimensions, using an infrared pupil and iris monitoring system. The image of the 2.1-mm entrance beam was maintained in good focus in the center of the patient’s dilated pupil, and pupil size was also monitored. Thus all the light entered the pupil.
The subject matched the left and right halves of a 4-deg circle in color and brightness, which largely reflects the status of cones at 2 deg and not the more fragile central cones. As in previous studies, the patient used a mixture of 546 (G) and 650 nm (R) lights to match the adjacent, standard 590-nm hemifield. A dim 480-nm field was combined with both stimulus hemifields to reduce saturation differences between the monochromatic standard and the mixture lights, as well as to minimize potential rod input.28,29 The experimenter queried the subject as to when to adjust this. The intensity of the mixture was also adjusted by the patient with a separate knob. The patient made ten color matches at one illuminance, varying the starting position. For the full protocol, the entire field was made brighter, covering nine steps of retinal illuminance in order, from 260 to 260,000 Td. Each intensity was well above the level at which rod response is a significant factor in the color match. At each increasing retinal illuminance, the patient received sufficient time and practice to ensure the most reliable steady-state color matches possible. Rest periods, if needed, were usually between intensity levels so that readaptation could occur in a timely manner. The method used in the normative population28,29 was augmented with new software to assist an elderly patient group in making practice settings more rapidly, to assist the experimenter in determining when a patient was ready to make matches at each new light level, and to provide more automated calibrations and long-term instrument stability. A measurement set for the typical 90-trial experiment required approximately 30 min of patient time, with rest periods, plus the consent and bite-bar procedures. A shortened protocol was used for eleven of the subjects, which included ten settings at each of two baseline intensities and ten settings at each of two bleached intensities.
C. Data Analysis
After each session, the amounts of the 546- and 650-nm lights in each mixture were calibrated with a photometer (EG&G Model 550, Gamma Scientific, San Diego, Calif.). For each setting, the log ratio of the amounts of the 650-nm to 546-nm primaries required to match the standard, log (R/G), was computed. For each retinal illuminance tested, the mean and standard deviation of log (R/G) were computed, with further parameters based on the means.
Cone photopigment optical density was computed in two ways. In the first method, a cumulative normal curve was fitted via a simplex routine to the log (R/G) as a function of retinal illuminance. The four parameters are (1) baseline color match, the average of the three lowest retinal illuminances color matches; (2) OD, the height of the cumulative normal curve; (3) I0 , the retinal illuminance corresponding to the retinal illuminance at which half the change occurred for the color matches; and (4) σ, standard deviation of the normal curve, which gives an estimate of the slope of the change in color match as a function of retinal illuminance. The baseline color match provides a comparison for color matching studies employing only a single, low light level. The success of the model in quantifying the data is indicated by the rms error. This first method works well for normal subjects or patients with sufficient photopigment to permit all parameters to be well defined. Small deviations from normal in cone photopigment optical density or regeneration kinetics can be quantified. However, when the patient’s low-illuminance color matches are nearly indistinguishable from the matches made under bleached conditions, then the first method degenerates into fitting a cumulative normal curve to a straight line. Regeneration kinetics cannot be measured if there is insufficient photopigment, and the I0 and σ parameters are unnecessary. In the second method, the maximum possible optical density (ODmax) is computed as the difference between the lowest value of log (R/G) among the three lowest retinal illuminances tested and the highest value of log (R/G) among the three highest retinal illuminances. This method provides a conservative estimate of the reduction of OD, since altered kinetics could cause bleaching to occur over a different range of intensities. Alternatively, if there were bleaching of photopigment by the second dimmest in the series of retinal illuminance values, although this never occurs in normal subjects, then the OD would depend on the dimmest value. This method also accounts for the problems some patients have with discrimination at very low or very high light levels. To determine whether patients with AMD had normal cone photopigment optical density, the optical density computations were compared on a patient-by-patient basis with the confidence limits from normal data, which do not change with age. Groups and subgroups of patients were further analyzed according to deviation from normal optical density or rms error.
To determine whether cone photopigment optical density in patients with AMD were associated with kinetics, we performed three analyses. First, I0 was compared with the normative value, which shows only a slight change with age. Second, the Pearson product moment correlation coefficient was computed for the ODmax or ODfit and I0 and for age. These are uncorrelated in the normative sample, for which the range of I0 values is quite small. A positive and significant correlation was expected between I0 and optical density, as measured by either ODmax or ODfit, if debris led to reduced trafficking through the RPE, which in turn slowed photopigment kinetics sufficiently to reduce optical density. Third, the color matching settings at the two lowest intensities were examined in order of performance. If photopigment were being gradually bleached, then with each successive setting the R/G ratio would have increased, leading to a positive slope for the ten consecutive settings. Color matches at these intensities were previously shown not to bleach a measurable proportion of photopigment during a 15-min exposure, far longer than was needed to make these settings even in patients with AMD.42 We compared the color matching settings to the order of the trial, using a Spearman rank order correlation. We then examined whether each coefficient, rho, was positive and significant for each patient.
3. RESULTS
A. Optical Density
Patients with AMD were able to perform the color matching task, but many had significantly lower optical density than normal (Figs. 2 and 3). At study entry, cone photopigment optical density, either ODfit or ODmax , of patients with early AMD ranged from within normal confidence limits to no measurable density (Fig. 3). Four patients were not able to perform the color matching task. For many patients, the baseline color matches required more of the 650-nm light to match the standard than a normal, older subject would require [e.g., Fig. 2(a)]. In normal subjects the color matches change with decreased concentrations of photopigment due to bleaching, likewise requiring more long-wavelength or “red” primary. The mean of ODmax for the entire sample at study entry was 0.163 log unit, significantly greater than 0 but significantly less than the normative value for optical density, 0.27 ± 0.054, ( p < 0.0001). Of the 49 patients who made color matches successfully, 26 fell 2 standard deviations below the normative value for optical density previously reported and 15 fell 3 standard deviations below. Age alone also does not explain these data, since age (range 56–82 yr) is uncorrelated with ODmax (r = −0.189, p = 0.195) for the entire group and is similarly unrelated for the other subgroups tested.
Fig. 2.
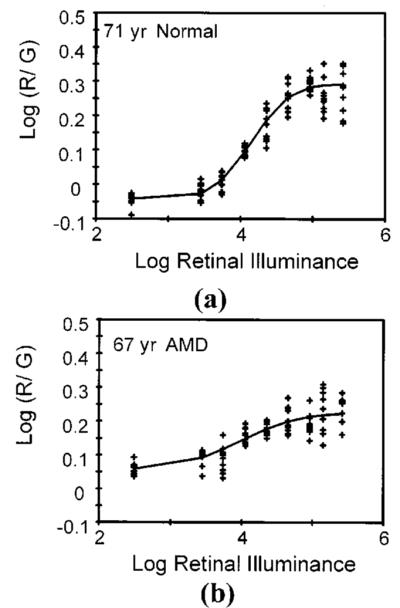
Two examples of color matching data. (a) Color matching data as a function of retinal illuminance from a control subject, showing individual data points. (b) Same experimental procedure, but with a patient having early AMD.
Fig. 3.
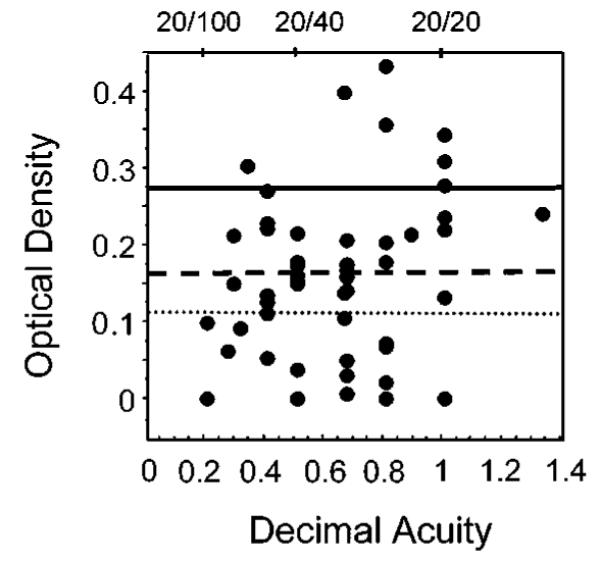
Maximum possible optical density of cone photopigment, ODmax , showing the wide range for patients with AMD. ODmax is plotted against visual acuity to show no correlation. Solid line, the mean optical density of normal subjects. Dashed line, 2 standard deviations less than the mean. Dotted line, 3 standard deviations less than the mean.
Visual acuity ranged from 20/10 to 20/70, with most patients having better than 20/50. Visual acuity was uncorrelated with ODmax at study entry for the 49 patients who could perform color matches (r = 0.210, p = 0.147) (Fig. 3). This comparison included the largest number of patients available to permit fitting, as well as the greatest range of optical density values available. For the data of only those patients within 2 standard deviations of the normative value for optical density, there was also no significant relation to visual acuity (r = 0.003, p = 0.99).
B. Kinetic Hypothesis
To test whether slowed kinetics alone explains the finding of reduced optical density, we first used the data for only the 28 subjects who had data that were sufficiently well fitted by the four-parameter model to obtain estimates of I0 : rms error <0.128. The mean value for ODfit was 0.224 log unit, not significantly less than the value of the normative data ( p = 0.136). We performed the three analyses of the kinetic data described in Subsection 2.C. First, the kinetic hypothesis predicts that the mean of I0 should be significantly less than the normative value reported previously of 4.37 log Td. We found that the observed mean was significantly greater, 4.61 log Td ( p < 0.042) (Fig. 4). This finding is inconsistent with slowed kinetics without concomitant and significant photoreceptor disruption or decreased photosensitivity. Assuming that those patients with the earliest possible damage had the optical density values closest to normal, we additionally analyzed data for only the subjects with sufficient photopigment to fall within 2 standard deviations from the mean for the normal subjects. This mean of I0 , 5.023 log Td, was also significantly greater, not less, than the normative value reported previously ( p = 0.019). Such large increases in I0 , 0.3–0.6 log unit, represent far greater changes in I0 than expected from either the inter-individual differences for normal subjects or the negligible changes in the transmission of the 590-nm standard through aging lenses.28,29
Fig. 4.
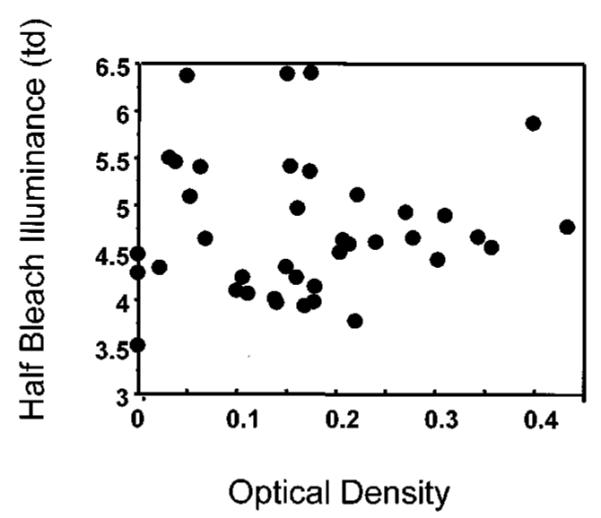
Amount of light needed to bleach half the photopigment (I0), plotted as a function of ODmax , indicating that the majority of values are larger than the average of 4.37 log Td found in control subjects.
Second, if the slowed regeneration kinetics led to decreased optical density, then the subjects with small changes in optical density should have slightly slower kinetics and therefore lower values of I0 . In our control sample, subjects had slightly but significantly slower regeneration from age 30 yr and upward ( p < 0.05), but I0 was uncorrelated with the optical density. In the present study, ODfit was significantly correlated, but positively, with I0 only when the full sample was used (r = 0.589, p = 0.0007). Patients with optical density near normal had unusually high values of I0 compared with the control subjects. ODfit was not significantly correlated with I0 for the subgroup of patients with good fits, although the correlation was again positive. ODmax was uncorrelated with I0 , regardless of which subgroup was tested. Our data neither support nor refute the possibility of kinetic changes after the occurrence of severe cone dysfunction that results in significantly reduced cone photopigment, as there is a wide range of values for I0 for these patients.
Third, if the moderate levels of light bleached an everincreasing proportion of photopigment in the patients with AMD, then a steady state might not be reached at the low retinal illuminances. Each successive setting would have required more long-wavelength primary (more red shifted). In general, this was not the case for matching performed at either of the two lowest retinal illuminances tested, 2.4 or 3.4 log Td, regardless of the patient’s cone photopigment optical density (Fig. 5). The data were stable over trials; there is no obvious trend toward a higher value of log (red/green) at either the 2.4 or 3.4 log Td conditions. The trials in this figure were not necessarily evenly spaced in time, since the timing depended on the subject. Therefore we computed a nonparametric statistic for each patient at each of the two light levels that was based on rank order: the Pearson product moment correlation, rho. Twenty-two patients had good fits to the bleaching data, providing forty-four data sets. Nineteen had negative values of rho and twenty-five had positive values. Five were considered significant negative correlations, six were significant positive correlations, and thirty-three were not significant. This provides evidence more for a practice effect than for support for the kinetic hypothesis, which would predict positive values of rho due to continued bleaching at low intensity conditions. Our previous finding of older subjects typically having their lowest standard deviations for the settings at the lowest retinal illuminances tested also described the data of these patients with early AMD. The magnitude of standard deviations depended on the subgroup of patients selected.
Fig. 5.
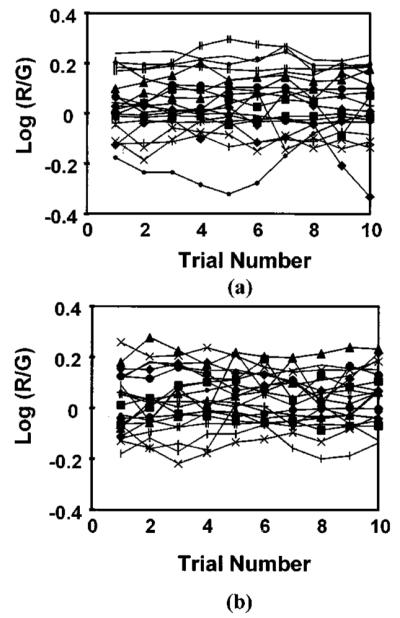
Individual color match settings at the two lowest retinal illuminances, showing no change in the settings with increasing time spent at that retinal illuminance, regardless of whether a patient had normal or decreased cone photopigment optical density. (a) Lowest intensity, (b) second intensity. Note the consistency of the settings of each patient.
All three analyses of the kinetic hypothesis indicate that reduced trafficking through the RPE does not describe our data. We cannot rule out that some patients may have a form of AMD that is consistent with the kinetic hypothesis or that there is reduced trafficking that does not greatly affect cone photopigment optical density.
4. DISCUSSION
The initial stages of AMD were accompanied by a measured decrease in the optical density of the cone photopigments. These results agree with findings from other laboratories that used only one light level for color matches: the color matches of patients with early AMD differ from normal color matches in that more of the long-wavelength primary is needed. Our results confirm that this difference is due to the change in spectral sensitivities with self-screening when there is low optical density of the cone photopigments.3,4,7,12 This change in the lowlight-level color matches is in the opposite direction from that caused by the preretinal filtering due to cataractous lens,28,34 as previously reported. A comparison either across light levels or across loci is useful in interpreting the data in populations with lens changes. The previous studies included only color matches performed at low-to-moderate light levels. Our findings are based on the difference between color matches made at high and moderate light levels, which provides a measure of optical density, indicating that the previous interpretation of reduced optical density is correct. A variety of field sizes and methods were used in the four studies. Taken together, these studies indicate that reduced effective density is typical in the central macula for a considerable proportion of patients with early AMD, even those with good visual acuity.
Our analysis rejects the kinetic hypothesis, that cone function is poor only because the photopigment regeneration rate is reduced as a result of slowed trafficking through the RPE cells. Slowed trafficking may be the case in some forms of the disease and may lead to further damage of photoreceptors or the RPE cell per se. However, the larger effect before widespread and severe damage appeared to be poor photosensitivity of the cones. Eisner et al. found that a combination of color matching and dark adaptation predicted exudation better than either alone.4
Our data do not indicate the source of decreased photosensitivity. One hypothesis is abnormal cone orientation.44 An abnormality of the Stiles–Crawford type I effect predicts a negative correlation between the half-bleach illuminance and optical density,36 a prediction inconsistent with our results. Our results are more consistent with a decreased ability of the cones to capture light due to an altered microenvironment that could reduce the quantal catch per cone. Examples include a reduction in pumping action of the RPE, altered photopigment molecules, or disruptions to the composition and structure of the cones. Specific models are needed to determine whether a linear correlation is expected between optical density and changes in photosensitivity and whether different forms of AMD are related to different types of cone changes. For instance, early changes leading to poor guidance might combine with several later changes, which could include slowed trafficking. Changes such as these are consistent with previous findings of a Type I psychophysical Stiles–Crawford effect3 in patients with a wide range of stages of AMD, even if the cones are not tilted by a build-up of fluid exudation or large debris.45,46
The results of this and previous studies are consistent with a progression of disease in which the cones of most patients undergo a period of prolonged structural abnormality before they are lost. It is not only the long- and middle-wavelength-sensitive cones as in the present results that are affected more in AMD than in aging alone but the short-wavelength-sensitive cone pathways as well.13–15,19 While atrophy of retinal cells clearly leads to vision loss at a given location, there are many years between the early changes and the more extreme outcomes. Satisfactory models exist for only some types of loss of visual function in the disease stages before atrophy. With more information concerning how and when the damage to the retina and RPE affects the full range of visual functions, it might be possible to detect at least some of the visual function deficits early with the goal of improved interventions.
ACKNOWLEDGMENTS
This research was supported by National Institutes of Health grants EYO4395 and EYO7624 and by the Chartrand Foundation.
This work was presented in part at meetings of the Association for Research in Vision and Ophthalmology in 1993 and 1998.
Footnotes
OCIS codes: 330.0330, 330.5310, 330.4300, 170.0170, 170.4470.
Contributor Information
Ann E. Elsner, Schepens Eye Research Institute and Harvard University, 20 Staniford Street, Boston, Massachusetts 02114
Stephen A. Burns, Schepens Eye Research Institute and Harvard University, 20 Staniford Street, Boston, Massachusetts 02114
John J. Weiter, Schepens Eye Research Institute and Harvard University, 20 Staniford Street Boston, Massachusetts, 02114, and Retina Specialists of Boston, 100 Charles River Plaza, Boston, Massachusetts 02114
REFERENCES
- 1.Leibowitz HM, Kruger DE, Maunder LR, Milton RC, Kini MM, Kahn HA, Nickerson RJ, Pool J, Colton TL, Ganley JP, Loewenstein JI, Dawber TR. The Framingham Eye Study Monograph: an ophthalmological and epidemiological study of cataract, glaucoma, diabetic retinopathy, macular degeneration and visual acuity in a general population of 2631 adults. Surv. Ophthalmol. 1980;24(Suppl.):335–610. [PubMed] [Google Scholar]
- 2.Sarks JP, Sarks SH, Killingsworth MC. Evolution of soft drusen in age-related macular degeneration. Eye. 1994;8:269–283. doi: 10.1038/eye.1994.57. [DOI] [PubMed] [Google Scholar]
- 3.Smith VC, Pokorny J, Diddie KR. Color matching and the Stiles–Crawford effect in observers with early age-related macular changes. J. Opt. Soc. Am. A. 1988;5:2113–2121. doi: 10.1364/josaa.5.002113. [DOI] [PubMed] [Google Scholar]
- 4.Eisner A, Klein ML, Zilis JD, Watkins MD. Visual function and the subsequent development of exudative age-related macular degeneration. Invest. Ophthalmol. Visual Sci. 1992;33:3091–3102. [PubMed] [Google Scholar]
- 5.Elsner AE, Bartsch D-U, Weiter JJ, Hartnett ME. New devices in retinal imaging and functional evaluation. In: Freeman W, editor. Practical Atlas of Retinal Disease and Therapy. 2nd ed Lipincott-Raven; New York: 1998. pp. 19–55. [Google Scholar]
- 6.Fletcher DC, Schuchard RA. Preferred retinal loci relationship to macular scotomas in a low-vision population. Ophthalmology. 1997;104:632–638. doi: 10.1016/s0161-6420(97)30260-7. [DOI] [PubMed] [Google Scholar]
- 7.Burns SA, Elsner AE, Weiter JJ, Kreitz MR. Noninvasive Assessment of the Visual System. Vol. 1 of 1991 OSA Technical Digest Series. Optical Society of America; Washington, D.C.: 1991. Cone photopigment density in aging and AMD; pp. 194–197. [Google Scholar]
- 8.Klein R, Klein BE, Linton KL. Prevalence of age-related maculopathy. The Beaver Dam Eye Study. Ophthalmology. 1992;99:933–943. doi: 10.1016/s0161-6420(92)31871-8. [DOI] [PubMed] [Google Scholar]
- 9.Sunness JS. The natural history of geographic atrophy, the advanced atrophic form of age-related macular degeneration. Mol. Vision. 1999;5:25. [PubMed] [Google Scholar]
- 10.Macular Photocoagulation Study Group Laser photocoagulation for juxtafoveal choroidal neovascularization. Arch. Ophthalmol. 1994;112:500–509. [PubMed] [Google Scholar]
- 11.Hartnett ME, Weiter JJ, Staurenghi G, Elsner AE. Deep retinal vascular anomalous complexes in advanced age-related macular degeneration. Ophthalmology. 1996;103:2042–2053. doi: 10.1016/s0161-6420(96)30389-8. [DOI] [PubMed] [Google Scholar]
- 12.Swanson WH, Fish GE. Color matches in diseased eyes with good acuity: detection of deficits in cone optical density and in chromatic discrimination. J. Opt. Soc. Am. A. 1995;12:2230–2236. doi: 10.1364/josaa.12.002230. [DOI] [PubMed] [Google Scholar]
- 13.Haegerstrom-Portnoy G, Brown B. Two-color increment threshold in early age-related maculopathy. Clin. Vision Sci. 1989;4:165–172. [Google Scholar]
- 14.Brown B, Lovie-Kitchen J. Temporal function in age related maculopathy. Clin. Exp. Optom. 1987;70.4:112–116. [Google Scholar]
- 15.Applegate RA, Adams AJ, Cavender JC, Zisman F. Early color vision changes in age-related maculopathy. Appl. Opt. 1987;26:1458–1462. doi: 10.1364/AO.26.001458. [DOI] [PubMed] [Google Scholar]
- 16.Mayer MJ, Spiegler SJ, Ward B, Glucs A, Kim CB. Mid-frequency loss of foveal flicker sensitivity in early stages of age-related maculopathy. Invest. Ophthalmol. Visual Sci. 1992;33:3136–3142. [PubMed] [Google Scholar]
- 17.Sandberg MA, Weiner A, Miller S, Gaudio AR. High-risk characteristics of fellow eyes of patients with unilateral neovascular age-related macular degeneration. Ophthalmology. 1998;105:441–447. doi: 10.1016/S0161-6420(98)93025-1. [DOI] [PubMed] [Google Scholar]
- 18.Sandberg MA, Gaudio AR. Slow photostress recovery and disease severity in age-related macular degeneration. Retina. 1995;15:407–412. doi: 10.1097/00006982-199515050-00006. [DOI] [PubMed] [Google Scholar]
- 19.Remky A, Elsner AE, Lichtenberg K, Arend O. Short wavelength automated perimetry in age-related maculopathy. Br. J. Ophthalmol. doi: 10.1136/bjo.85.12.1432. (to be published) [DOI] [PMC free article] [PubMed] [Google Scholar]
- 20.Moraes L, Elsner AE, Kunze C, Trempe CL, Hartnett ME. Correlation in patients with age-related maculopathy between retinal sensitivity and anatomic abnormalities using a scanning laser ophthalmoscope. Invest. Ophthalmol. Visual Sci. Suppl. 1998;39:B602. [Google Scholar]
- 21.Stone EM, Webster AR, Vandenburgh K, Streb LM, Hockey RR, Lotery AJ, Sheffield VC. Allelic variation in ABCR associated with Stargardt’s disease but not age-related macular degeneration. Nat. Genet. 1998;20:328–329. doi: 10.1038/3798. [DOI] [PubMed] [Google Scholar]
- 22.Souied EH, Ducroq D, Rozet JM, Gerber S, Perrault I, Munnich A, Coscas G, Soubrane G, Kaplan J. ABCR gene analysis in familial exudative age-related macular degeneration. Invest. Ophthalmol. Visual Sci. 2000;41:244–247. [PubMed] [Google Scholar]
- 23.Walker JP, Wing GL, Raskauskas PA, Kelley LM, Beausencourt E, Remky A, Elsner AE. Non-exudative age-related macular degeneration: association of fundus features with heart disease. Invest. Ophthalmol. Visual Sci. Suppl. 1997;38:S94. [Google Scholar]
- 24.Mullins RF, Russell SR, Anderson DH, Hageman GS. Drusen associated with aging and age-related macular degeneration contain proteins common to extracellular deposits associated with atherosclerosis, elastosis, amyloidosis, and dense deposit disease. Faseb J. 2000;14:835–846. [PubMed] [Google Scholar]
- 25.Curcio CA, Millican CL, Bailey T, Kruth HS. Accumulation of cholesterol with age in human Bruch’s membrane. Invest. Ophthalmol. Visual Sci. 2001;42:265–274. [PubMed] [Google Scholar]
- 26.Keunen JEE, van Norren D, van Meel GJ. Density of foveal cone pigments at older age. Invest. Ophthalmol. Visual Sci. 1987;28:985–991. [PubMed] [Google Scholar]
- 27.Coile DC, Baker HD. Foveal dark adaptation photopigment regeneration and aging. Visual Neurosci. 1992;8:27–39. doi: 10.1017/s0952523800006465. [DOI] [PubMed] [Google Scholar]
- 28.Elsner AE, Berk L, Burns SA, Rosenberg PA. Aging and human cone photopigments. J. Opt. Soc. Am. A. 1988;5:2106–2112. doi: 10.1364/josaa.5.002106. See also Ref. 29.
- 29.Elsner AE, Burns SA. OSA Annual Meeting. Vol. 18 of 1989 OSA Technical Digest Series. Optical Society of America; Washington, D.C.: 1989. Models of photopigment kinetics: changes with age; p. 214. [Google Scholar]
- 30.Burns SA, Elsner AE. Color matching at high illuminances: the color-match-area effect and photopigment bleaching. J. Opt. Soc. Am. A. 1985;2:698–704. doi: 10.1364/josaa.2.000698. [DOI] [PubMed] [Google Scholar]
- 31.Burns SA, Elsner AE, Lobes LA, Jr., Doft BH. A psychophysical technique for measuring cone photopigment bleaching. Invest. Ophthalmol. Visual Sci. 1987;28:711–717. [PubMed] [Google Scholar]
- 32.Smith VC, Pokorny J, Starr SJ. Variability of color mixture data—I. Interobserver variability in the unit coordinates. Vision Res. 1976;16:1087–1094. doi: 10.1016/0042-6989(76)90247-9. [DOI] [PubMed] [Google Scholar]
- 33.Eisner A, Fleming SA, Klein ML, Mouldin WM. Sensitivities in older eyes with good acuity: crosssectional norms. Invest. Ophthalmol. Visual Sci. 1987;28:1824–1831. [PubMed] [Google Scholar]
- 34.Lakowski R. Age and Colour vision. Adv. Sci. 1958;15:231–236. [Google Scholar]
- 35.Alpern M. Lack of uniformity in colour matching. J. Physiol. (London) 1979;288:85–105. [PMC free article] [PubMed] [Google Scholar]
- 36.Burns SA, Elsner AE. Color matching at high illuminances: photopigment optical density and pupil entry. J. Opt. Soc. Am. A. 1993;10:221–230. doi: 10.1364/josaa.10.000221. [DOI] [PMC free article] [PubMed] [Google Scholar]
- 37.Swanson WH, Fish GE. Age-related changes in the color-match-area effect. Vision Res. 1996;36:2079–2085. doi: 10.1016/0042-6989(95)00280-4. [DOI] [PubMed] [Google Scholar]
- 38.Elsner AE, Burns SA, Beausencourt E, Weiter JJ. Foveal cone photopigment distribution: small alterations associated with macular pigment distribution. Invest. Ophthalmol. Visual Sci. 1998;39:2394–2404. [PubMed] [Google Scholar]
- 39.Elsner AE, Burns SA, Lobes LA., Jr. Foveal cone pigment optical density in retinitis pigmentosa. Appl. Opt. 1987;26:1378–1384. doi: 10.1364/AO.26.001378. [DOI] [PubMed] [Google Scholar]
- 40.Burns SA, Elsner AE, Lobes LA., Jr. Foveal cone photopigment bleaching in central serous retinopathy. Appl. Opt. 1988;27:1045–1049. doi: 10.1364/AO.27.001045. [DOI] [PubMed] [Google Scholar]
- 41.Burns SA, Elsner AE, Lobes LA., Jr. Cone function deficits in patients with good visual acuity. Invest. Ophthalmol. Visual Sci. Suppl. 1987;28:128. [Google Scholar]
- 42.Elsner AE, Burns SA, Lobes LA, Jr., Doft BH. Cone photopigment abnormalities in diabetes. Invest. Ophthalmol. Visual Sci. 1987;28:718–724. [PubMed] [Google Scholar]
- 43.Elsner AE, Burns SA, Lobes LA, Doft BH. Photopigment concentration, light and dark adaptation. Invest. Ophthalmol. Visual Sci. Suppl. 1984;25:311. [Google Scholar]
- 44.Smith VC, Pokorny J, Diddie KR. Color matching and Stiles–Crawford effect in central serous choroidopathy. Mod. Probl. Ophthalmol. 1978;19:284–295. [PubMed] [Google Scholar]
- 45.Elsner AE, Burns SA, Weiter JJ, Delori FC. Infrared imaging of subretinal structures in the human ocular fundus. Vision Res. 1996;36:191–205. doi: 10.1016/0042-6989(95)00100-e. [DOI] [PubMed] [Google Scholar]
- 46.Hartnett ME, Elsner AE. Characteristics of exudative age-related macular degeneration determined in vivo with confocal and indirect infrared imaging. Ophthalmology. 1996;103:58–71. doi: 10.1016/s0161-6420(96)30731-8. [DOI] [PubMed] [Google Scholar]