Abstract
The regulation and function of autophagy and lipid metabolism have recently been reported to be reciprocally related. Macroautophagy mediates the breakdown of lipids stored in lipid droplets. An inhibition of autophagy leads to the development of a fatty liver. We evaluated the ability of CYP2E1 to modulate the effects of ethanol on lipid accumulation and autophagy in vitro. The E47 HepG2 cell which expresses CYP2E1 was treated with ethanol at 50, 100 and 150 mM for 4 or 5 days. Ethanol induced lipid accumulation and an increase of triglycerides (TG) in E47 cells to a greater extent than in control C34 cells which do not express CYP2E1. In contrast, autophagy (LC3 II/LC3 I ratio) was significantly induced by ethanol in C34 cells to a greater extent than in E47 cells. P62 was significantly increased in E47 cells after ethanol treatment. Thus, there is a reciprocal relationship between the effects of ethanol on lipid accumulation and autophagy in the CYP2E1-expressing cells. Inhibition of autophagy by 3-methyladenine (3MA), increased lipid accumulation and TG levels in C34 cells which display elevated autophagy, but enhanced lipid accumulation and TG level to a lesser extent in E47 cells which displayed lower autophagy. Ethanol induced CYP2E1 activity and oxidative stress in E47 cells compared with C34 cells. These experiments suggest that the expression of CYP2E1 may impair autophagy formation which contributes to lipid accumulation in the liver. We hypothesize that CYP2E1-induced oxidative stress promotes the accumulation of lipid droplets by ethanol and this may be responsible for the suppression of autophagy in the liver.
Keywords: Ethanol, CYP2E1, ROS, HepG2 E47 cells, steatosis, autophagy
1. Introduction
Alcohol-induced liver injury is a multifactorial process involving several mechanisms [1], [2], including ethanol-induced oxidative stress [3]. Many pathways have been suggested to contribute to the ability of ethanol to induce a state of oxidative stress [4]. One central pathway is the induction of cytochrome P4502E1 by ethanol. CYP2E1 metabolizes and activates ethanol to more reactive, toxic products such as acetaldehyde and the 1-hydroxyethyl radical. CYP2E1 is also an effective generator of reactive oxygen species [5], [6]. We recently reported that CYP2E1 plays a role in experimental fatty liver in an oral, Lieber-DeCarli ethanol-feeding model. Fatty liver was observed in wild type mice but not in CYP2E1 knockout mice fed ethanol chronically [7]. Fatty liver developed and was observed again when CYP2E1 was restored to the CYP2E1 knockout mice (humanized CYP2E1 knock-in mice) [8], suggesting that CYP2E1 is critical to the alcohol-induced liver steatosis.
Autophagy is a self-degradative and recycling process to balance sources of energy. It plays a major role in clearing misfolded or aggregated protein, organelles and intracellular pathogens. Autophagy protects against genome instability and prevents necrosis. Therefore autophagy is involved in the pathogenesis of many diseases and can be activated under several stress conditions [9]. Autophagy can mediate fat mobilization and breakdown in liver cells. Autophagy regulates lipid content, and there is a reverse relationship between intracellular lipid and autophagic clearance [10]. Inhibition of autophagy increased TG and lipid droplets (LD) in liver cells and loss of autophagy decreased TG breakdown and promoted lipid accumulation, which could then further suppress autophagy function resulting in an enhanced lipid retention in the liver cells [10].
To study the role of autophagy in CYP2E1 mediated ethanol liver steatosis, HepG2 E47 cells which express CYP2E1 and C34 control cells which do not, were treated with ethanol or ethanol plus the autophagy inhibitor 3MA. Ethanol-induced autophagy and the accumulation of LD and TG content were determined. It was found that ethanol treatment induced lipid accumulation and increased TG content significantly more in E47 cells than in C34 cells. In contrast, ethanol induced significantly higher autophagy in C34 cells than in E47 cells. There was a reciprocal relationship between ethanol-induced lipid accumulation and the extent of ethanol elevation of autophagy in the E47 cells. The inhibition of autophagy by 3MA led to lipid accumulation in both C34 and E47 cells.
2. Materials and Methods
2.1. Cells and Treatment
HepG2 E47 and control C34 cells were used in this study. E47 cells are HepG2 cells which were transfected with human CYP2E1 cDNA and constantly express CYP2E1. The control C34 cells are HepG2 cells which were transfected with empty vector only and do not express CYP2E1. Cells were treated with 50, 100 or 150 mM ethanol in the presence or absence of the autophagy inhibitor 3MA (10 mM, Sigma Chemical CO.). Cells with alcohol treatment were cultured in a CO2 incubator containing 5% CO2 and saturated with 50 mM or 100 mM alcohol to slow down the evaporation of ethanol in the medium. Fresh medium containing ethanol or 3MA was replaced every day.
Lipid droplet and triglyceride determination
Lipid droplets were determined by Oil Red O Staining. Cells were grown on a cover slide. After treatment, the cells were fixed with 10 % buffered formalin for 10 min and placed in absolute propylene glycol for 5 min and then stained in pre-warmed Oil Red O solution for 10 min in a 60° C water bath. Slides were differentiated in 85% propylene glycol solution for 5 min and stained in Gill’s Hematoxylin for 30 seconds. After mounting with glycerol-PBS medium, the red stained lipid droplets were observed under a light microscope. TG levels in the cells after treatment with ethanol or ethanol plus 3MA were determined with a kit from Pointe Scientific (Canton, Michigan) following the guide provided by the company, and results were expressed as μg TG per mg cell protein.
2.2. Autophagy analysis
Levels of autophagy after treatment with ethanol in the presence or absence of 3MA were detected by determining amounts of LC3 in cell lysates by immunoblot analyses using a LC3 polyclonal antibody from Thermo Scientific (Rockford, Illinois). An Immunoflurorescence assay was also carried out to localize LC3 in the cells. Cells were grown on cover slides and treated with ethanol in the absence and presence of 10 mM 3MA. Cells were fixed with 10 % buffered formalin and incubated with LC3 antibody (1:300) in a humidity incubation box for 3 hours. After rinsing with PBS, the cells were incubated with FITC conjugated secondary antibody for 1 hour and mounted with glycerol-PBS medium. The presence of LC3 was observed under a fluorescence microscope. Ten fields were randomly picked and counted for the positive stained cells.
2.3. Cell viability, CYP2E1 activity, lipid peroxidation and ROS
HepG2 E47 and C34 cells were treated with 100 mM ethanol for 4 or 5 days and cell viability was determined by MTT assay (thiazolyl blue, tetrazolium bromide, Sigma Chemical Co.). CYP2E1 activity was analyzed by measuring the rate of oxidation of 1 mM para-nitrophenol to para-nitrocatechol by 100 μg of microsomal protein incubated for 1 hour at 37°C [11]. Lipid peroxidation was determined by measuring malondialdehyde as detected by the TBARS assay (TBARS, ThioBarbituric Acid Reactive Substances) [12]. Total cellular ROS produced after ethanol administration was determined with a Total ROS Detection Kit purchased from Enzo Life Sciences (Plymouth Meeting, PA). The fluorescence activated by ROS was detected under a fluorescence microscope. At least 15 fields in each culture plate were observed to determine the fluorescence intensity.
2.4. Statistics
Statistical analysis was carried out using One-Way ANOVA followed by the student-Newman-Keuls Post hoc test.
3. Results
3.1. Ethanol induces steatosis to a greater extent in E47 cells than in C34 cells
The treatment of HepG2 E47 cells with 50 to 150 mM ethanol for 5 days causes significant lipid accumulation in the cells (Fig. 1). Treatment of C34 cells with ethanol in concentrations of 50, 100 or 150 mM, induced much less lipid droplets (Fig. 1A). Since TG is the major component of the lipid droplets, TG levels in E47 and C34 cells after ethanol treatment were determined. In E47 cells, ethanol treatment for 5 days increased TG levels from 130 μg/mg cellular protein to 360, 395 and 365 μg/mg at ethanol concentrations of 0, 50, 100 and 150 mM respectively. In C34 cells, ethanol treatment produced smaller increases in TG content; levels were 22, 50, 75 and 80 μg/mg at concentrations of 0, 50 100 and 150 mM ethanol, respectively.
Fig. 1. Ethanol induces steatosis in E47 but not C34 cells.
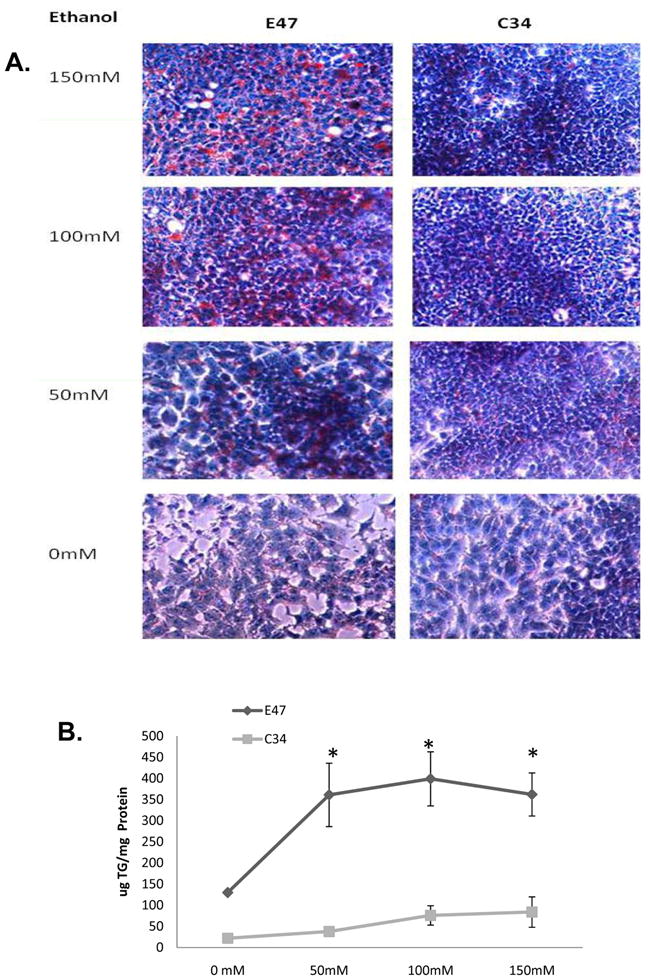
E47 and C34 cells were treated with ethanol at concentrations of 0, 50, 100 and 150 mM, respectively for 5 days in a humidity atmosphere which was saturated with a 50 mM ethanol solution. Oil Red O Staining (A) was carried out to evaluate the accumulation of lipid droplets. The TG levels (B) in the cell lysate were determined, and results represented as ug/mg cell lysate protein. Results reflect mean±SD and are from three experiments. * P<0.05, compared with C34 cells.
3.2. Ethanol induces autophagy to a greater extent in C34 cells than in E47 cells
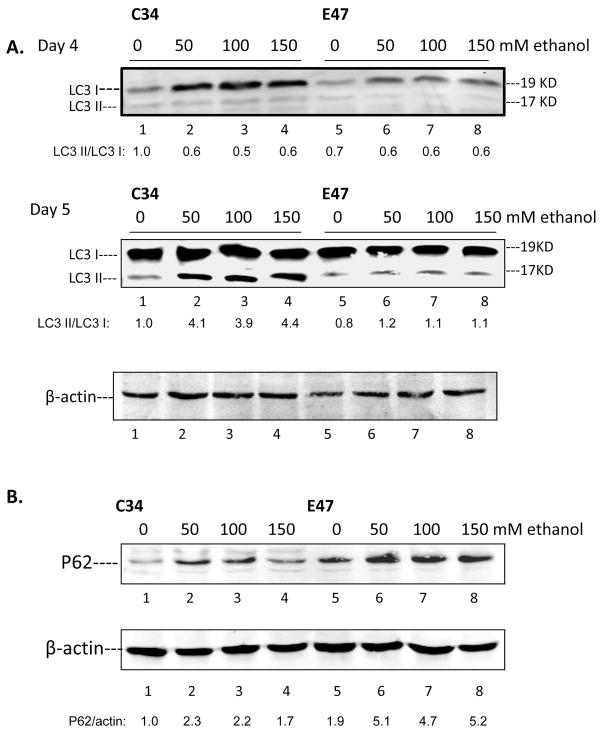
Autophagy can mediate the breakdown of lipids stored in LD in the liver. To determine whether ethanol can induce autophagy in E47 or C34 cells, the level of the autophagy marker LC3 was determined and the LC3 I and LC3 II ratio was calculated to assess autophagy flux in the cells after treatment with ethanol for 4 or 5 days. Ethanol treatment significantly increased autophagy in C34 cells which do not express CYP2E1 and contain few lipid droplets but ethanol induced less autophagy in E47 cells with elevated lipid droplets (Fig. 2A). LC3 I levels were higher in the absence of ethanol in C34 cells compared to E47 cells and levels of LC3 I were increased about 4 and 2 fold after ethanol treatment for 4 days in C34 and E47 cells, respectively. LC3 II was induced 4 fold after 50 to 150 mM ethanol treatment for 5 days in C34 cells but no induction was found in E47 cells. Thus, ethanol elevated autophagy flux (increased LC3 II/CL3 I ratio) in C34 cells four-fold but did not increase autophagy flux in E47 cells.
Fig. 2. Ethanol induced autophagy is enhanced in C34 cells to a greater extent than in E47 cells.
E47 and C34 cells were treated with 50–150 mM ethanol for 4 or 5 days. Cell lysates were prepared and immunoblots were carried out to determine the levels of the autophagy marker LC3 I and LC3II (A). Bands of LC3 I and II were scanned and the LC3 II/LC3 I ratio determined. P62 levels in E47 and C34 cells (B) were determined by immunoblot with a polyclonal antibody. The P62/β-actin ratio is shown below the blot.
P62/SQSTM1 is degraded by autophagy through direct interaction with LC3. A decrease of autophagy may lead to the accumulation of p62 [13]. P62 levels in E47 and C34 cells were determined to further support differences in the induction of autophagy after ethanol treatment in E47 and C34 cells. In contrast to the greater increase of autophagy after ethanol treatment in C34 cells compared to E47 cells, p62 protein levels was induced to a lesser extent by ethanol in C34 cells (1.7 to 2.3 fold) compared with E47 cells (4.7 to 5.2 fold). Levels of p62 were also higher in E47 than C34 cells even in the absence of ethanol, in contrast to the lower levels of LC3 in E47 than C34 cells. These results somewhat surprisingly suggest that the expression of CYP2E1 may impair ethanol induced autophagy.
3.3. Ethanol induces CYP2E1 activity, lipid peroxidation and ROS formation and decreases cell viability in E47 cells
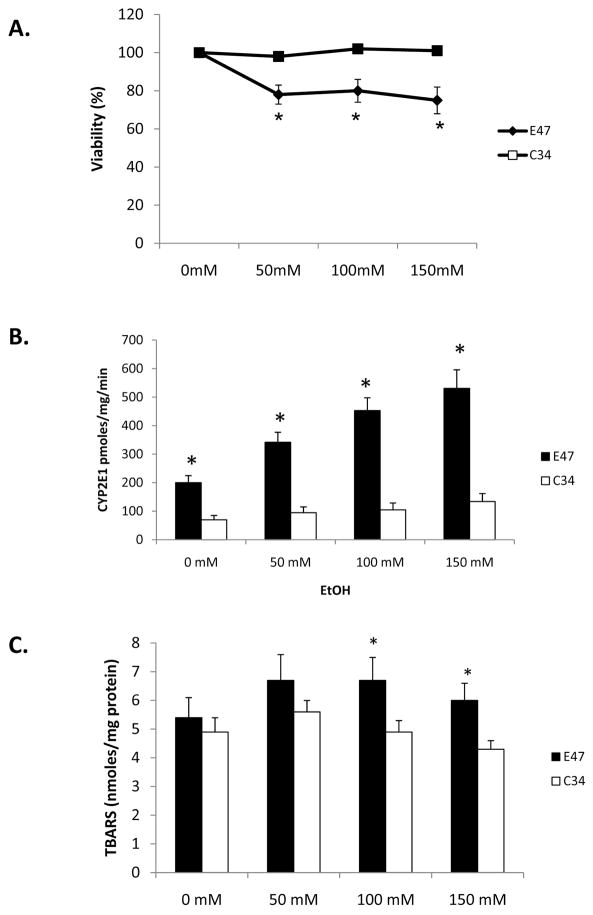
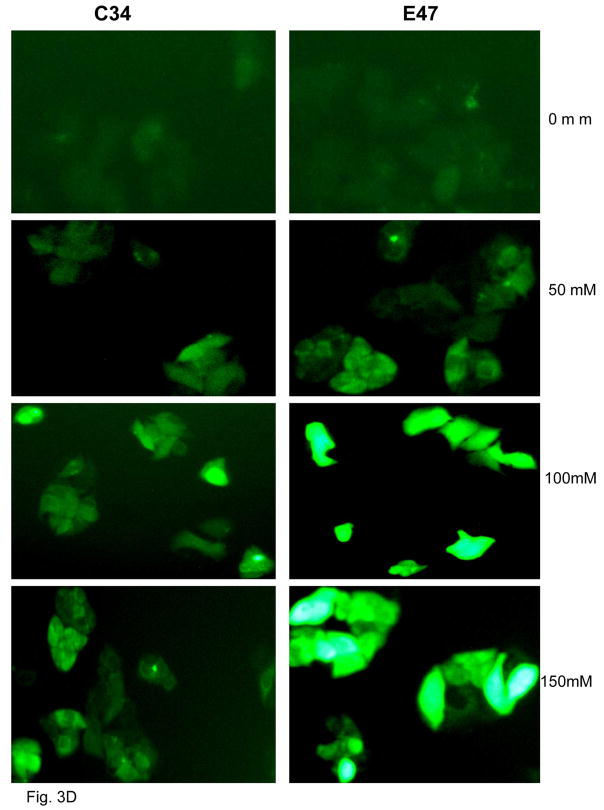
MTT assay was carried out to determine the viability of E47 and C34 cells after 5 day ethanol treatment. Ethanol decreased cell viability 25 % in E47 cells but had no effect in C34 cells (Fig. 3A). Ethanol treatment also induced CYP2E1 activity from 200 pmoles/min/mg in the absence of ethanol to 345, 435 and 500 pmoles/min/mg microsomal protein at ethanol concentrations of 0, 50, 100 and 150 mM, respectively, in E47 cells but no CYP2E1 activity was induced in C34 cells (Fig. 3B). The TBARS assay was carried out to determine lipid peroxidation after ethanol treatment. Malondialdehyde levels increased from 5.4 nmoles/mg E47 cell lysate protein in the absence of ethanol to 6.0 to 6.5 nmole/mg protein in the presence of ethanol (Fig. 3C). Ethanol did not increase lipid peroxidation in C34 cells (Fig. 3C). Ethanol significantly induced ROS production in E47 cells to a much greater extent than in C34 cells (Fig. 3D).
Fig. 3. Effects of Ethanol on CYP2E1 activity, ROS stress and cellular viability.
E47 and C34 cells were treated with 50–150 mM ethanol for 5 days. MTT assay was carried out to determine cell viability. P<0.05, E47 cells compared to C34 cells (A). CYP2E1 activity was analyzed by determining the oxidation of para-nitrophenol, and results are presented as pmoles/min/mg microsomal protein P< 0.05, E47 cells compared to C34 cells (B). Lipid peroxidation was evaluated by determining the production of malondialdehyde (nmoles/mg cellular protein) (C) by the TBARS assay. Results are from three experiments. P<0.05, E47 cells compared to C34 cells. E47 and C34 cells were treated with ethanol for 5 days and ROS was detected with a fluorescence Total ROS Detection Kit (D). Fifteen different fields in each plate were observed under the fluorescence microscope to determine the fluorescence intensity.
3.4. The inhibition of autophagy increases ethanol-induced accumulation of lipid droplets
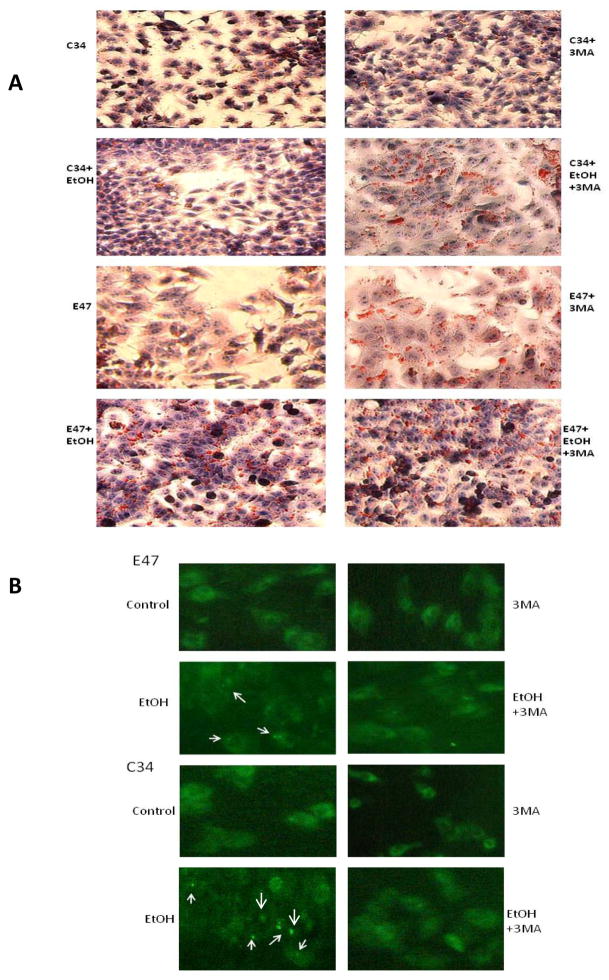
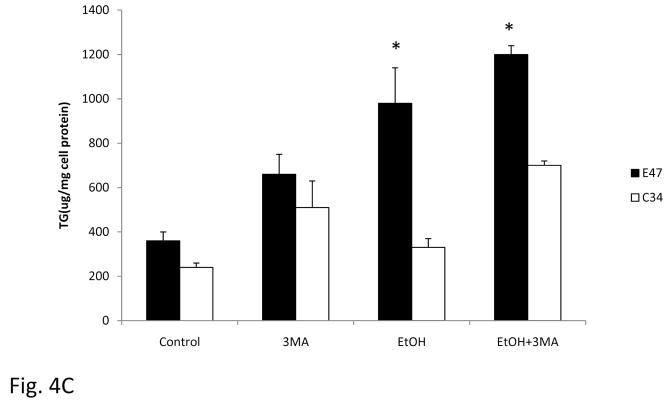
To evaluate whether autophagy plays a role in alcohol induced lipid accumulation in C34 and especially E47 cells, cells were treated with ethanol in the presence or absence of 3MA, and the accumulation of LD was determined. Treatment of C34 cells with ethanol did not induce significant lipid accumulation as shown previously (Fig 1), but when autophagy was inhibited by 3MA, there was an increase in LD in C34 cells in the absence and especially in the presence of ethanol (Fig. 4A). Inhibition of autophagy also further increased LD in E47 cells in the absence of ethanol and to a lesser extent in the presence of ethanol which already displayed elevated LD formation in the presence of ethanol alone (Fig. 4A). An immunofluorescence assay to detect LC3 showed that in the presence of 3MA, ethanol induced autophagy was blocked and confirmed that ethanol induced higher autophagy in C34 cells than in E47 cells (Fig. 4B). There was an average of 7.6 fluorescence positive cells per field with an average of 4.5 fluorescence spots per ethanol-treated C34 cell compared with 2.6 fluorescence positive cells per field with 1.7 fluorescence spots per ethanol-treated E47 cell (Fig. 4B arrows). The contents of TG in the cells after ethanol treatment paralleled the results with Oil Red O Staining. The inhibition of autophagy by 3MA increased the TG content in E47 and C34 cells, in the absence of ethanol (Fig. 4C). Ethanol alone increased the TG content in E47 and to a slight extent in C34 cells. TG levels were further which was further increased in ethanol plus 3MA treated cells (Fig. 4C).
Fig. 4. Inhibition of autophagy promotes lipid accumulation in C34 and E47 cells.
E47 and C34 cells were treated with 100 mM ethanol or ethanol plus 3MA (10 mM) for 5 days. Oil Red O Staining was carried out to evaluate the accumulation of lipid droplets (A). The inhibition of autophagy by 3MA was determined with an immunofluorescence method which detects LC3 in the cellular cytosol. The arrows indicate the positive stained autophagy in the cells (B). The contents of TG after ethanol or ethanol plus 3MA treatment (C). * Significantly different P<0.05 compared with C34 cells (n=6).
4. Discussion
Alcoholic liver disease including alcoholic fatty liver, alcoholic hepatitis and alcoholic cirrhosis is a result of complex pathophysiological events involving several mechanisms, [14], [15]. CYP2E1 is suggested to play an important role in this process. After 4 weeks of oral ethanol feeding, macrovesicular fat accumulation and increase of liver triglycerides were observed in wild type mice but not in CYP2E1 knockout mice [7]. CYP2E1 and oxidative stress was induced by ethanol in wild-type mice but not in CYP2E1 knockout mice. Peroxisome proliferator- activated receptor α (PPARα), a regulator of fatty acid oxidation, was up-regulated in CYP2E1 knockout mice fed ethanol but decreased in wild-type mice [7]. Administration of ethanol to CYP2E1 knock-in mice restored ethanol-induced liver steastosis, increased TG content and down-regulated PPARα, effects as seen in wild-type mice. These results suggest that CYP2E1 plays an important role in ethanol induced liver steatosis [8]. In the current study, treatment of HepG2 cells with ethanol induced LD accumulation and enhanced TG content in HepG2 E47 cells which express CYP2E1 to a much greater extent than in the control HepG2 C34 cells, which do not express CYP2E1 (Fig. 1A, B). This result further suggests that CYP2E1 plays an important role in ethanol-induced liver steatosis.
Autophagy is a self-degratative pathway responsible for the turnover of long-lived proteins, clearance of damaged organelles and aggregate-prone proteins. It is also a process to recycle energy in times of nutrient deprivation [16], [17]. A dysfunction of autophagy results in cytoplasmic protein inclusions such as misfolded protein and excess accumulation of deformed organelles which may lead to liver injury and other diseases [18]. Autophagy mediates the breakdown of lipid stored in LD and inhibition of autophagy leads to the development of a fatty liver [10]. Autophagy and lipid have a bidirectional relationship. The change of cellular lipid content may be caused by altered autophagy function [19], [20]. Acute ethanol treatment induced autophagosome synthesis and promoted autophagy to remove damaged mitochondria and hepatic LD, and genetic knockdown of Atg7 by Atg7 siRNA to inhibit autophagy, promoted ethanol-induced lipid accumulation [13]. These results suggested that autophagy may play a role in ethanol induced steatosis. To compare the effect of both CYP2E1 and autophagy on ethanol-induced lipid accumulation in the liver and whether the expression of CYP2E1 impacts on the formation of macroautophagy in relation to ethanol-induced lipid accumulation, we evaluated whether ethanol induced autophagy in HepG2 E47 or C34 cells. In contrast to ethanol induction of LD accumulation in E47 cells to a greater extent than in C34 cells, ethanol administration induced autophagy to a greater extent in C34 cells than in E47 cells. P62/SQSTM1 an adaptor molecule which binds to both LC3 and ubiquitinated autophagic substrates and uptake and degradated by the autophagosome [21], was higher in the basal state in E47 cells and induced by ethanol to a greater extent in E47 cells than in C34 cells (Fig. 2). Current reports suggest that autophagy and lipid storage are reciprocally related. Increased liver augophagy enhances the degradation of lipid storage. Inversely, increased hepatocellular lipid accumulation can impair macroautophagy [ 22 ], [23]. In a cultured hepatocyte model, treatment with the fatty acid oleate impaired the movement of lipid through the autophagy pathway [10]. In a genetic model of obesity, the ob/ob mouse, hepatic macroautophagy function was inhibited [24]. Thus, cell lipid accumulation may lead to hepatocellular defects in macroautophagy. Ethanol did not significantly induce autophagy in E47 cells perhaps due to CYP2E1 mediated lipid accumulation in these cells leading to impairment of ethanol-induced autophagy, and blocking of macroautophagy. There were less LD accumulation in the C34 cells perhaps due to the lack of CYP2E1, which therefore, did not impair macroautophagy formation and consequently did not lower LD removed by autophagy.
ROS generated by ethanol metabolism is considered a major cause of autophagy induction [25], [26], [27]. ROS may act through impairment of the AKT/mTOR pathway which then promotes autophagy, since mTOR is the main negative regulator of autophagy [28], [29]. Acute ethanol administration may blunt AKT activation, an upstream activator of mTOR, thereby lowering mTOR activity, leading to increased autophagy [30], [31], [32]. Ethanol administration decreased E47 cell viability but not C34 cells; induced CYP2E1 activity in E47 but not in C34 cells, and induced higher lipid peroxidation and ROS formation in E47 cells than in C34 cells. Ethanol induced higher lipid accumulation and TG content in E47 cells (Fig. 1) but ethanol induced less autophagy in E47 cells compared with C34 cells. This suggests that CYP2E1 or CYP2E1- mediated ROS stress promotes the formation of lipid accumulation in association with impairment of the formation of macroautophagy.
Liver LD disposition is regulated by lysosomal or proteasomal degradation and can be broken down by lipolysis into free fatty acids for mitochondrial β-oxidation. This process is under the control of cytosolic lipases [33], [34]. Studies have suggested that macroautophagy may function to regulate hepatocyte lipid content by mediating breakdown of lipid droplet through so called macrolipophagy [10], which may be considered as another lipid degradative pathway in hepatocytes. To further evaluate whether autophagy plays a role in ethanol- induced lipid accumulation in E47 or C34 cells, the chemical inhibitor of autophagy, 3MA was used to block the autophagy, followed by determination of the formation of LD after ethanol administration. Ethanol did not significantly induce lipid accumulation in C34 cells but ethanol did significantly induce autophagy in C34 cells; the inhibition of autophagy by 3MA promoted the formation of LD in C34 and E47 cells (Fig. 4A, B). The inhibition of autophagy in ethanol-treated E47 cells by 3MA only slightly induced the accumulation of lipid and the TG content over the ethanol alone treated E47 cells, likely due to the already elevated lipid droplet and TG formation and diminished autophagy produced by ethanol in the E47 cells (Fig. 4C).
5. Conclusion
HepG2 E47 cells and control C34 cells were treated with ethanol. Lipid accumulation occurred in E47 cells to a higher extent than in C34 cells. In contrast, ethanol administration induced autophagy to a greater extent in C34 cells compared to E47 cells; p62/SQSTM1 was induced by ethanol in E47 cells but was degradated in C34 cells. The induction and expression of CYP2E1 by ethanol administration in E47 cells elevated ROS stress and promoted lipid accumulation which may suppress the formation of autophagy in E47 cells. The inhibition of autophagy by 3MA led to lipid accumulation in C34 and E47 cells, suggesting that autophagy plays a prominent role in lipid droplets breakdown and in regulating the ability of ethanol to modulate cellular lipid levels.
Acknowledgments
This research was supported by USPHS Grants AA017425 and 018790 from the National Institute on Alcohol Abuse and Alcoholism.
Footnotes
Publisher's Disclaimer: This is a PDF file of an unedited manuscript that has been accepted for publication. As a service to our customers we are providing this early version of the manuscript. The manuscript will undergo copyediting, typesetting, and review of the resulting proof before it is published in its final citable form. Please note that during the production process errors may be discovered which could affect the content, and all legal disclaimers that apply to the journal pertain.
References
- 1.Lieber CS. Alcoholic fatty liver: its pathogenesis and mechanism of progression to inflammation and fibrosis. Alcohol. 2004;34(1):9–19. doi: 10.1016/j.alcohol.2004.07.008. [DOI] [PubMed] [Google Scholar]
- 2.Cederbaum AI, Lu Y, Wu D. Role of oxidative stress in alcohol-induced liver injury. Arch Toxicol. 2009;83:519–548. doi: 10.1007/s00204-009-0432-0. [DOI] [PubMed] [Google Scholar]
- 3.Wu D, Cederbaum AI. Alcohol, oxidative stress and free radical damage. Alcohol Research & Health. 2003;27(4):277–284. [PMC free article] [PubMed] [Google Scholar]
- 4.Cederbaum AI. Microsomal generation of reactive oxygen species and their possible role in alcohol hepatotoxicity. Alcohol alcohol. 1991;(Suppl 1):291–296. [PubMed] [Google Scholar]
- 5.Guengerich FP. Oxidative cleavage of carboxylic esters by cytochrome p-450. J Biol Chem. 1987;262:8459–8462. [PubMed] [Google Scholar]
- 6.Potter TD, Coon MJ. Cytochrome P-450: multiplicity of isoforms, substrates, and catalytic and regulatory mechanism. J Biol Chem. 1991;266:13469–13472. [PubMed] [Google Scholar]
- 7.Lu Y, Zhuge J, Wang X, Bai J, Cederbaum AI. Cytochrome P450 2E1 contributes to ethanol-induced fatty liver in mice. Hepatology. 2008;47(5):1483–1494. doi: 10.1002/hep.22222. [DOI] [PubMed] [Google Scholar]
- 8.Lu Y, Wu D, Wang X, Ward SC, Cederbaum AI. Chronic alcohol-induced liver injury and oxidant stress are decreased in cytochrome P4502E1 knockout mice and restored in humanized cytochrome P4502E1 knock-in mice. Free Rad Biol Med. doi: 10.1016/j.freeradbiomed.2010.07.026. (In Press) [DOI] [PMC free article] [PubMed] [Google Scholar]
- 9.Glick D, Barth S, Mecleod K. Autophagy: cellular and molecular mechanism. J Pathol. 2010;221:3–12. doi: 10.1002/path.2697. [DOI] [PMC free article] [PubMed] [Google Scholar]
- 10.Singh R, Kaushik S, Wang Y, Xiang Y, Novak I, Komatsu M, Tanaka K, Cuervo AM, Czaja MJ. Autophagy regulates lipid metabolism. Nature. 2009;458:1131–1135. doi: 10.1038/nature07976. [DOI] [PMC free article] [PubMed] [Google Scholar]
- 11.Wu D, Cederbaum AI. Cytochrome P4502E1 sensitizes to tumor necrosis factor alpha-induced liver injury through activation of mitogen-activated protein kinases in mice. Hepatology. 2008;47:1005–1017. doi: 10.1002/hep.22087. [DOI] [PubMed] [Google Scholar]
- 12.Wu D, Cederbaum AI. Opposite action of S-adenosyl methionine and its metabolites on CYP2E1-mediated toxicity in pyrazole-induced rat hepatocytes and HepG2 E47 cells. Am J Physiol Gastrointest Liver Physio. 2006;290:674–684. doi: 10.1152/ajpgi.00406.2005. [DOI] [PubMed] [Google Scholar]
- 13.Ding WX, Li M, Yin XM. Autophagy reduces acute ethanol-induced hepatotoxicity and steatosis in mice. Gastroenterol. 2010 doi: 10.1053/j.gastro.2010.07.041. (In Press) [DOI] [PMC free article] [PubMed] [Google Scholar]
- 14.Tsukamoto H, Lu SC. Current concepts in the pathogenesis of alcoholic liver injury. FASEB J. 2001;15:1335–1349. doi: 10.1096/fj.00-0650rev. [DOI] [PubMed] [Google Scholar]
- 15.Arteel GE. Oxidants and antioxidants in alcohol-induced liver disease. Gastroenterology. 2003;124:778–790. doi: 10.1053/gast.2003.50087. [DOI] [PubMed] [Google Scholar]
- 16.Yin XM, Ding WX, Gao W. Autophagy in the liver. Hepatology. 2008;47:1773–1785. doi: 10.1002/hep.22146. [DOI] [PubMed] [Google Scholar]
- 17.Levine B, Kroemer G. Autophagy in the pathogenesis of disease. Cell. 2008;132:27–42. doi: 10.1016/j.cell.2007.12.018. [DOI] [PMC free article] [PubMed] [Google Scholar]
- 18.Levine B, Kroemer G. Autophagy in aging, disease and death: the true identity of a cell death impostor. Cell Death and Differentiation. 2009;16:1–2. doi: 10.1038/cdd.2008.139. [DOI] [PMC free article] [PubMed] [Google Scholar]
- 19.Yang L, Li P, Hotamisligil GS. Defective hepatic autophagy in obesity promotes ER stress and causes insulin resistance. Cell Metab. 2010;11(6):449–451. doi: 10.1016/j.cmet.2010.04.005. [DOI] [PMC free article] [PubMed] [Google Scholar]
- 20.Zechner R, Madeo F. Cell biology: Another way to get rid of fat. Nature. 2009;30; 458(7242):1118–1119. doi: 10.1038/4581118a. [DOI] [PubMed] [Google Scholar]
- 21.Kirkin V, McEwan DG, Novak I, Dikic I. A role for ubiquitin in selective autophagy. Mol Cell. 2009;34:259–269. doi: 10.1016/j.molcel.2009.04.026. [DOI] [PubMed] [Google Scholar]
- 22.Czaja MJ. Autophagy in health and disease. 2. Regulation of lipid metabolism and storage by autophagy: pathophysiological implications. Am J Physiol Cell Physiol. 2010;298:973–978. doi: 10.1152/ajpcell.00527.2009. [DOI] [PMC free article] [PubMed] [Google Scholar]
- 23.Rodriguez-Navarro JA, Cuervo AM. Autophagy and lipids: tightening the knot. Semin Immunopathol. 2010 Aug 22; doi: 10.1007/s00281-010-0219-7. published online. [DOI] [PubMed] [Google Scholar]
- 24.Yamashina S, Inami Y, Ikejima K, Watanabe S. Hepatic steatosis suppresses autophagic proteolysis. International Society for Biomedical Research on Alcoholism 2010 ISBRA World Congress; p. 255. Abstract. [Google Scholar]
- 25.Kovsan J, Bashan N, Greenberg AS, Rudich A. Potential role of autophagy in modulation of lipid metabolism. Am J Physiol Endocrinol Metab. 2010;298(1):E1–7. doi: 10.1152/ajpendo.00562.2009. [DOI] [PubMed] [Google Scholar]
- 26.Scherz-Shouval R, Elazar Z. Regulation of autophagy by ROS: physiology and pathology. Cell. 2010 Aug 20; doi: 10.1016/j.tibs.2010.07.007. published online. [DOI] [PubMed] [Google Scholar]
- 27.Chen Y, Gibson SB. Is mitochondrial generation of reactive oxygen species a trigger for autophagy? Autophagy. 2008;4:246–248. doi: 10.4161/auto.5432. [DOI] [PubMed] [Google Scholar]
- 28.Dewaele M, Maes H, Agostinis P. ROS-mediated mechanisms of autophagy stimulation and their relevance in cancer therapy. Autophagy. 2010;6(7):1–17. doi: 10.4161/auto.6.7.12113. [DOI] [PubMed] [Google Scholar]
- 29.Zhang H, Kong X, Kang J, Su J, Li Y, Zong J, Sun L. Oxidative stress induces parallel autophagy and mitochondria dysfunction in human glioma U251 cells. Toxicol Sci. 2009;110:376–388. doi: 10.1093/toxsci/kfp101. [DOI] [PubMed] [Google Scholar]
- 30.Mizushima N, Levine B, Cuervo AM, Klionsky DJ. Autophagy fights disease through cellular self-digestion. Nature. 2008;451:1069–1075. doi: 10.1038/nature06639. [DOI] [PMC free article] [PubMed] [Google Scholar]
- 31.He J, de la Monte S, Wands JR. Acute ethanol exposure inhibits insulin signaling in the liver. Hepatology. 2007;46:1791–1800. doi: 10.1002/hep.21904. [DOI] [PubMed] [Google Scholar]
- 32.Hands SL, Proud CG, Wyttenbach A. mTOR’s role in aging:protein synthesis or autophagy? Aging. 2009;(1)(7):586–597. doi: 10.18632/aging.100070. [DOI] [PMC free article] [PubMed] [Google Scholar]
- 33.Gibbons GF, Islam K, Pease RJ. Mobilization of triacylglycerol stores. Biochim Biophys Acta. 2000;1483:37–57. doi: 10.1016/s1388-1981(99)00182-1. [DOI] [PubMed] [Google Scholar]
- 34.Murphy DJ. The biogenesis and functions of lipid bodies in animals, plants and microorganisms. Prog Lipid Res. 2001;40:325–438. doi: 10.1016/s0163-7827(01)00013-3. [DOI] [PubMed] [Google Scholar]


