Abstract
We studied whether contact stress estimates from knee magnetic resonance images (MRI) predict the development of incident symptomatic tibiofemoral osteoarthritis (OA) 15 months later in an at-risk cohort. This nested case-control study was conducted within a cohort of 3026 adults, age 50 to 79 years. Thirty cases with incident symptomatic tibiofemoral OA by their 15-month follow-up visit were randomly selected and matched with 30 control subjects. Symptomatic tibiofemoral OA was defined as daily knee pain/stiffness and Kellgren-Lawrence Grade ≥2 on weight bearing, fixed-flexion radiographs. Tibiofemoral geometry was segmented on baseline knee MRI, and contact stresses were estimated using discrete element analysis. Linear mixed models for repeated measures were used to examine the association between articular contact stress and case/control status. No significant inter-group differences were found for age, sex, BMI, weight, height, or limb alignment. However, the maximum articular contact stress was 0.54 ± 0.77 MPa (mean ± SD) higher in incident OA cases compared to that in control knees (p=0.0007). The interaction between case-control status and contact stress was significant above 3.2 MPa (p<0.0001). The presence of differences in estimated contact stress 15 months prior to incidence suggests a biomechanical mechanism for symptomatic tibiofemoral OA and supports the ability to identify risk by subject-specific biomechanical modeling.
Keywords: knee, osteoarthritis, biomechanics, epidemiology, risk
INTRODUCTION
In the U.S., about 9.3 million adults over age 60 have symptomatic knee osteoarthritis (OA), defined by radiographic findings and persistent pain or stiffness [1]. Community-residing older adults are at especially high risk for disability[2, 3]. Pain is associated with disability due to functional limitations in mobility and self-care activities [2, 4]. Research aimed at predicting symptomatic knee OA is important to clinical care and public health, because pain impacts participation in activities and prompts clinical presentation.
Risk factors for knee OA include those that increase vulnerability (e.g., increased knee height or malalignment) and those that reduce recovery from excessive loading (e.g. excessive body mass index) [5]. However, not everyone with these factors develops symptoms, and no effective means of predicting which patients with these factors will develop incident disease currently exists. The ability to predict who will develop symptomatic knee OA would guide prognostication and possibly both prevention and therapy to reduce the incidence of symptomatic knee OA.
Local mechanical stress at the articular surface leads to increased nitric oxide production and chondrocyte apoptosis [6–9]. This suggests that mechanical stress may be key in OA pathogenesis. Epidemiological factors for knee OA, such as obesity, increased knee height, and mechanical axis malalignment, are indirect global predictors of cartilage stress. They enable risk prediction on a population basis, but can not account for local site-specific mechanical factors at work in OA pathogenesis. Unfortunately, global mechanical indicators have been the only risk factors that have been feasible to measure on a population-wide basis.
Incorporation of a biomechanical model of articular contact stress would enhance the ability of an epidemiological model to predict incident symptomatic tibiofemoral OA by enabling quantification of local cartilage stress with potential direct relevance to pathogenesis. Computational models have been used to determine contact stress, with most studies relying upon finite element analysis (FEA) techniques [10,11]. Unfortunately, FEA is poorly suited for population-wide studies, because of the inherent complexities in contact between deformable 3D bodies. Discrete element analysis (DEA) is an expeditious and practical alternative for estimating quasi-static contact stress based upon bony articular geometries, acquired from a clinical MRI scan [11]. In DEA, bones are treated as rigid bodies and cartilage as an array of compressive-only springs distributed over the articulating bone surfaces. Spring stiffness is determined by the cartilage elastic material response at a physiologically reasonable loading rate. This computationally efficient method can be used for patient-specific modeling on large cohorts, enabling a population-based biomechanical study of contact stress.
Examination of contact stress based on baseline MRI would elucidate whether a stress threshold exists that predicts who will develop symptomatic OA. Identification of a threshold may explain a mechanism of effect for biomechanical risk factors, explaining why some patients develop symptomatic OA while others do not. For example, malalignment and other factors are assumed to increase risk through a biomechanical mechanism. If increased contact stress mediated the relationship between such risk factors and OA, then stress estimates could be used to assess whether interventions would reduce risk for knee OA. This advanced understanding may also enhance the design of targeted therapies.
We examined the efficacy of subject-specific knee contact stress modeling to test whether contact stress estimates from baseline MRI can predict the development of incident symptomatic knee OA by 15-month follow-up in a nested case-control study within the Multicenter Osteoarthritis (MOST) Study.
METHODS
Environment and Design
The MOST Study used a population-based sampling frame to recruit 3026 community-dwelling adults, age 50 to 79 yrs, with frequent knee symptoms or at risk for developing symptomatic knee OA based on a history of injury or surgery or being overweight or obese. Exclusion criteria included bilateral knee replacement, cancer, or rheumatologic disease. At baseline and 15-month follow-up, all subjects had weight-bearing, bilateral, fixed-flexion knee radiographs and were surveyed for knee symptoms.
30 case knees were randomly selected from among MOST subjects at one clinical site who developed incident symptomatic tibiofemoral OA by their 15-month follow-up visits. The selection was performed by the MOST coordinating center epidemiologist. These cases were matched with 30 control subjects, randomly selected from the same cohort, followed over the same time at the same site, who did not develop frequent knee symptoms and radiographic tibiofemoral OA. Only 1 knee was selected from each subject to avoid covariance between knees within subjects. The bony geometry of each knee was obtained from the baseline visit MRI.
Assessment of OA
The radiographs were obtained at baseline according to the MOST protocol [12]. Two readers used the OARSI Atlas to grade baseline and follow-up radiographs [13]. The presence of frequent knee symptoms was assessed by phone screen and clinic visit at baseline and follow-up examinations to optimize precision of the assessment of OA.
Knees met criteria for incident symptomatic tibiofemoral OA if at the 15–month follow-up visit they had: knee symptoms on both the screen and clinic visit; Kellgren-Lawrence Grade ≥2 on 15–mo. radiographs; and not had the combination of symptoms and radiographic signs at baseline. Incident symptomatic knees met one of two profiles. First, a knee with no frequent knee symptoms in the past 30 days during both the baseline phone screen and the clinic visit, and at the 15-mo. visit had new frequent knee symptoms in the past 30 days at both the 15-mo. phone screen and the clinic visit, was defined as having incident symptoms. For knees with incident symptoms, if the 15-mo. radiograph showed OA (KL grade ≥2), the knee was defined as having 15-mo. incident symptomatic knee OA. Second, a knee with a report of frequent symptoms in the past 30 days during both the phone screen and the clinic visit but no radiographic tibiofemoral OA at baseline that had frequent knee symptoms in the past 30 days at both the phone screen and clinic visit and new radiographic OA at 15-mos. (KL grade ≥2) was defined as having 15-mo. incident symptomatic tibiofemoral OA. Control subjects without incident symptomatic tibiofemoral OA were defined by both the absence of radiographic tibiofemoral OA (KL<2) and the absence of frequent knee pain or stiffness for both knees on baseline and 15-mo. follow-up assessments. Written, informed consent was obtained from all participants using a consent process approved by the Institutional Review Board prior to initiating study procedures.
At baseline, height and weight were measured, and BMI (kg/m2) was calculated as reported previously [14]. Two height measurements without shoes, with standard breathing technique, were initially taken. If measurements differed by ≥ 3 mm, then 2 additional measurements were completed. All measurements were recorded and averaged.
Image Acquisition
Standardized 1.0 T knee MRI scans were obtained using a dedicated limb scanner at baseline and 15-mo. follow-up. A coronal short T1 inversion recovery (STIR) pulse sequence was used, following a protocol described previously.[15] The sequence provided sufficient contrast to delineate subchondral bone from cartilage, while minimizing motion artifact.
Image processing, segmentation, and 3D model generation
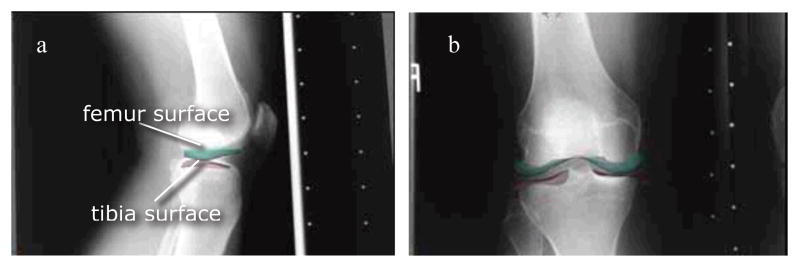
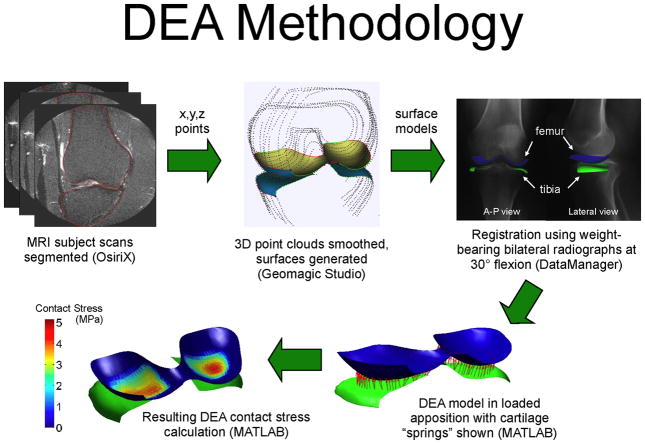
The MR images for each subject were manually segmented slice-by-slice using the OsiriX DICOM Viewer (The OsiriX Foundation, Geneva, Switzerland). Point clouds for the tibia and femur were generated, and triangulated surfaces were fit to the clouds using Geomagic Studio software (Geomagic, Inc, Research Triangle Park, NC). These models were registered into a loaded apposition, thereby incorporating patient-specific alignments, within the LHP Builder 3D visualization environment (Biocomputing Competence Center, Italy). Using an approach similar to that of Moro-oka et al. [16], bilateral radiographs were placed orthogonally in a virtual environment, and the bone surfaces were manually registered, such that the femoral and tibial outlines matched their radiographs (Fig. 1). Repeated manual alignments showed that ensuing contact stress estimates were reproducible (±5% change in computed maximum stress).
Figure 1.
Surface registration of tibial and femoral surfaces using a) lateral and b) AP weight-bearing radiographs. The resulting configuration engendered a vertical loading equivalent to 0.3 × body weight, averaged over all knees.
Computational stress analysis
DEA was used because it provided an expedited computational stress analysis tool that could efficiently be applied to all 60 subjects. Compared to FEA, which enables computation of the full local tensorial stress field, DEA reduces the stress analysis problem to a calculation of local contact stress magnitude. In the present implementation [17], a large number of springs (n = 3500), representing articular cartilage, were uniformly arrayed across the triangulated facets of the joint surface in the unloaded configuration. The apposed femur and tibia were considered rigid bodies, and a quasi-static displacement-driven solution was obtained to provide contact stresses engendered in moving the tibia and femur from their unloaded configuration into the registered loaded apposition.
The DEA formulation was implemented in MATLAB (The Mathworks, Natick, MA). Local contact stresses were computed based on total cartilage thickness, the cartilage elastic modulus and Poisson’s ratio (chosen to represent cartilage behavior at physiologically relevant loading rates), and the calculated spring deformations associated with the applied bone displacements. The modulus was 12 MPa and Poisson’s ratio 0.45 [18,19]. Owing to the low resolution scans, precise measurement of cartilage thickness was not feasible. Therefore, uniform combined tibiofemoral thickness of 6 mm was assumed. Sensitivity to this variable was minimal; trials with thicknesses of 4 and 8 mm showed <10% change in maximum contact stress. The entire process from model generation to DEA implementation is summarized in Figure 2.
Figure 2.
Summary of DEA methods utilized in the study.
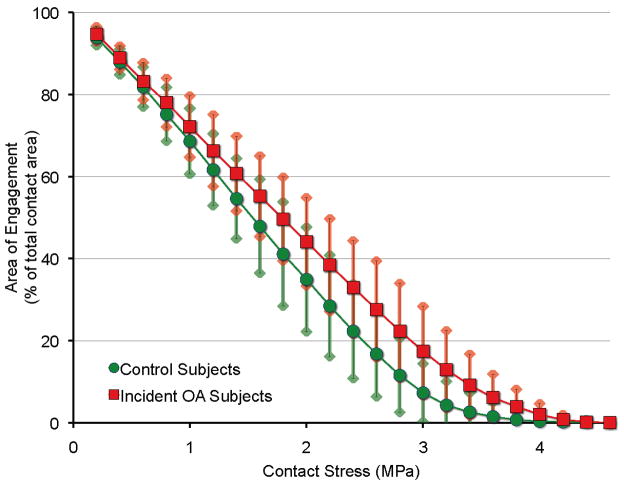
Contact stress distributions were plotted as color-coded contours upon the distal femoral surface. Values of maximum stress and of contact area (sum of all the areas for which nonzero contact stresses were computed) were compared between each OA case and its matched control. Contact areas (normalized to total contact area) were stratified according to their computed levels of contact stress exposure, to produce area engagement histograms. These histograms reflect how uniformly, and over what stress range, the contact load was distributed across the surface.
Statistical Analysis
Using a two-sided t-test with α = .05, our study had 80% power to detect as different from the null (50% AUC) an area under the curve (AUC) = 0.71, with 30 case and 30 control subjects (NQuery Advisor v.7.0, Statistical Solns, Saugus, MA), i.e., a 0.71 probability of discriminating between subjects with and without incident OA based on contact stress.
For the association between maximum articular contact stress (predictor), and incident symptomatic knee OA (outcome), the knee was treated as the unit of analysis. Univariate frequencies and means were generated to summarize anthropometric and demographic subject characteristics, which were compared with paired t-tests along with maximum contact stress. Chi-square test was used to determine whether sex distribution differed between groups. Linear mixed model analysis for repeated measures was used to examine the association of the logit transformation of the cumulative area of engagement with case/control status. The fixed effects were case/control status, contact stress, and their interaction. A significant contact stress-case/control status interaction would indicate that the difference in percent area of engagement varied with contact stress.
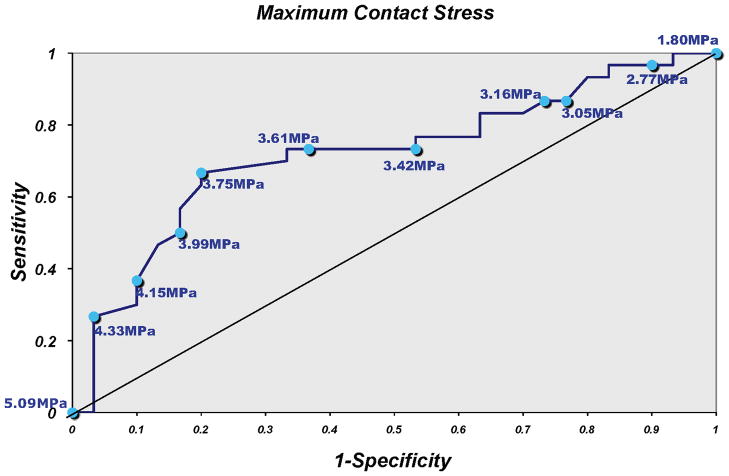
A test of mean contrast was performed to compare the cumulative area of engagement between case and control subjects at each level of contact stress. A final model was fit to assess whether additional anthropometric factors (BMI, knee height, subject height and maximum contact stress) were predictive of case status. A receiver operator characteristic (ROC) curve was used to plot sensitivity vs. 1- specificity for each level of maximum contact stress. SAS Version 9.1 (SAS Institute Inc., Cary, NC) was used for all statistical analyses. The overall alpha was set at .05.
RESULTS
Baseline Characteristics of Subjects
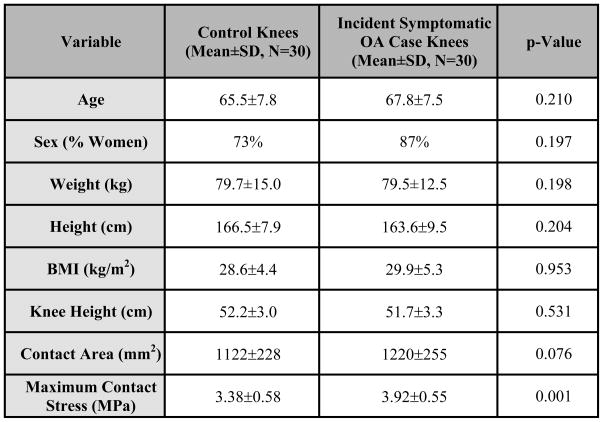
No significant differences were noted between the case and control groups with respect to age, sex, BMI, weight, height, or knee height (Fig. 3). As the outcome was a combination of daily symptoms and radiographic OA, by definition, no subjects started with this combination. At baseline, the number of control and case knees with KL 0, 1, 2, 3, and 4 were 11, 15, 2, 1, and 1 and 2, 5, 7, 14, and 2, respectively.
Figure 3.
The maximum contact stress was 0.54± 0.77 MPa higher in case than in control knees (p=.0007), with a nearly equal number of knees in each group experiencing the maximum contact stress in the medial versus the lateral compartment (M/L proportion = 53.3% and 53.6% for the control and case knees, respectively).
Contact Stress Levels
No significant difference was found in total contact area comparing case (1238 ± 276 mm2) and control (1122 ± 228 mm2) knees (p=.075). However, maximum contact stress was 0.54 ± 0.77 MPa higher in case than in control knees (p=.0007). Area of engagement plots showed that case subjects’ knees had a larger percentage of the joint surface bearing higher stresses than those of the control subjects.
Figure 4 compares the areas of engagement experiencing contact stress in excess of plotted values, demonstrating a significant difference by case-control status (p<.0001). The interaction between contact stress and case-control status was also significant (p<.0001). The level of contact stress above which there was a significant difference in percent area of engagement was 3.0 MPa (p=.0160), indicating that case subjects with OA had more area in contact at stress levels higher than for control subjects who did not develop the combination of knee symptoms and OA. This interaction demonstrated an association between higher contact stress and the development of OA. In a model that also included BMI, knee height, and subject height, only maximum contact stress was a significant predictor of OA (p=.0004).
Figure 4.
Cumulative area of engagement at each level of contact stress. In addition to absolute disparities evident in the mid to high contact stress range (2.5 to 3.0 MPa), a very pronounced relative increase in the amount of very highly stressed (>3 MPa) cartilage occurred in knees that later developed incident symptomatic tibiofemoral OA. Plotted are mean ± 1 standard deviation values within each group.
Contact Stress Threshold Predictive of Incident Symptomatic Knee OA
Analysis of the area under the ROC curve to determine a contact stress threshold that optimized both sensitivity and specificity of risk prediction for OA, showed that a threshold of 3.42 to 3.61 MPa had a 73.3% sensitivity, with specificity from 46.7% to 66.7% (Fig. 5).
Figure 5.
Sensitivity and specificity of maximum contact stress for predicting case status.
DISCUSSION
To our knowledge, no large-series data exist demonstrating the value of subject-specific contact stress as a predictor of incident symptomatic knee OA. This study is novel in that it identified a correlation between maximum contact stress and risk for development of OA. The capabilities of DEA were key to establishing this correlation, enabling the study of a larger series of subjects than would be practicable by full tensorial stress analysis using FEA or boundary element analysis.
The threshold of deleterious contact stress identified is specific to the population of subjects studied. The range of 3.42 to 3.61 MPa maximized the sensitivity for identifying case status. However, one might argue that since incident symptomatic tibiofemoral OA is uncommon over 15 months that it would be more important to maximize specificity to minimize the rate of false positives. In such a case, a higher contact stress level could be selected to increase specificity. Although this specific threshold and the positive predictive value would presumably differ in other populations, the sensitivity and specificity curve (Fig. 5) should be representative, enabling future studies to identify thresholds in different populations and durations of follow-up.
Our findings suggest that development of the combination of pain or stiffness on most days of the month and radiographic tibiofemoral OA is strongly influenced by contact geometry and loading, factors that may alter cartilage microstructure and vitality. The combination of altered anatomy and malalignment most likely accounted for the higher contact stress in the case knees.
Numerous attempts have been made to identify methods for predicting incident and progressive knee OA [20–22], though reliable predictors have remained elusive [22]. We identified significant differences in maximum contact stress magnitude and distribution, comparing incident symptomatic tibiofemoral OA case and control knees. Contact stress was a stronger predictor of OA by 15 months than were demographic or anthropometric measures, indicating that contact stress may be a more specific predictor of articular changes associated with pain than are traditional anthropometric measures such as knee height or BMI. The biomechanical implications of these established epidemiological risk factors have been established in subjects with radiographic tibiofemoral OA [23], their influence on knee pain appears less definitive.
FE formulations for subject-specific joint modeling have been described, but they are computationally intensive, and therefore have not been useful in large population-based studies [24]. The capabilities and limitations of FEA versus DEA were explored [25]. Earlier applications of DEA included modeling joint stability [26], analyzing effects of habitual stresses on knee cartilage [27], defining force and pressure distributions in the knee [28], and assessing wear and performance of implants and materials used in total knee replacements and residual limbs [25,29–31]. For such purposes, DEA is a reasonable method for assessing joint contact stresses, yielding values within 4% of those measured experimentally in a cadaveric ankle validation study [17].
Our subject-specific application of DEA to identify risk for incident symptomatic knee OA was a reliable and feasible approach to explain why some subjects develop symptomatic tibiofemoral OA and others do not. We identified risk for incident symptomatic tibiofemoral OA based upon biomechanical models from MRI sequences acquired 15 months prior to the outcome assessment. The methods have the potential to enable large-scale subject-specific determination of risk for symptomatic tibiofemoral OA. Plain knee radiographs in loaded apposition at 30° flexion (comparable to the mid-stance of gait) were used to derive the displacements applied to the model. This approach implicitly assumes that knees with elevated stresses at 30° flexion have proportionally elevated stresses at the other (less heavily-loaded) phases of gait.
There were several limitations in this initial study. First, although prediction of symptomatic knee OA was a clinically meaningful outcome, many knees that developed OA at 15 months had radiographic tibiofemoral OA at baseline. Therefore, for some subjects this study described the transition from radiographic OA to painful or stiff OA. Knee symptoms do not necessarily correlate with joint space or other radiographically derived parameters [32,33], and we may not be describing factors affecting structural worsening. However, we believe that factors that influence the development of daily knee symptoms may be as or more important.
Symptoms, not radiographic features, reduce quality of life, leading to clinical presentation and societal costs [34]. Thus, we conducted this study to predict symptomatic tibiofemoral OA, an outcome with public health significance, rather than trying to predict a strictly anatomic outcome. Although drawn from the same cohort observed over the same time, many case knees developed the combination of frequent knee symptoms and radiographic tibiofemoral OA over a 15 month period, but had radiographic OA features at baseline, whereas many control knees that did not develop this combination did not have radiographic features at baseline. However, no significant relationship was found between baseline KL grade and maximum contact stress, demonstrating that contact stress is a predictor of symptom development independent of radiographic severity.
The case group did not have worse symptomatic status than the control group at baseline, which is what matters clinically [34]. Radiographic changes may presage symptomatic OA, such that case knees may have been closer to developing symptomatic OA over the relatively short 15 month time. However, we believe that the same adverse biomechanical environment responsible for the worse radiographic status of the cases at baseline–elevated contact stress – was responsible for the case knees developing incident symptoms. Therefore, the fact many case knees happened to have worse baseline radiographic status than control knees is expected, as a surrogate marker of the case versus control difference, whereas the elevated contact stress was in the causal pathway for the difference between these groups.
Another limitation was that the lack of incorporation of the meniscus may have influenced estimates of contact stress [35]. Further model development may benefit from considering the menisci and variations in cartilage thickness. Other considerations include the registration and validation methods. Fixed-flexion lateral radiographs were used to register the loaded alignment of the bony surfaces segmented on MRI scans. Another approach would be to acquire MRI with the knee loaded in flexion, thereby allowing the bony alignment to be registered between the reconstructed images from the extended and flexed position MRI scans [28].
In summary, use of the DEA method, based on a commonly acquired knee MRI scan, requires no radiation and appears to hold promise as a means of subject-specific prediction of incident symptomatic knee OA. Using this method, we documented that contact stresses constitute a risk factor for the development of incident symptomatic tibiofemoral OA.
Acknowledgments
This study was supported by the University of Iowa Biological Sciences Funding Program and NIH grants AG18832, AR55533, AG18820, AG18947, AG19069, and K12HD001097-08.
Footnotes
The authors have no conflict of interest with respect to any aspect of this study.
References
- 1.Lawrence RC, Felson DT, Helmick CG, Arnold LM, Choi H, Deyo RA, et al. Estimates of the prevalence of arthritis and other rheumatic conditions in the United States. Part II. Arthritis and rheumatism. 2008;58:26–35. doi: 10.1002/art.23176. [DOI] [PMC free article] [PubMed] [Google Scholar]
- 2.Fried LP, Guralnik JM. Disability in older adults: evidence regarding significance, etiology, and risk. J Am Geriatr Soc. 1997;45:92–100. doi: 10.1111/j.1532-5415.1997.tb00986.x. [DOI] [PubMed] [Google Scholar]
- 3.Guralnik JM, Ferrucci L, Simonsick EM, Salive ME, Wallace RB. Lower-extremity function in persons over the age of 70 years as a predictor of subsequent disability. N Engl J Med. 1995;332:556–561. doi: 10.1056/NEJM199503023320902. [DOI] [PMC free article] [PubMed] [Google Scholar]
- 4.Hochberg MC, Kasper J, Williamson J, Skinner A, Fried LP. The contribution of osteoarthritis to disability: preliminary data from the Women’s Health and Aging Study. J Rheumatol Suppl. 1995;43:16–18. [PubMed] [Google Scholar]
- 5.Felson DT. Risk factors for osteoarthritis: understanding joint vulnerability. Clinical Orthopaedics & Related Research. 2004:S16–21. doi: 10.1097/01.blo.0000144971.12731.a2. [DOI] [PubMed] [Google Scholar]
- 6.Fermor B, Jeffcoat D, Hennerbichler A, Pisetsky DS, Weinberg JB, Guilak F. The effects of cyclic mechanical strain and tumor necrosis factor alpha on the response of cells of the meniscus. Osteoarthritis & Cartilage. 2004;12:956–962. doi: 10.1016/j.joca.2004.08.007. [DOI] [PubMed] [Google Scholar]
- 7.Martin JA, Brown TD, Heiner AD, Buckwalter JA. Chondrocyte senescence, joint loading and osteoarthritis. Clinical Orthopaedics & Related Research. 2004:S96–103. doi: 10.1097/01.blo.0000143818.74887.b1. [DOI] [PubMed] [Google Scholar]
- 8.Fink C, Fermor B, Weinberg JB, Pisetsky DS, Misukonis MA, Guilak F. The effect of dynamic mechanical compression on nitric oxide production in the meniscus. Osteoarthritis & Cartilage. 2001;9:481–487. doi: 10.1053/joca.2001.0415. [DOI] [PubMed] [Google Scholar]
- 9.D’Lima DD, Hashimoto S, Chen PC, Colwell CW, Jr, Lotz MK. Impact of mechanical trauma on matrix and cells. Clinical Orthopaedics & Related Research. 2001:S90–99. doi: 10.1097/00003086-200110001-00009. [DOI] [PubMed] [Google Scholar]
- 10.Beillas P, Papaioannou G, Tashman S, Yang KH. A new method to investigate in vivo knee behavior using a finite element model of the lower limb. Journal of biomechanics. 2004;37:1019–1030. doi: 10.1016/j.jbiomech.2003.11.022. [DOI] [PubMed] [Google Scholar]
- 11.Li G, Sakamoto M, Chao EY. A comparison of different methods in predicting static pressure distribution in articulating joints. J Biomech. 1997;30:635–638. doi: 10.1016/s0021-9290(97)00009-2. [DOI] [PubMed] [Google Scholar]
- 12.Kothari M, Guermazi A, von Ingersleben G, Miaux Y, Sieffert M, Block JE, et al. Fixed-flexion radiography of the knee provides reproducible joint space width measurements in osteoarthritis. Eur Radiol. 2004;14:1568–1573. doi: 10.1007/s00330-004-2312-6. [DOI] [PubMed] [Google Scholar]
- 13.Altman RD, Hochberg M, Murphy WA, Jr, Wolfe F, Lequesne M. Atlas of individual radiographic features in osteoarthritis. Osteoarthritis Cartilage. 1995;3 (Suppl A):3–70. [PubMed] [Google Scholar]
- 14.Segal NA, Felson DT, Torner JC, Zhu Y, Curtis JR, Niu J, et al. Greater trochanteric pain syndrome: epidemiology and associated factors. Archives of Physical Medicine and Rehabilitation. 2007;88:988–992. doi: 10.1016/j.apmr.2007.04.014. [DOI] [PMC free article] [PubMed] [Google Scholar]
- 15.Roemer FW, Guermazi A, Lynch JA, Peterfy CG, Nevitt MC, Webb N, et al. Short tau inversion recovery and proton density-weighted fat suppressed sequences for the evaluation of osteoarthritis of the knee with a 1.0 T dedicated extremity MRI: development of a time-efficient sequence protocol. Eur Radiol. 2005;15:978–987. doi: 10.1007/s00330-004-2608-6. [DOI] [PubMed] [Google Scholar]
- 16.Moro-oka TA, Hamai S, Miura H, Shimoto T, Higaki H, Fregly BJ, et al. Can magnetic resonance imaging-derived bone models be used for accurate motion measurement with single-plane three-dimensional shape registration? Journal of orthopaedic research. 2007;25:867–872. doi: 10.1002/jor.20355. [DOI] [PubMed] [Google Scholar]
- 17.Anderson D, Iyer K, Segal N, Lynch J, Brown T, Anderson DKI, Segal N, Lynch J, Brown T. Implementation of discrete element analysis for subject-specific, population-wide investigations of habitual contact stress exposure. J Appl Biomech. 2009 doi: 10.1123/jab.26.2.215. [DOI] [PMC free article] [PubMed] [Google Scholar]
- 18.Barker MK, Seedhom BB. The relationship of the compressive modulus of articular cartilage with its deformation response to cyclic loading: does cartilage optimize its modulus so as to minimize the strains arising in it due to the prevalent loading regime? Rheumatology (Oxford) 2001;40:274–284. doi: 10.1093/rheumatology/40.3.274. [DOI] [PubMed] [Google Scholar]
- 19.Jin H, Lewis JL. Determination of Poisson’s ratio of articular cartilage by indentation using different-sized indenters. J Biomech Eng. 2004;126:138–145. doi: 10.1115/1.1688772. [DOI] [PubMed] [Google Scholar]
- 20.Brouwer GM, van Tol AW, Bergink AP, Belo JN, Bernsen RM, Reijman M, et al. Association between valgus and varus alignment and the development and progression of radiographic osteoarthritis of the knee. Arthritis and rheumatism. 2007;56:1204–1211. doi: 10.1002/art.22515. [DOI] [PubMed] [Google Scholar]
- 21.Hunter DJ, Lavalley M, Li J, Zhang Y, Bauer D, Nevitt M, et al. Urinary pentosidine does not predict cartilage loss among subjects with symptomatic knee OA: the BOKS Study. Osteoarthritis and cartilage/OARS, Osteoarthritis Research Society. 2007;15:93–97. doi: 10.1016/j.joca.2006.06.011. [DOI] [PubMed] [Google Scholar]
- 22.Hunter DJ, Niu J, Felson DT, Harvey WF, Gross KD, McCree P, et al. Knee alignment does not predict incident osteoarthritis: the Framingham osteoarthritis study. Arthritis and rheumatism. 2007;56:1212–1218. doi: 10.1002/art.22508. [DOI] [PubMed] [Google Scholar]
- 23.Baliunas AJ, Hurwitz DE, Ryals AB, Karrar A, Case JP, Block JA, et al. Increased knee joint loads during walking are present in subjects with knee osteoarthritis. Osteoarthritis and cartilage/OARS, Osteoarthritis Research Society. 2002;10:573–579. doi: 10.1053/joca.2002.0797. [DOI] [PubMed] [Google Scholar]
- 24.Elias JJ, Wilson DR, Adamson R, Cosgarea AJ. Evaluation of a computational model used to predict the patellofemoral contact pressure distribution. Journal of biomechanics. 2004;37:295–302. doi: 10.1016/s0021-9290(03)00306-3. [DOI] [PubMed] [Google Scholar]
- 25.Beillas P, Lee SW, Tashman S, Yang KH. Sensitivity of the tibio-femoral response to finite element modeling parameters. Computer methods in biomechanics and biomedical engineering. 2007;10:209–221. doi: 10.1080/10255840701283988. [DOI] [PubMed] [Google Scholar]
- 26.Jafari A, Farahmand F, Meghdari A. The effects of trochlear groove geometry on patellofemoral joint stability--a computer model study. Proceedings of the Institution of Mechanical Engineers. 2008;222:75–88. doi: 10.1243/09544119JEIM255. [DOI] [PubMed] [Google Scholar]
- 27.Wilson W, van Donkelaar CC, van Rietbergen R, Huiskes R. The role of computational models in the search for the mechanical behavior and damage mechanisms of articular cartilage. Medical engineering & physics. 2005;27:810–826. doi: 10.1016/j.medengphy.2005.03.004. [DOI] [PubMed] [Google Scholar]
- 28.Elias JJ, Cosgarea AJ. Computational modeling: an alternative approach for investigating patellofemoral mechanics. Sports medicine and arthroscopy review. 2007;15:89–94. doi: 10.1097/JSA.0b013e31804bbe4d. [DOI] [PubMed] [Google Scholar]
- 29.Dargahi J, Najarian S, Amiri S. Optimization of the geometry of total knee implant in the sagittal plane using FEA. Bio-medical materials and engineering. 2003;13:439–449. [PubMed] [Google Scholar]
- 30.Volokh KY, Chao EY, Armand M. On foundations of discrete element analysis of contact in diarthrodial joints. Molecular & cellular biomechanics. 2007;4:67–73. [PMC free article] [PubMed] [Google Scholar]
- 31.Lin YC, Farr J, Carter K, Fregly BJ. Response surface optimization for joint contact model evaluation. Journal of applied biomechanics. 2006;22:120–130. doi: 10.1123/jab.22.2.120. [DOI] [PubMed] [Google Scholar]
- 32.Cicuttini FM, Baker J, Hart DJ, Spector TD. Association of pain with radiological changes in different compartments and views of the knee joint. Osteoarthritis and cartilage/OARS, Osteoarthritis Research Society. 1996;4:143–147. doi: 10.1016/s1063-4584(05)80323-1. [DOI] [PubMed] [Google Scholar]
- 33.Bruyere O, Honore A, Rovati LC, Giacovelli G, Henrotin YE, Seidel L, et al. Radiologic features poorly predict clinical outcomes in knee osteoarthritis. Scandinavian journal of rheumatology. 2002;31:13–16. doi: 10.1080/030097402317255309. [DOI] [PubMed] [Google Scholar]
- 34.Buckwalter JA, Saltzman C, Brown T. The impact of osteoarthritis: implications for research. Clin Orthop Relat Res. 2004:S6–15. doi: 10.1097/01.blo.0000143938.30681.9d. [DOI] [PubMed] [Google Scholar]
- 35.Pena E, Calvo B, Martinez MA, Palanca D, Doblare M. Why lateral meniscectomy is more dangerous than medial meniscectomy. A finite element study. Journal of orthopaedic research. 2006;24:1001–1010. doi: 10.1002/jor.20037. [DOI] [PubMed] [Google Scholar]


