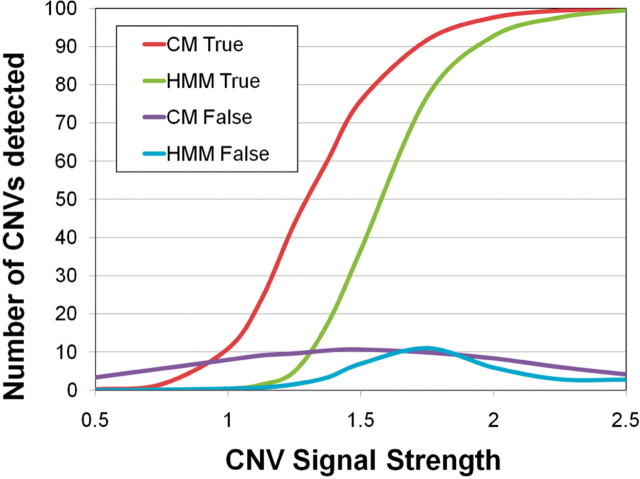
Fig. 1.
Comparison of CopyMap and classical HMM algorithms. The horizontal axis shows the difference in signal strength δ between the CNV-probes and probes with baseline copy number. I simulated a total of 100 CNVs. The vertical axis displays the number of CNVs detected using CopyMap (CM, red line) and using a classic HMM (HMM, orange line). It also shows the number of false CNVs detected (blue and grey line).

