

Abstract
A shotgun metabolomics approach using MALDI-TOF/TOF mass spectrometry was developed for the rapid analysis of negatively charged water-soluble cellular metabolites. Through the use of neutral organic solvents to inactivate endogenous enzyme activities (i.e., methanol/chloroform/H2O extraction), in conjunction with a matrix having minimal background noise (9-amnioacridine), a set of multiplexed conditions was developed that allowed identification of 285 peaks corresponding to negatively charged metabolites from mouse heart extracts. Identification of metabolite peaks was based on mass accuracy and was confirmed by tandem mass spectrometry for 90 of the identified metabolite peaks. Through multiplexing ionization conditions, new suites of metabolites could be ionized and “spectrometric isolation” of closely neighboring peaks for subsequent tandem mass spectrometric interrogation could be achieved. Moreover, assignments of ions from isomeric metabolites and quantitation of their relative abundance was achieved in many cases through tandem mass spectrometry by identification of diagnostic fragmentation ions (e.g., discrimination of ATP from dGTP). The high sensitivity of this approach facilitated the detection of extremely low abundance metabolites including important signaling metabolites such as IP3, cAMP, and cGMP. Collectively, these results identify a multiplexed MALDI-TOF/TOF MS approach for analysis of negatively charged metabolites in mammalian tissues.
Metabolomics is an emerging field that provides critical insight into the physiologic status of cells by identifying and quantifying multiple cellular metabolites. As a complement to genomics, proteomics, and transcriptomics, metabolomics has been successful in discriminating a wide variety of different metabolic phenotypes where more “conventional” assessments have failed.1,2 Through assessment of alterations in the profiles of metabolites new insights into disease processes have already been made.3–6
Among the various technologies that have traditionally been employed to identify and quantify cellular metabolites, mass spectrometry (MS) has evolved to be a very powerful tool for metabolite analysis. The high sensitivity and resolution of MS, in conjunction with its ability to elucidate the structure of unknown compounds present in complex biological samples, have provided a strong impetus to use MS in the analysis of metabolites present in extremely low abundance. GC/MS has been widely used in the analyses of volatile metabolites or metabolites that can be volatized after chemical derivatization.7–11 Electrospray ionization mass spectrometry (ESI-MS) and atmospheric pressure chemical ionization mass spectrometry (APCI-MS) can be coupled to liquid chromatography (LC) or capillary electrophoresis (CE), allowing high-throughput analyses of nonvolatile metabolites from biological samples. These techniques have been recently reviewed and represent valuable tools for metabolomics research.9–14 The use of chromatography or electrophoresis, however, extends analysis time and introduces additional procedural complexity. Quantitative analysis of the chemically diverse molecular species present in the metabolome often requires multiple different chromatographic approaches to resolve or enrich salient metabolites. Current efforts in metabolomics are thus aimed at maximizing the amount of information obtained, while minimizing time and methodological difficulty necessary for sample analysis.
MALDI-MS, which has now matured and is widely used in proteomics analysis, nucleotide sequencing, and polymer analysis,15–18 has the potential to contribute significantly to metabolomics. It offers the advantage of rapid throughput which, when combined with stable isotope standards for metabolites of interest, has the potential to deliver large amounts of quantitative information with unprecedented speed and accuracy. MALDI-TOF/TOF MS additionally permits the discrimination of isomeric molecular species that would not be possible using spectra of molecular ions alone. MALDI-MS has a higher tolerance to salts than ESI-MS and APCI-MS and has the unique ability to generate singly charged ions of <1000 Da which can avoid the overlapping of ion peaks produced by multiply charged ions routinely occurring at low m/z values in ESI-MS and APCI-MS. However, use of MALDI-MS has been restricted to the analysis of high molecular weight metabolites because conventional matrix clusters (such as CHCA and DHB) create excessive noise in the low-mass range of the spectrum and interfere with the detection of low molecular weight cellular metabolites. Until recently, this has precluded the routine use of MALDI in metabolomics. Matrixes have now been identified, however, that produce minimal spectral noise in the low molecular weight region of interest. Examples include the silicon nanoparticle,19 mesotetrakis(pentafluorophenyl)porphyrin,20 9-aminoacridine,21–24 porous silicon,25–28 and ionic liquid matrixes,29,30 all of which have been examined and their utility in specific applications confirmed. Recently, MALDI employing 9-aminoacridine matrix was successfully used to identify 29 metabolites by mass accuracy from extracts of the islets of Langerhans as well as to directly analyze single islets,23 confirming the utility of this matrix for metabolomics research. That work, however, neither addressed the utility of this matrix in tandem mass spectrometric analysis nor did it exploit multiplexed conditions to increase penetrance into the metabolome.
In the current work, we exploited the salutary properties of the 9-aminoacridine MALDI matrix to examine metabolites in murine myocardium using MALDI-TOF/TOF MS. By using TOF/TOF fragmentation of singly charged molecular ions, we greatly extended the penetrance into the metabolome, identification of isomeric metabolites, and increased data precision. This technique permitted us to identify 285 metabolites from murine myocardium based on mass accuracy and to confirm 90 metabolites by tandem MS analyses. In many cases, we were able to structurally identify and discriminate isomeric molecular species. The utility of this methodology in quantitative metabolomic analysis is demonstrated by the accurate quantification of five representative bioenergetic metabolites for which stable isotope-labeled internal standards are available. In further support of the technique’s utility, we demonstrate its ability to identify multiple extremely low abundance metabolites important for cellular signaling in multiple physiologic and pathophysiologic states. Collectively, this work identifies the utility of MALDI-TOF/TOF MS in conjunction with multiplexed ionization conditions as a tool to study the integrated analysis of the cellular metabolome in health and disease.
EXPERIMENTAL SECTION
Reagents
9-Aminoacridine, ATP, ADP, AMP, dGTP, dGDP, dGMP, sodium pyruvate-13C, succinic acid-d4, and ATP-13C10,15N5 were purchased from Sigma-Aldrich (St. Louis, MO). Sodium lactate-13C and acetyl-CoA-13C2 were from Cambridge Isotope Laboratories (Andover, MA). All solvents used in extraction and MS analysis were purchased from Burdick & Jackson (Muskegon, MI).
Methanol/Chloroform/H2O Extraction (M/C/H)
Metabolite extraction was performed according to the method of Le Belle et al. with some modifications.31 Due to the rapid change in myocardial metabolites during anesthesia with asphyxiation, adult C57BL/6 mice were sacrificed by decapitation using a protocol approved by the Washington University Animal Studies committee. The whole excised heart was freeze-clamped at the temperature of liquid nitrogen. This method of sacrificing animals as well as the rapidity of excising and freezing the hearts is crucial to maintaining metabolite levels at their in vivo concentrations. Myocardial wafers were pulverized into a fine powder using a BioPulverizer (BioSpec Products, Bartlesville, OK). Next, a frozen myocardial powder sample (~20 mg) was weighed prior to homogenization in 450 μL of ice-cooled 1:2 (v/v) chloroform/methanol for 2 min at −10 °C (ethanol–ice bath) followed by the addition of a mixture of stable isotope-labeled internal standards containing acetyl-CoA-13C2 (0.04 nmol/mg of wet weight), ATP-13C10,15N5 (4 nmol/mg of wet weight), AMP-13C10,15N5 (0.1 nmol/mg of wet weight), succinic acid-d4 (1.2 nmol/mg of wet weight), lactate-13C (10 nmol/mg of wet weight), and pyruvate-13C (3 nmol/mg of wet weight). Following the addition of chloroform and 150 μL of ice-cooled water to the homogenized tissue, another homogenization was performed for 2 min at – 10 °C. After incubation for 30 min on ice, the homogenate was centrifuged at 25000g for 15 min at 4 °C. The upper layer was saved on ice, and the chloroform layer is discarded. The residues were subjected to re-extraction twice with 300 μL of ice-cooled 1:2 (v/v) chloroform/methanol and 100 μL of ice-cooled chloroform and 100 μL of ice-cooled water following the same procedure as above. The resultant three upper layers were pooled together for MALDI-TOF/TOF MS analysis immediately or stored at −20 °C until being analyzed.
Perchloric Acid Extraction
Metabolite extraction was carried out according to the method of Williamson and Corkey with some modifications.32 In brief, 250 μL of ice-cooled 3.5% perchloric acid (PCA)–20% ethanol–8 mM EDTA and an internal standard mixture containing acetyl-CoA-13C2 (0.04 nmol/mg of wet weight), ATP-13C10,15N5 (4 nmol/mg of wet weight), succinic acid-d4 (1.2 nmol/mg of wet weight), lactate-13C (10 nmol/mg of wet weight), and pyruvate-13C (3 nmol/mg of wet weight) were added to 20 mg of frozen heart tissue and the resultant mixture was then homogenized at −10 °C for 2 min. After incubation for 30 min on ice, the homogenates were centrifuged at 25000g for 10 min at 4 °C. The resultant supernatant was saved on ice. The residues were subjected to re-extraction with 3.5% PCA–8 mM EDTA following the same procedure as above. The resultant two supernatants were pooled together and adjusted to pH 4.5 with 3 M KHCO3 to precipitate KClO4. After centrifugation for 10 min at 4 °C, the resultant supernatant was saved on ice for MALDI-TOF/TOF MS analysis.
MALDI-TOF/TOF Mass Spectrometric Analysis
Three 100-μL aliquots of the murine heart extract were dried under a nitrogen stream and reconstituted in 100 μL of 0.05% TFA, water, and 2% ammonium hydroxide, respectively. After mixing 10 μL of reconstituted sample with 10 μL of 9-aminoacridine that was dissolved in 0.1% TFA–acetone, acetone, or 2% ammonium hydroxide–acetone (10 mg/mL), 1 μL of the mixture is spotted on an Opti-TOF 384-well plate. MS analysis was performed on a 4800 MALDI-TOF/TOF analyzer. Prior to MS analysis, calibration in the reflectron mode was performed using a mixture of standard metabolites containing malate, AMP, ATP, and acetyl-CoA, and the resultant parameters were saved as the default calibration. Mass spectra were acquired in the negative ion mode. For quantitation of metabolites with molecular masses of >130 Da, the mass spectrum was recorded in the MS reflectron mode. For quantitation of metabolites with molecular masses of <130 Da, mass spectra were obtained in the linear mode and were calibrated using mixtures of lactate and succinate. Mass spectra for metabolite analyses were obtained by averaging 1500 consecutive laser shots (50 shots per subspectra and 30 subspectra) with default calibration. MS2 analysis of metabolites was accomplished by turning on collision-induced dissociation (CID) gas and metastable suppression in the negative ion mode. Air was used for CID at a medium pressure. Ion peaks with S/N of >10 were considered to be potential deprotonated metabolite signals except for peak clusters that derive from the matrix or chloride adducts, which were distinguished by pairs with a mass difference of 2 Da possessing an intensity ratio of 3:1.
Data Analysis
Monoisotopic peak area was determined using software provided by the manufacturer (version 4.5 software; Applied Biosystems). When 13C1- or 13C2-labeled metabolites were used as the internal standards, the internal standard monoisotopic peak area was corrected by subtracting the contribution of the isotopic peak from its corresponding metabolite. The ratio of the metabolite monoisotopic peak area to its corrected internal standard peak area was calculated using Microsoft Excel. To facilitate metabolite database searching, we constructed a metabolite database based on exact mass data released at website http://dbk.ch.umist.ac.uk/ExactMasses.htm. An Excel-based program was used to search this database. METLIN (http://metlin.scripps.edu),33 KEGG,34 and the Human Metabolome Database MS search (http://www.hmdb.ca/labm/jsp/mlims/MSDbParent.jsp),35 were also employed to confirm and extend search results.
The identification of extracted metabolites was accomplished through an iterative procedure that involved identification of the [M – H]– ion from the data base with a mass error of <0.01 Da followed by confirmation of the assignments of medium- and high-abundance ion peaks by tandem MS analyses. Next, the spectra were recalibrated using the identified metabolites as internal standards of known mass for peak assignment and added isotopic labeled compounds as internal standards for quantitation. Additional assignments for extremely low abundance peaks were made and confirmed by tandem MS analysis. Next, the pH of the matrix was varied, changing the metabolites that ionized effectively and permitting multiplexed sample analysis. For some low-abundance extremely low molecular weight metabolites, which possessed irregular peak shapes whose peak intensities or shapes could not be improved by varying pH, and for which tandem MS analyses failed, we assigned identities by lowering mass accuracy to ± 0.1 Da and verifying their identity as peaks with S/N > 10 visually.
RESULTS AND DISCUSSION
Detection of Metabolites
To develop a shotgun metabolomics method suitable for the rapid analysis of metabolites in mammalian tissues by MALDI-TOF/TOF MS, the initial goal was to identify a method for tissue metabolite extraction that would be compatible with MALDI-TOF/TOF MS analyses. In pursuit of this, two conventional extraction methods were compared. First, perchloric acid extracts of murine myocardium were mixed with a 9-aminoacridine matrix and examined by MALDI-TOF/TOF MS (Figure 1A). Search of the metabolomic database did not reveal any peaks corresponding to known metabolite masses. This result indicates that the majority of peaks identified by this extraction method likely result from anion and matrix adducts and that target metabolite ionization was suppressed by the abundance of anions present in the extract. Although perchloric acid extraction is a method widely used to isolate water-soluble metabolites from tissue, and the resultant metabolites have been successfully analyzed by enzymatic fluorescence assays, NMR, LC, GC, and CE–MS (reviewed in refs 12 and 36–38), in our hands, this procedure completely suppressed the formation of informative ions of cellular metabolites using MALDI ionization (Figure 1A).
Figure 1.

Mass spectra of the water-soluble metabolites extracted from mouse heart tissue. Mass spectra were obtained by analyzing the extract of 20 mg of C57BL/6 male mouse heart tissue on a 4800 MALDI-TOF/TOF analyzer in the negative ion mode using 9-aminoacridine as matrix. (A) Metabolites were extracted using a perchloric acid extraction method as described in the Experimental Section, and the mass spectrum was recorded under neutral condition (sample pH is 7.0 and matrix solvent is acetone); and (B) metabolites were extracted using M/C/H extraction method as described in the Experimental Section, and the mass spectrum was recorded under weak acidic condition (sample pH is 3.0 and matrix solvent is acetone); (C) a magnification of the mass spectrum of metabolites extracted using the M/C/H extraction method, and the mass spectrum was recorded under weak acidic condition, showing the detection of cAMP; (D) a magnification of mass spectrum of metabolites extracted using the M/C/H extraction method and mass spectrum was recorded under weak acidic condition, showing the detection of NADH. Individual mass spectrum of metabolites was obtained by averaging 1500 consecutive laser shots (50 shots per subspectra and 30 subspectra). The cluster around m/z 193.05 represents matrix peaks in both (A) and (B).
In sharp contrast, MALDI-TOF/TOF mass spectra of M/C/H extracts of murine myocardium demonstrated an entirely different set of peaks, which after database searching identified 285 peaks corresponding to murine myocardial metabolites. The M/C/H extraction method resulted in the relatively straightforward detection of multiple cellular metabolites (Figure 1B). It exploits the ability of methanol to denature enzymes leading to their presence at the chloroform/water interface and the removal of lipids in the chloroform phase where they cannot suppress endogenous metabolite ionization. The cellular lipidome can be simultaneously analyzed through this extraction method using methods we have described in detail previously.39,40 Thus, a single extraction protocol permits assessment of both 285 water-soluble metabolites and over 1000 lipid molecular species (by shotgun lipidomics) directly from extracts of biologic tissues or fluids. Le Belle et al. compared perchloric acid extraction to M/C/H extraction for NMR using brain tissue. In those studies, M/C/H extraction was far more efficient and less variable than perchloric acid extraction as assessed by NMR spectroscopy.31 More importantly, M/C/H extraction does not destroy acid-labile metabolites such as NADH and thus permits assessment of acid-labile metabolites. As shown in Figure 1D, NADH was extracted from murine myocardium by M/C/H extraction and was readily detected by MALDI-TOF/TOF MS. Due to the clear advantages of the M/C/H extraction method for use in MALDI-TOF/TOF MS, this method was employed in all subsequent experiments.
Both low molecular weight and low abundance metabolites were easily detected using MALDI-TOF/TOF MS with 9-aminoacridine as matrix in the negative ion mode. For example, the ubiquitous second messenger cAMP (m/z 328.04) was easily detected (Figure 1C) and could be readily discriminated from other isomeric species by TOF/TOF (see Metabolomic Analysis of Mouse Tissue Extract below). In control experiments using MALDI-TOF/TOF MS analysis with 9-aminoacridine, in the absence of tissue extract no substantial peaks were detected, with the exception of an ion cluster at m/z 193–195. Collectively, these results demonstrate that MALDI-TOF MS using 9-aminoacridine is a suitable method for direct and deep penetrance into the low-abundance range of negatively charged metabolites by MALDI-TOF/TOF MS.
pH-Dependent Ionization of Metabolites in Mouse Heart Extracts
Ionization of metabolites using MALDI largely relies on the ability of the metabolite to gain or lose a proton, which in turn is a function of the metabolite’s chemical structure, its stereochemical interaction with the matrix, and the effective proton concentration of the matrix. Accordingly, metabolites with different structures show remarkable variability in their ionization efficiencies as a function of pH. To explore the possibility that altering pH might result in enhanced ionization of a new suite of metabolites, we examined MALDI-TOF MS spectra of tissue samples acquired by altering both matrix and sample pH values.
As shown in Figure 2, three different mass profiles were obtained when sample pH was varied from 3.0, to 7.0 to 10.0 and mass spectra were recorded using 0.1% TFA–acetone, acetone, and 2% ammonium hydroxide–acetone solution as matrix solvent, respectively. Figure 2 demonstrates that, as predicted, some metabolites can be ionized only under certain pH conditions. For example, the metabolites at m/z 249.03 (γ-L-glutamylcysteine) and 275.97 (L-3,4-dihydroxyphenylalanine sulfate) were ionized only under acidic conditions (sample pH was 3.0 and matrix solvent was 0.1% TFA–acetone), yielding poor signal at both neutral and basic pHs (sample pH of 7.0 and matrix solvent was acetone and sample pH of 10.0 and matrix solvent was 2% ammonium hydroxide–acetone, respectively). Similarly, the metabolites at m/z 236.09 biopterin and 299.04 (cinnavalininate) were ionized only under neutral conditions, and the metabolite at m/z 321.17 (N-((R)-pantothenoyl)-L-cysteine) was ionized only under basic conditions. Additionally, although some metabolites can be ionized under two or all three conditions, the efficiency of ionization varied significantly at different pHs. For example, ionization efficiency was much greater for the metabolites at m/z 346.06 (AMP), 271.02 (naringenin), and 264.95 (1,3-diphosphoglyceric acid or 2,3-biphospho-D-glycerate) under acidic conditions, and for the metabolites at m/z 384.10 (phosphatidylserine), 328.04 (3′,5′-cylic adenosine phosphate (cAMP)), 306.08 (glutathione), and 229.04 (D-ribose-phosphate) under neutral conditions. In an effort to further improve signal, we observed that varying matrix pH but keeping sample pH constant can alter ionized metabolite profiles. As shown in the Figure S1 in the Supporting Information, mass profiles were completely changed when murine myocardial extract at pH 7.0 was mixed with matrix in solutions at three different pHs: 0.1% TFA–acetone, acetone and 2% ammonium hydroxide–acetone. Extensive analyses of murine myocardial extract with pH values of 3.0 or 10.0 mixed with matrix in solutions of three different pHs also demonstrated remarkable alterations in metabolite profiles (data not shown). Since MALDI-TOF MS analysis of metabolites using 9-aminoacridine as matrix is normally performed under neutral conditions, multiplexing ionization conditions provides a novel means to enhance penetrance into the metabolome, to improve S/N of metabolites present in low abundance, to provide an enhanced and enriched signal for TOF/TOF interrogation of peaks with very similar m/z values, and to identify the relative composition of ion peaks corresponding to multiple isobaric compounds.
Figure 2.

Expanded mass spectra of the water-soluble metabolites extracted from mouse heart tissue. Mass spectra were acquired on a 4800 MALDI-TOF/TOF analyzer in the negative ion mode using 9-aminoacridine as matrix under (A) acidic condition (sample pH is 3.0 and matrix solvent is 0.1% TFA–acetone), (B) neutral condition (sample pH is 7.0 and matrix solvent is acetone), and (C) basic condition (sample pH is 10.0 and matrix solvent is 2% ammonium hydroxide–acetone). Metabolites were extracted using the M/C/H extraction method. Individual mass spectrum of metabolites was obtained by averaging 1500 consecutive laser shots (50 shots per subspectra and 30 subspectra).
Metabolite ionization in the negative ion mode is typically enhanced by the presence of the conjugate base of phosphate and carboxylate functional groups. Varying pH values could change the charge state of these specific groups, leading to alterations in the ionization efficiency of metabolites containing these functional groups. Examination of detected metabolites (discussed below) identified that some metabolites containing multiple phosphates were ionized ideally under acidic or neutral conditions in the negative ion mode and that ionization efficiency as a singly charged ion decreased with increasing pH due to an increased prevalence of compounds with multiple negative charges. In contrast, for some monocarboxylate-containing metabolites, an increase in pH improved ionization in the negative ion mode due to increased deprotonation of these metabolites under our experimental conditions. However, as for the multiple phosphate-containing metabolites, for some multiple carboxylate-containing metabolites, increasing pH did not improve ionization. In fact, in some cases, it suppressed ionization due to the presence of multiple charged anions, particularly at the highest pH value employed (i.e., pH 10). Collectively, these examples underscore the potential for increased penetrance into the metabolome and improved metabolite discrimination through use of an appropriate set of multiplexed conditions during examination of metabolomes of interest. They also underscore the importance of using appropriate stable isotope standards for precise quantitation of metabolites through a MALDI approach due to the differential ionization sensitivities and properties of the observed metabolites.
Multiple pH Conditions for Selective Tandem MS Analysis
The use of a narrow mass window is important for successful tandem MS analysis of metabolites of similar mass by MALDI-TOF/TOF MS. Of course signal intensity is typically inversely proportional to the mass window utilized. Thus, care must be taken during TOF/TOF fragmentation of low-abundance ions of similar molecular mass to ensure that fragmentation ions are assigned to the appropriate ion peak. The normal mass window setting is typically at least 3–8 Da when low-abundance peaks are subjected to tandem MS analysis, to maximize information in the resultant high-energy fragmentation spectrum. Without prior chromatographic separation, however, ion peaks representing multiple low molecular weight metabolites are often crowded in the low molecular weight region, complicating interpretation of MS/MS spectra. A strategy for selective tandem MS analysis of low-abundance metabolites that did not subject the sample to uncertainties of the chromatographic procedure employed was developed. Through exploiting the differential ionization propensities of different cellular metabolites, substantial degrees of peak selection were achieved. As shown in Figure 3A, tandem MS analyses of metabolites at m/z 238.89 representing trimetaphosphate was not practical under neutral conditions (sample pH of 7.0 and matrix solvent was acetone) due to the presence of a neighboring peak at m/z 239.06 with similar intensity within the selectivity window. Narrowing the selectivity window reduced S/N to unusable levels. However, as shown in Figure 3C, adjustment of matrix pH to an acidic condition by using of 0.1% TFA–acetone as matrix solvent completely suppressed the ion peak at m/z 239.06 and permitted successful tandem MS structural identification of trimetaphosphate. Similarly, tandem mass analyses of metabolites at m/z 229.04 and 237.03 representing ribose-5-phosphate and D-erythro-1-(imidazol-4-yl)glycerol 3-phosphate failed at neutral conditions, but could be achieved using basic conditions.
Figure 3.

Expanded mass spectra of the water-soluble metabolites extracted from mouse heart tissue. Mass spectra were acquired on a 4800 MALDI-TOF/TOF analyzer in the negative ion mode using 9-aminoacridine as matrix under (A) neutral condition (sample pH is 7.0 and matrix solvent is acetone), (B) basic condition (sample pH is 10.0 and matrix solvent is 2% ammonium hydroxide–acetone), and (C) condition of sample pH being 7.0 and 0.1% TFA–acetone being matrix solvent. Metabolites were extracted using the M/C/H extraction method. Individual mass spectrum of metabolites was obtained by averaging 1500 consecutive laser shots (50 shots per subspectra and 30 subspectra).
Applying this pH multiplexing strategy to tandem MS analysis of medium-abundance ion peaks with intense neighboring ion peaks can also improve the selectivity of tandem MS spectra as well. For example, the ion peak at m/z 227.04 representing (R)-5-phosphomevalonate had two intense neighboring ion peaks of m/z 229.04 and 228.04 under neutral conditions (Figure 3). The tandem MS analysis of this compound was significantly affected by these neighboring peaks as the limits of the ion selection window did not allow complete 1-Da discrimination during MALDI-TOF/TOF MS. Changing the matrix solvent from acetone to 2% ammonium hydroxide–acetone completely suppressed the ion peaks at m/z 229.04 and 228.04. Thus, comparing the fragment ion intensities at each of two pHs facilitated the accrual of highly accurate fragmentation patterns even below the limits of the instrument’s selectivity window. If further confirmation is necessary, offsetting the center of the mass window is another tool that can be used in conjunction with tandem MS with multiplexed ionization for selectivity in tandem MS isolation of neighboring peaks (e.g., shifting from −2/+2 to −3/+1) at different pHs.
Identification of Metabolites Extracted from Mouse Heart Tissue
Part of the power of MALDI-TOF/TOF MS for metabolomics analysis is that it can elucidate the chemical structure of multiple isobaric molecular species that occur in the metabolome. This utilization of tandem MS both increases confidence in metabolite identification and permits the identification of underlying and, perhaps, unanticipated chemical isomers. We used tandem MS analysis, in conjunction with mass accuracy (as described in the Experimental Section), to unequivocally identify 90 metabolites in murine heart extracts. A total of 187 additional metabolite peaks were identified based solely on molecular mass because TOF/TOF was not successful either due to the fact that they were present in low abundance, because they were inefficiently ionized, or they could not be effectively fragmented.
Quantitation by MALDI requires comparisons with stable isotope counterparts of the compounds of interest. In some cases, an alternative is to use stable isotopes of representative moieties containing similar functionalities so that ratiometric comparisons to exogenous standards can be profiled. However, we stress that caution must be used in the profiling mode in MALDI and that definitive quantitation can only be made using stable isotope internal standard of the compound of interest. A list of the detected metabolites is provided in Table S1 of the Supporting Information. Fewer than 50 peaks have not been assigned, which may represent unknown metabolites, intrasource fragmentation products of known metabolites, or matrix adducts of metabolites.
In total, 56% of detected metabolites contained phosphate groups, while carboxylate-containing metabolites accounted for 37%. These results identify the suitability of negative ion MALDI MS for identification of both the readily ionized phosphate-containing metabolites and for the carboxylate functionality. Importantly, 40 metabolites’ peaks were identified as CoA and its derivatives. Figure 4 shows an example of the tandem MS spectrum of a typical CoA-containing metabolite, acetyl-CoA. The presence of the mass accuracy and a fragmentation pattern similar to that of authentic acetyl-CoA confirms the identity of this peak as acetyl-CoA. CoA and its esters play important roles in regulating intermediary metabolism. For example, alterations in the free CoA concentrations have been proposed to be primary regulators of metabolic flux. Similarly, alterations in acyl-CoA levels have been implicated as pathologic mediators of dysfunctional metabolism in several disease states including diabetes and ischemia.41,42 Each of the 11 intermediates in the tricarboxylic acid (TCA) cycle was detected. The ability to analyze TCA cycle intermediates after addition of stable isotope standards without the need for prior derivatization or chromatographic separation should facilitate interrogation of the metabolome. In addition, we detected low-abundance intracellular second messengers including cAMP, cyclic guanosine phosphate (cGMP), cylic adenosine diphosphate ribose, and inositol 1,4,5-triphopshate (IP3). By detecting variations in these metabolites through comparisons with stable isotope standards, this shotgun metabolomics approach can be used to monitor the state of cellular signal transduction processes in cells or tissues of interest.
Figure 4.

Comparison of tandem MS spectra of authentic acetyl-CoA and the ion at m/z 808.12 present in mouse heart extracts. The tandem MS spectra of (A) standard acetyl-CoA and (B) metabolite from mouse heart extract with ion peak at m/z 808.12 were acquired using a 4800 MALDI-TOF/TOF analyzer in the negative ion mode using 9-aminoacridine as matrix with CID on, metastable suppressor on, and timed ion selector enabled. The voltages of source 1, collision cell, and collision cell offset were 8.0, 7.0, and −0.035 kV, respectively. The collision gas was air at medium pressure. The tandem MS spectrum was obtained by averaging 2000 consecutive laser shots (50 shots per subspectra and 40 subspectra). The chemical structure of acetyl-CoA at the bottom demonstrates the assignments of major peaks on tandem MS spectra A and B. The similarity of spectra A and B assigns the metabolite with ion peak at m/z 808.12 to be acetyl-CoA.
Assignment of Isomeric Ion Peaks and Quantitative Analysis of Molar Ratios of Isomers by Tandem Mass Spectrometry
Metabolite extracts from biological sources are very complex and usually contain many groups of compounds with isobaric masses. Assignment of an identity to an ion peak containing multiple isomers (isomeric ion peak) is often quite difficult, even if tandem MS analysis is performed. Such isomeric ion peaks, by definition, represent mixtures of multiple isomers and will inevitably produce tandem MS spectra that may be difficult or impossible to interpret. Additionally, the determination of the molar ratio of isomers in a complex mixture requires further interrogation such as tandem MS. In this study, we use MALDI-TOF/TOF MS to identify diagnostic fragment ions whose ratio can be used to assign the identity and distribution of isomers in complex mixtures.
Since dGTP is isomeric with ATP, it is not possible to definitively assign the ion peaks at m/z 505.99 in the mass spectrum of murine myocardium to either moiety. However, tandem MS spectra of the ion peak at m/z 505.99 and comparisons with tandem MS spectra of authentic dGTP and ATP allow definitive assignment of isomeric composition (Figure 5). The tandem spectra of ATP and dGTP are completely identical except for six diagnostic fragments peaks at m/z 134.01, 272.89, and 370.94 in Figure 5A and at m/z 150.01, 274.94, and 354.93 in Figure 5B. Among these six signature peaks, fragment ion peaks at m/z 134.01 and 150.01 represent the adenine group and the guanine group that were generated from the fragmentation of the nucleotide moiety of ATP and dGTP, respectively. Tandem MS analyses of three standard mixtures, representing ratios of ATP to dGTP from 0.1:1 to 10:1, were prepared and analyzed by MALDI-TOF/TOF MS (Figure 6). The results demonstrate that the isomeric ion peak area ratios of m/z 134.01–150.01 were equal to the molar ratios of ATP to dGTP within experimental error. These results substantiate the use of tandem mass spectral isomeric ratios in the assignment of the molar ratios of ATP/dGTP in a mixture. Based on this strategy, the molar ratio of ATP/dGTP in mouse heart extract was determined to be ~25 by calculating the isomeric ion peak area ratios of m/z 134.01–150.01 in the tandem mass spectra of isomeric ion peaks at m/z 505.99 (the bottom of Figure 6). These data suggest that the contribution of dGTP to the isomeric ion peak at m/z 505.99 was less than 5%. Using this strategy, it was found that the ion peaks at m/z 426.01 and 346.01 also result largely (>95%) from ADP and AMP, respectively.
Figure 5.

Comparison of tandem MS spectra of authentic ATP, authentic dGTP, and the ion at m/z 505.99 present in mouse heart extracts. The tandem MS spectra of (A) authentic ATP, (B) authentic dGTP, and (C) metabolite from mouse heart extract with ion peak at m/z 505.99 were recorded on a 4800 MALDI-TOF/TOF analyzer in MS/MS negative ion mode using 9-aminoacridine as matrix with CID on, metastable suppressor on, and timed ion selector enabled. The voltages of source 1, collision cell, and collision cell offset were 8.0, 7.0, and −0.035 kV, respectively. The collision gas was air at medium pressure. The tandem MS spectrum was obtained by averaging 2000 consecutive laser shots (50 shots per subspectra and 40 subspectra). The chemical structures ATP and dGTP at the bottom show the assignments of their diagnostic fragments. Tandem MS spectrum of metabolite with ion peak at m/z 505.98 identifies the fragment of adenosine group at m/z 134.04 as an adenosine group, not a guanosine group at m/z 150.01, assigning this metabolite to be ATP, not dGTP.
Figure 6.

Comparisons of sectional tandem MS spectra of mixtures of authentic ATP and authentic dGTP at various molar ratios and the ion at m/z 505.99 present in mouse heart extracts. Authentic ATP and authentic dGTP were mixed at molar ratios of 10:1, 2:1, and 1:1. The spectrum at the bottom shows a sectional tandem MS spectrum of a metabolite from mouse heart extract with an ion peak at m/z 505.99 that was extracted from 20 mg of mouse heart tissue using the M/C/H method. All the spectra were recorded on a 4800 MALDI-TOF/TOF analyzer in MS/MS negative ion mode using 9-aminoacridine as matrix with CID on, metastable suppressor on, and timed ion selector enabled. The voltages of source 1, collision cell, and collision cell offset are 8.0, 7.0, and −0.035 kV, respectively. The collision gas is air at medium pressure. The tandem mass spectrum was obtained by averaging 2000 consecutive laser shots (50 shots per subspectra and 40 subspectra).
Quantitative Analyses of Mixtures of Five Compounds through Stable Isotope Analysis: Acetyl-CoA and Acetyl-CoA-13C2, ATP and ATP-13C10,15N5, Succinate and Succinate-d4, Lactate and Lactate-13C, and Pyruvate and Pyruvate-13C
MALDI-TOF/TOF MS analyses of five mixtures: acetyl-CoA and acetyl-CoA-13C2, ATP and ATP-13C10,15N5, succinate and succinated4, lactate and lactate-13C, and pyruvate and pyruvate-13C, were performed in the negative ion mode. The results are shown in Figure S2 of the Supporting Information. Figure S2A1 shows a plot of the normalized ratios (i.e., the ratio of the peak area to the relative molar concentration of acetyl-CoA or stable isotope-labeled 13C2-acetyl-CoA) versus the concentration of acetyl-CoA varied from 2.35 fmol to 2.35 nmol. The results demonstrate that, over this concentration range, the normalized ratios were equal to the theoretical ratios within experimental error. Plotting the ion peak area ratios of acetyl-CoA to acetyl-CoA-13C2 versus their actual molar ratios in the mixture in this concentration range gives a straight line with a slope of 1.00015 and a correlation coefficient of 0.9999 (Figure S2A2). Similarly, from Figure S2B1, S2C1, S2D1, and S2E1, the linear dynamic concentration ranges for the quantitation of ATP, succinate, lactate, and pyruvate were found to be 50 fmol–50 nmol, 17.4 pmol–17.4 nmol, 95 pmol–228 nmol, and 5.2 pmol–52 nmol. The slopes and correlation coefficients of each straight line shown in Figure S2B2, S2C2, S2D2, and S2E2 are both close to 1 as indicated. These results demonstrate that this methodology can be used to quantitate acetyl-CoA, ATP, succinate, lactate, and pyruvate by ratiometric comparison of their ions peak areas with their stable isotope-labeled internal standards and that accurate quantitation by MALDI-TOF MS is achievable using stable isotope-labeled standards.43,44 The detection limits for acetyl-CoA, ATP, succinate, lactate, and pyruvate, were 2 fmol, 16.7 fmol, 3.0 pmol, 30 pmol, and 3.3 pmol, respectively, in 1 μL of solution added to the matrix.
We were unable to quantitate ADP and AMP in mouse heart extracts. The laser energy necessary to generate an ADP signal suitable for quantitative analysis was much higher than that leading to intrasource ATP fragmentation. This was demonstrated by the fact that a stable isotope-labeled ADP signal was always found with the ADP signal, although only stable isotope-labeled ATP had been added to the extracts prior to MS analysis. Intrasource fragmentation of ATP was confirmed by the increase of ADP formation in concert with the increase of applied laser energy when only ATP was present in the sample spot. In addition, intrasource fragmentation of ADP to generate AMP was observed when laser power was increased to the threshold required to produce an AMP signal on MALDI-TOF/TOF MS. This observation can be explained by the facile hydrolysis of the P–O bond hydrolysis in di- and triphosphorylated nucleotides that is exploited in cells by coupling this reaction to the catalysis of energetically unfavorable reactions.
Metabolomic Analysis of Mouse Tissue Extract
Using stable isotope-labeled counterparts as internal standards, five energy metabolites (acetyl-CoA, ATP, succinate, lactate, pyruvate) were quantitated by analyzing heart tissue extracts from C57BL/6 wild type mice (Table 1). In wild type mouse heart tissue, ATP content was found to be 4.68 ± 1.11 nmol/mg of wet weight, which is consistent with that previously measured in rat heart tissue by 31P NMR.45–49 Acetyl-CoA is a key energy metabolite that is produced in vivo via two main pathways: fatty acid β-oxidation and pyruvate decarboxylation. Quantitation of acetyl-CoA has been performed via an enzymatic reaction using citrate synthase and malate dehydrogenase with the sensitivity of 200 pmol/assay32 or through a reversed-phase high-performance liquid chromatography with the sensitivity of 12 pmol/assay.50 Obviously, the sensitivity of the shotgun metabolomics approach (3 fmol/assay) is more than 3 orders of magnitude higher than previous methods, permitting detection of low metabolites from extremely small tissue samples (e.g., biopsies). The levels of acetyl-CoA and the other three metabolites quantitated by comparison to commercially available standards in murine myocardium are listed in Table 1.
Table 1.
Concentrations of Six Energy Metabolites in Wild Type Mouse Hearta
| metabolites | content |
|---|---|
| acetyl-CoA | 31.5 ± 0.9b |
| ATP | 4.68 ± 1.11c |
| cAMP | 66 ± 10.0b |
| succinate | 1.28 ± 0.19c |
| lactate | 19.6 ± 1.88c |
| pyruvate | 1.74 ± 0.46c |
| lactate/pyruvate (mean) | 11.3 |
Metabolites were extracted from 20–30 mg of C57BL/6 wild type mouse heart tissue using the methanol/chloroform/H2O extraction method. The data were quantitated on MALDI-TOF/TOF MS using stable isotope-labeled compounds as internal standards in the negative ion mode.
The results are expressed in pmol/mg of wet weight and represent means ± SD of five different animals.
The results are expressed in nmol/mg of wet weight and represent means ± SD of five different animals.
Identification and Profiling of cAMP in Murine Heart Extracts
cAMP is a nearly ubiquitous second messenger used in intracellular signal transduction pathways. The detection and quantitation of cAMP in animal tissue is currently achieved using either a radioimmunioassay procedure51 or fluorescence-based immunoassay.52 Although the measurement of cAMP in plant cells has been performed using ESI-MS,53,54 mass spectrometric determination of cAMP using MALDI or in animal tissues has not been reported to the best of our knowledge. Using the MALDI-TOF/TOF MS approach developed herein, cAMP was successfully detected in murine hearts (Figure 1C) as the ion peak at m/z 328.04. Its chemical identity was confirmed as cAMP by fragmentation profiles identical to those obtained with authentic cAMP (Figures 7A and D). Two isomers of cAMP shared an ion peak at m/z 328.04, adenosine 2′,3′-cyclic monophosphate and 2′-deoxyguanosine- 3′,5′-cyclic monophosphate (cdGMP) but were excluded by comparisons of tandem MS spectra of adenosine 2′,3′-cyclic monophosphate (Figure 7B) and cdGMP standards (Figure 7C) with the peak from the murine heart extract (Figure 7D). The detection limit of cAMP on MALDI-TOF/TOF MS was 1 pmol/μL of solution extract.
Figure 7.

Comparison of tandem MS spectra of authentic cAMP, authentic adenosine 2′,3′-cyclic monophosphate, authentic 2′-deoxyguanosine-3′, 5′-cyclic monophosphate (cdGMP), and a metabolite at m/z 328.05 from mouse heart extract. (A) is the tandem MS spectrum of authentic cAMP; (B) is the tandem MS spectrum of authentic adenosine 2′,3′-cyclic monophosphate; (C) is the tandem MS spectrum of authentic cdGMP; and (D) is the tandem MS spectrum of metabolite with ion peak at m/z 328.05. All the tandem MS spectra were recorded on a 4800 MALDI-TOF/TOF analyzer in MS/MS negative ion mode using 9-aminoacridine as matrix with CID off, metastable suppressor on, and timed ion selector enabled. The voltages of source 1, collision cell, and collision cell offset were 8.0, 7.0, and −0.035 kV, respectively. The collision gas was air at medium pressure. The tandem MS spectrum was obtained by averaging 2000 consecutive laser shots (50 shots per subspectra and 40 subspectra). The chemical structures cAMP and adenosine 2′, 3′-cylic monophosphate on the right side show the assignments of their diagnostic fragments.
Quantitation of cAMP cannot be precisely achieved without comparisons to a stable isotope internal standard. Unfortunately, stable isotope-labeled cAMP is not commercially available at the present time. However, by exploiting the similarity of the chemical structure of AMP to cAMP, we used stable isotope-labeled AMP to “approximate” the amounts of cAMP in myocardial tissue. The molar ratio of the cAMP standard relative to that of the AMP-13C10,15N5 was varied from 0.05 to 20, and values were plotted with the logarithmically scaled ion peak area ratios (Figure 8). These results suggest that quantitation of cellular cAMP can be approximated using AMP-13C10,15N5 as an internal standard. Applying this methodology, the content of cAMP in murine heart was found to be approximately 66 pmol/mg of wet weight, which is similar to the level of cAMP in intact myocardium under basal conditions.55
Figure 8.
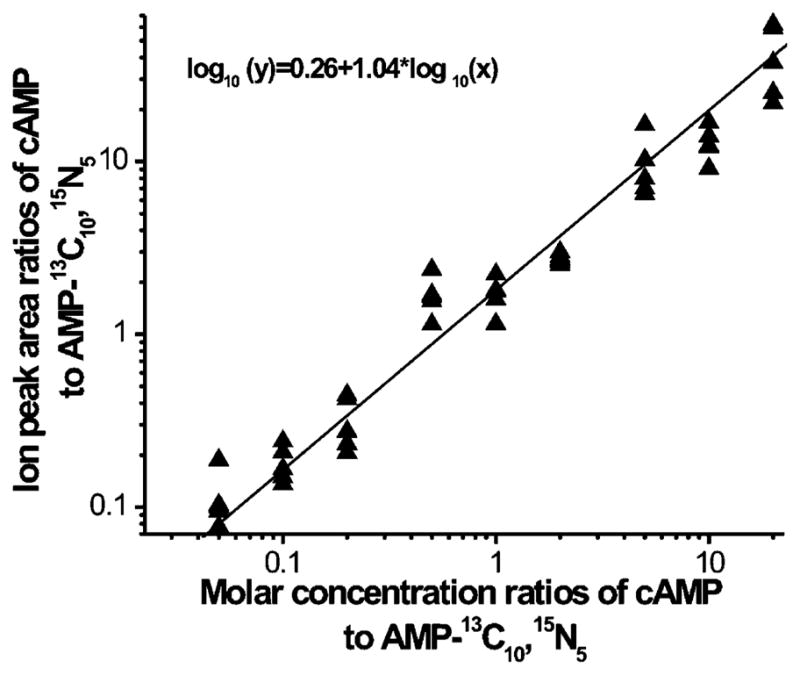
Standard curve for quantitation of cAMP using AMP-13C10,15N5 as an internal standard that was obtained by quantitative analyses of authentic cAMP and AMP-13C10,15N5 mixed at different molar ratios and analyzed with the 4800 MALDI-TOF/TOF analyzer. The obtained linear correlation between logarithmic ion peak area ratios and molar ratios of cAMP standard and AMP-13C10,15N5 was in the molar ratio range of 0.05–20. The concentrations of cAMP varied from 20 to 1 pmol/μL.
CONCLUSIONS
In this study, a shotgun metabolomics approach using MALDI-TOF/TOF MS was developed for the rapid analysis of negatively charged water-soluble cellular metabolites. Through development of a set of multiplexed conditions, identification of 285 peaks corresponding to negatively charged metabolites from mouse heart extracts was achieved and 90 of identified metabolites were confirmed by MALDI-TOF/TOF tandem MS. The distribution of isomers of isomeric molecular species could be determined through identification of diagnostic fragment ions. Moreover, “spectrometric isolation” of closely neighboring peaks could be achieved by choosing suitable ionization conditions. Collectively, these results identify the utility of multiplexed ionization conditions for the direct analysis of complex metabolomes by MALDI-TOF/TOF MS without the need for chromatographic separation of the diverse array of functionalities present in complex mixtures from biological sources.
Supplementary Material
Acknowledgments
This work was supported by National Institutes of Health Grant P01 HL-57278. We thank Dr. Ari M. Cedars and Mr. Harold Sims for the critical reading of the manuscript.
Footnotes
SUPPORTING INFORMATION AVAILABLE
(1) Expanded mass spectra of the water-soluble metabolites extracted from mouse heart tissue that were acquired under the condition of sample pH 7.0 with various matrix pHs; (2) quantitative analyses of metabolite standard mixtures with different molar ratios and at various concentrations; (3) list of detected metabolites. This material is available free of charge via the Internet at http://pubs.acs.org.
References
- 1.Weckwerth W, Loureiro ME, Wenzel K, Fiehn O. Proc Natl Acad Sci USA. 2004;101:7809–7814. doi: 10.1073/pnas.0303415101. [DOI] [PMC free article] [PubMed] [Google Scholar]
- 2.Raamsdonk LM, Teusink B, Broadhurst D, Zhang N, Hayes A, Walsh MC, Berden JA, Brindle KM, Kell DB, Rowland JJ, Westerhoff HV, van Dam K, Oliver SG. Nat Biotechnol. 2001;19:45–50. doi: 10.1038/83496. [DOI] [PubMed] [Google Scholar]
- 3.Schnackenberg LK, Beger RD. Pharmacogenomics. 2006;7:1077–1086. doi: 10.2217/14622416.7.7.1077. [DOI] [PubMed] [Google Scholar]
- 4.Oresic M, Vidal-Puig A, Hanninen V. Expert Rev Mol Diagn. 2006;6:575–585. doi: 10.1586/14737159.6.4.575. [DOI] [PubMed] [Google Scholar]
- 5.Griffin JL, Nicholls AW. Pharmacogenomics. 2006;7:1095–1107. doi: 10.2217/14622416.7.7.1095. [DOI] [PubMed] [Google Scholar]
- 6.Griffin JL. Curr Opin Chem Biol. 2006;10:309–315. doi: 10.1016/j.cbpa.2006.06.027. [DOI] [PubMed] [Google Scholar]
- 7.Alessandri MG, Celati L, Battini R, Casarano M, Cioni G. Anal Biochem. 2005;343:356–358. doi: 10.1016/j.ab.2005.05.003. [DOI] [PubMed] [Google Scholar]
- 8.Hori Y, Fujisawa M, Shimada K, Hirose Y. J Anal Toxicol. 2003;27:162–166. doi: 10.1093/jat/27.3.162. [DOI] [PubMed] [Google Scholar]
- 9.Wolthers BG, Kraan GP. J Chromatogr, A. 1999;843:247–274. doi: 10.1016/s0021-9673(99)00153-3. [DOI] [PubMed] [Google Scholar]
- 10.Maurer HH. J Chromatogr. 1992;580:3–41. doi: 10.1016/0378-4347(92)80526-v. [DOI] [PubMed] [Google Scholar]
- 11.Hammar CG, Holmstedt B, Lindgren JE, Tham R. Adv, Pharmacol, Chemother. 1969;7:53–89. [PubMed] [Google Scholar]
- 12.Dettmer K, Aronov PA, Hammock BD. Mass Spectrom Rev. 2006;26:51–78. doi: 10.1002/mas.20108. [DOI] [PMC free article] [PubMed] [Google Scholar]
- 13.Glinski M, Weckwerth W. Mass Spectrom Rev. 2006;25:173–214. doi: 10.1002/mas.20063. [DOI] [PubMed] [Google Scholar]
- 14.Mashego MR, Rumbold K, De Mey M, Vandamme E, Soetaert W, Heijnen JJ. Biotechnol Lett. 2007;29:1–16. doi: 10.1007/s10529-006-9218-0. [DOI] [PubMed] [Google Scholar]
- 15.Karas M, Hillenkamp F. Anal Chem. 1988;60:2299–2301. doi: 10.1021/ac00171a028. [DOI] [PubMed] [Google Scholar]
- 16.Hillenkamp F, Karas M. Methods Enzymol. 1990;193:280–295. doi: 10.1016/0076-6879(90)93420-p. [DOI] [PubMed] [Google Scholar]
- 17.Hillenkamp F, Karas M, Beavis RC, Chait BT. Anal Chem. 1991;63:1193A–1203A. doi: 10.1021/ac00024a002. [DOI] [PubMed] [Google Scholar]
- 18.Kirpekar F, Nordhoff E, Kristiansen K, Roepstorff P, Lezius A, Hahner S, Karas M, Hillenkamp F. Nucleic Acids Res. 1994;22:3866–3870. doi: 10.1093/nar/22.19.3866. [DOI] [PMC free article] [PubMed] [Google Scholar]
- 19.Wen X, Dagan S, Wysocki VH. Anal Chem. 2007;79:434–444. doi: 10.1021/ac061154l. [DOI] [PubMed] [Google Scholar]
- 20.Ayorinde FO, Hambright P, Porter TN, Keith QL., Jr Rapid Commun Mass Spectrom. 1999;13:2474–2479. doi: 10.1002/(SICI)1097-0231(19991230)13:24<2474::AID-RCM814>3.0.CO;2-0. [DOI] [PubMed] [Google Scholar]
- 21.Mims D, Hercules D. Anal Bioanal Chem. 2004;378:1322–1326. doi: 10.1007/s00216-003-2475-z. [DOI] [PubMed] [Google Scholar]
- 22.Mims D, Hercules D. Anal Bioanal Chem. 2003;375:609–616. doi: 10.1007/s00216-003-1771-y. [DOI] [PubMed] [Google Scholar]
- 23.Edwards JL, Kennedy RT. Anal Chem. 2005;77:2201–2209. doi: 10.1021/ac048323r. [DOI] [PubMed] [Google Scholar]
- 24.Vermillion-Salsbury RL, Hercules DM. Rapid Commun Mass Spectrom. 2002;16:1575–1581. [Google Scholar]
- 25.Wei J, Buriak JM, Siuzdak G. Nature. 1999;399:243–246. doi: 10.1038/20400. [DOI] [PubMed] [Google Scholar]
- 26.Shen ZX, Thomas JJ, Averbuj C, Broo KM, Engelhard M, Crowell JE, Finn MG, Siuzdak G. Anal Chem. 2001;73:612–619. doi: 10.1021/ac000746f. [DOI] [PubMed] [Google Scholar]
- 27.Thomas JJ, Shen ZX, Blackledge R, Siuzdak G. Anal Chim Acta. 2001;442:183–190. [Google Scholar]
- 28.Lewis WG, Shen ZX, Finn MG, Siuzdak G. Int J Mass Spectrom. 2003;226:107–116. [Google Scholar]
- 29.Zabet-Moghaddam M, Heinzle E, Tholey A. Rapid Commun Mass Spectrom. 2004;18:141–148. doi: 10.1002/rcm.1293. [DOI] [PubMed] [Google Scholar]
- 30.Armstrong DW, Zhang LK, He L, Gross ML. Anal Chem. 2001;73:3679–3686. doi: 10.1021/ac010259f. [DOI] [PubMed] [Google Scholar]
- 31.Le Belle JE, Harris NG, Williams SR, Bhakoo KK. NMR Biomed. 2002;15:37–44. doi: 10.1002/nbm.740. [DOI] [PubMed] [Google Scholar]
- 32.Williamson JR, Corkey BE. Methods Enzymol. 1971;13:434–513. [Google Scholar]
- 33.Smith CA, O’Maille G, Want EJ, Qin C, Trauger SA, Brandon TR, Custodio DE, Abagyan R, Siuzdak G. Ther Drug Monit. 2005;27:747–751. doi: 10.1097/01.ftd.0000179845.53213.39. [DOI] [PubMed] [Google Scholar]
- 34.Kanehisa M, Goto S, Kawashima S, Okuno Y, Hattori M. Nucleic Acids Res. 2004;32:D277–280. doi: 10.1093/nar/gkh063. [DOI] [PMC free article] [PubMed] [Google Scholar]
- 35.Wishart DS, Tzur D, Knox C, Eisner R, Guo AC, Young N, Cheng D, Jewell K, Arndt D, Sawhney S, Fung C, Nikolai L, Lewis M, Coutouly MA, Forsythe I, Tang P, Shrivastava S, Jeroncic K, Stothard P, Amegbey G, Block D, Hau DD, Wagner J, Miniaci J, Clements M, Gebremedhin M, Guo N, Zhang Y, Duggan GE, Macinnis GD, Weljie AM, Dowlatabadi R, Bamforth F, Clive D, Greiner R, Li L, Marrie T, Sykes BD, Vogel HJ, Querengesser L. Nucleic Acids Res. 2007;35:D521–526. doi: 10.1093/nar/gkl923. [DOI] [PMC free article] [PubMed] [Google Scholar]
- 36.Williamson JR, Corkey BE. Methods Enzymol. 1979;55:200–222. doi: 10.1016/0076-6879(79)55025-3. [DOI] [PubMed] [Google Scholar]
- 37.Viant MR. Methods Mol Biol. 2006;358:229–246. doi: 10.1007/978-1-59745-244-1_13. [DOI] [PubMed] [Google Scholar]
- 38.Villas-Boas SG, Mas S, Akesson M, Smedsgaard J, Nielsen J. Mass Spectrom Rev. 2005;24:613–646. doi: 10.1002/mas.20032. [DOI] [PubMed] [Google Scholar]
- 39.Han X, Gross RW. Mass Spectrom Rev. 2005;24:367–412. doi: 10.1002/mas.20023. [DOI] [PubMed] [Google Scholar]
- 40.Han X, Gross RW. Expert Rev Proteomics. 2005;2:253–264. doi: 10.1586/14789450.2.2.253. [DOI] [PubMed] [Google Scholar]
- 41.Lopaschuk GD, Neely JR. J Mol Cell Cardiol. 1987;19:281–288. doi: 10.1016/s0022-2828(87)80595-3. [DOI] [PubMed] [Google Scholar]
- 42.Lopaschuk GD, Hansen CA, Neely JR. Am J Physiol. 1986;250:H351–359. doi: 10.1152/ajpheart.1986.250.3.H351. [DOI] [PubMed] [Google Scholar]
- 43.Wittmann C, Heinzle E. Eur J Biochem. 2001;268:2441–2455. doi: 10.1046/j.1432-1327.2001.02129.x. [DOI] [PubMed] [Google Scholar]
- 44.Wittmann C, Heinzle E. Biotechnol Bioeng. 2001;72:642–647. [PubMed] [Google Scholar]
- 45.Hitchins S, Cieslar JM, Dobson GP. Am J Physiol Heart Circ Physiol. 2001;281:H882–887. doi: 10.1152/ajpheart.2001.281.2.H882. [DOI] [PubMed] [Google Scholar]
- 46.Bak MI, Ingwall JS. Am J Physiol. 1992;262:E943–947. doi: 10.1152/ajpendo.1992.262.6.E943. [DOI] [PubMed] [Google Scholar]
- 47.Garlick PB, Townsend RM. Am J Physiol. 1992;263:H497–502. doi: 10.1152/ajpheart.1992.263.2.H497. [DOI] [PubMed] [Google Scholar]
- 48.Humphrey SM, Garlick PB. Am J Physiol. 1991;260:H6–12. doi: 10.1152/ajpheart.1991.260.1.H6. [DOI] [PubMed] [Google Scholar]
- 49.Williams JP, Headrick JP. Biochim Biophys Acta. 1996;1276:71–79. doi: 10.1016/0005-2728(96)00036-9. [DOI] [PubMed] [Google Scholar]
- 50.King MT, Reiss PD, Cornell NW. Methods Enzymol. 1988;166:70–79. doi: 10.1016/s0076-6879(88)66012-5. [DOI] [PubMed] [Google Scholar]
- 51.Steiner AL. Methods Enzymol. 1974;38:96–105. doi: 10.1016/0076-6879(74)38016-0. [DOI] [PubMed] [Google Scholar]
- 52.Hesley J, Daijo J, Ferguson AT. Biotechniques. 2002;33:691–694. doi: 10.2144/02333dd05. [DOI] [PubMed] [Google Scholar]
- 53.Richards H, Das S, Smith CJ, Pereira L, Geisbrecht A, Devitt NJ, Games DE, van Geyschem J, Gareth Brenton A, Newton RP. Phytochemistry. 2002;61:531–537. doi: 10.1016/s0031-9422(02)00266-2. [DOI] [PubMed] [Google Scholar]
- 54.Ehsan H, Reichheld JP, Roef L, Witters E, Lardon F, Van Bockstaele D, Van Montagu M, Inze D, Van Onckelen H. FEBS Lett. 1998;422:165–169. doi: 10.1016/s0014-5793(97)01610-4. [DOI] [PubMed] [Google Scholar]
- 55.Levin MC, Marullo S, Muntaner O, Andersson B, Magnusson Y. J Biol Chem. 2002;277:30429–30435. doi: 10.1074/jbc.M200681200. [DOI] [PubMed] [Google Scholar]
Associated Data
This section collects any data citations, data availability statements, or supplementary materials included in this article.