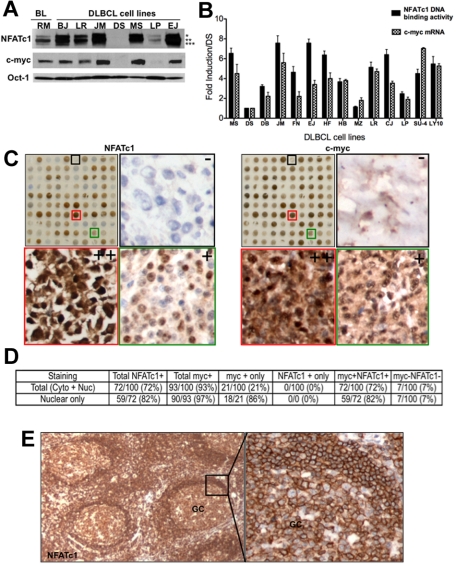
Figure 1.
Correlation of NFATc1 and c-myc protein expression in B-cell lymphomas. (A) Nuclear extracts (25 μg) were purified from a Burkitt lymphoma cell lines (Ramos) and 7 DLBCL cell lines (BJAB,LR, McA, DS, MS, LP, and EJ) and analyzed for expression of NFATc1, c-myc, and Oct-1 (protein loading control) proteins by Western blotting. *, **, and *** denote hyperphosphorylated, phosphorylated, and dephosporylated NFATc1 protein bands, respectively. (B) Purified RNA and nuclear extracts from representative DLBCL cell lines were analyzed for c-myc mRNA expression and for NFATc1 DNA binding, respectively. DS, negative for both c-myc and NFATc1, was used as a baseline negative control. Values indicate fold-induction over DS from triplicate samples of 2 independent experiments. SU4, SUDHL-4; LY10, OCI-LY10. P for NFATc1 DNA binding versus c-myc mRNA for all cell lines was determined by the Student t test (P = .166; R2 = 0.07246). (C) TMA of DLBCL (100 cases) for NFATc1 and c-myc protein expressions by immunohistochemistry. Representative high-magnification (×200) TMA sections from DLBCL biopsy cores that are negative (−, black box), moderate (+, green box) or high (++, red box) immunostaining for NFATc1 and c-myc (side panels). (D) Analysis for NFATc1 and c-myc protein expression in DLBCL TMA (100 cases), using 30% cutoff. (E) Immunostaining for NFATc1 in reactive lymph node section. GC, germinal center (×100; ×400).

