

Abstract
Background
Systolic blood pressure and pulse pressure are substantially higher in older adults. The relative contributions of increased forward versus reflected pressure wave amplitude or earlier arrival of the reflected wave to elevated pulse pressure remain controversial.
Methods and Results
We measured proximal aortic pressure and flow, forward pressure wave amplitude, global wave reflection, reflected wave timing and pulse wave velocity noninvasively in 6417 (age range, 19 to 90 years; 53% women) Framingham Heart Study Third Generation and Offspring participants. Variation in forward wave amplitude paralleled pulse pressure throughout adulthood. In contrast, wave reflection and pulse pressure were divergent across adulthood: in younger participants, pulse pressure was lower and wave reflection higher with advancing age whereas in older participants, pulse pressure was higher and wave reflection lower with age. Reflected wave timing differed modestly across age groups despite considerable differences in pulse wave velocity. Forward wave amplitude explained 80% (central) and 66% (peripheral) of the variance in pulse pressure in younger participants (<50 years) and 90% and 84% in the older participants (≥50 years, all P<0.0001). In a stepwise model that evaluated age-pulse pressure relations in the full sample, the late accelerated increases in central and peripheral pulse pressure were markedly attenuated when variation in forward wave amplitude was considered.
Conclusions
Higher pulse pressure at any age and higher pulse pressure with advancing age is predominantly associated with a larger forward pressure wave. The influence of wave reflection on age-related differences in pulse pressure was minor.
Keywords: aorta, arterial stiffness, pulse wave velocity, blood pressure, pulse pressure, cardiovascular disease
Blood pressure increases substantially with advancing age across the full human lifespan; however patterns of change in various blood pressure components (systolic, diastolic, mean and pulse pressure) are complex and nonlinear.1 The pathogenesis of nonlinear age trajectories of blood pressure components has been debated vigorously in recent years. There is general agreement that mean arterial pressure increases in young adulthood and then remains relatively stable in middle-aged and older adults.2 The early increase in mean arterial pressure is a manifestation of greater cardiac output or peripheral resistance, possibly due to activation of the sympathetic nervous system, hypervolemia or small vessel disease or dysfunction.3 From midlife onward, when hypertension is prevalent, systolic and pulse pressure increase substantially, mean arterial pressure plateaus and diastolic pressure falls.1;2 Thus, a considerable majority of the population burden of hypertension is associated with increasing pulse pressure with advancing age.
Hemodynamic mechanisms underlying the increase in pulse pressure from midlife onward remain unclear. A contemporary view asserts that increasing pulse pressure is attributable to increased amplitude and earlier return of a reflected pressure wave due to aortic wall stiffening and increased pulse wave velocity (PWV).4 However, this notion is challenged by reports that relative wave reflection, as assessed by central augmentation index, increases until midlife and then plateaus or falls thereafter at a time when pulse pressure and PWV increase dramatically.5;6 The discrepancy between changes in augmentation and pulse pressure suggests that an increase in forward wave amplitude may account for the age-related increase in pulse pressure.
The considerable burden of disease attributable to non-optimal blood pressure levels and inadequate blood pressure control even when therapy is initiated7 provide an impetus to better define mechanisms of blood pressure elevation throughout the human lifespan. Such pathophysiologic knowledge is essential to facilitate development and use of more effective management strategies. Therefore, we performed a comprehensive noninvasive assessment of hemodynamics across the adult human age spectrum in order to define hemodynamic correlates of blood pressure with advancing age in a community-based setting.
Methods
Study participants
The designs of the Framingham Offspring and Third Generation Studies have been presented.8;9 The cohorts include predominantly white participants of European descent. Noninvasive hemodynamics were assessed routinely in participants undergoing their first examination for the Third Generation (2002-2005) and eighth examination for Offspring (2005-2008). The Boston University Medical Center Institutional Review Board approved the protocol and all participants gave written informed consent.
A satisfactory evaluation of central pressure-flow relations was obtained in 4028 (99%) of 4082 Third Generation participants and 2768 (96%) of 2889 Offspring participants. A satisfactory evaluation of carotid-brachial and carotid-femoral PWV was obtained in 3858 (95%) Third Generation and 2704 (94%) Offspring participants, resulting in 3831 (94%) Third Generation and 2645 (92%) Offspring participants with complete hemodynamic data. Additional exclusions for missing covariate data gave a final sample size of 6417.
To assess reference hemodynamic values, we defined a reference sample of 1547 (24%) participants by excluding participants for one or more of the following nonexclusive reasons: age ≥50 years (n=3100), hypertension (systolic blood pressure ≥140 mm Hg, diastolic blood pressure ≥90 mm Hg or drug treatment for hypertension, n=2086), diabetes (fasting blood glucose ≥126 mg/dl or treatment with insulin or oral hypoglycemic agent, n=535), dyslipidemia (total cholesterol ≥240 mg/dl, triglycerides ≥150 mg/dl, HDL ≤40 mg/dl or treated for a lipid disorder, n=2842), cardiovascular disease (coronary heart disease, heart failure, stroke, transient ischemic attack or intermittent claudication, n=405), current cigarette smoking (smoking within 12 months prior to the index examination, n=891), or obesity (body mass index ≥30 kg/m2, n=1545).
Noninvasive hemodynamic data acquisition and analysis
Details of the noninvasive hemodynamic protocol and analyses have been published and are summarized in the online Supplement.10-15 As reported previously, reproducibility of central hemodynamic measures using our protocol is high, with intraclass correlation coefficients of 0.93-0.95 for repeated measures of central hemodynamic variables, such as cardiac output and characteristic impedance.13;16 Noninvasive central hemodynamic measures correlate closely with invasive measures.10
Statistical analysis
Sample characteristics were tabulated separately in the reference sample and in the entire study sample (the ‘broad’ sample). Based on the median age of the broad sample (49 years), we defined 2 age subgroups (<50 or ≥50 years of age). Cutpoints for extreme values for hemodynamic variables were defined as the 95th percentile (5th percentile for total arterial compliance and reflected wave transit time) of the reference sample. Percentages of participants with values outside those limits were tabulated by age subgroup for key hemodynamic variables. Logistic regression was use to compare prevalences of extreme values between age subgroups, adjusting for sex, body mass index, heart rate, total cholesterol, high-density lipoprotein cholesterol, triglycerides, fasting glucose, diabetes, prevalent cardiovascular disease, use of anti-hypertensive medication, use of lipid medications and active smoking. To illustrate the association of hemodynamic variables with age, variables were summarized according to decades of age and plotted. To ensure adequate sample size at the lower and upper extremes of age, participants <30 or ≥80 years of age, respectively, were grouped together. We used bilinear curve fitting to estimate the slopes of hemodynamic variables relative to age, with an age transition point at 50 years.
We used stepwise linear regression to assess the proportion of variance in central and peripheral pulse pressure attributable to variability in forward wave amplitude, relative wave reflection and reflected wave timing. The global reflection factor was used as a measure of relative wave reflection (Supplemental Methods). Temporal overlap of the reflected wave with systole was used as a measure of relative timing. Models were constructed separately in median age subgroups. To assess the contribution of wave components to age-related differences in pulse pressure, we repeated the stepwise models in the full sample and included variables for age and for age if age was ≥50 years (which provides an estimate of the change in age slope after 50 years of age). Change in the age effects at each step was considered a measure of the contribution of the entered variable to differences in pulse pressure with increasing age. All models were adjusted for sex.
The authors had full access to and take full responsibility for the integrity of the data. All authors have read and agree to the manuscript as written.
Results
Sample characteristics
Characteristics of the reference and broad samples are presented in Table 1. The reference sample was leaner and by definition had a healthier risk factor profile. Similarly, younger participants in the broad sample had a lower risk factor burden and prevalence of disease than older participants (Table 1).
Table 1.
Sample characteristics.
| Variables | Reference Group* |
Full Sample by Age Group |
|
|---|---|---|---|
| <50 years (N=1547) | <50 years (N=3317) | ≥50 years (N=3100) | |
| Age, yr | 37±7 | 38±7 | 64±9 |
| Women, N (%) | 1020 (66) | 1746 (53) | 1686 (54) |
| Height, cm | 170±9 | 171±9 | 167±10 |
| Weight, kg | 69±12 | 77±18 | 79±17 |
| Body mass index, kg/m2 | 23.8±3.0 | 26.3±4.9 | 27.9±5.1 |
| Seated blood pressure, mm Hg | |||
| Systolic | 110±10 | 115±13 | 128±17 |
| Diastolic | 71±8 | 75±10 | 74±10 |
| Heart rate, beats/min | 60±9 | 62±10 | 62±10 |
| Total cholesterol, mg/dL | 177±27 | 187±35 | 189±38 |
| HDL cholesterol, mg/dL | 60±14 | 54±16 | 58±18 |
| Total / HDL cholesterol ratio | 3.1±0.8 | 3.7±1.4 | 3.5±1.1 |
| Triglycerides, mg/dL† | 70 (55, 93) | 89 (63, 133) | 101 (73, 141) |
| Glucose, mg/dL | 90±7 | 94±17 | 105±23 |
| Hypertension treatment, N (%) | 0 (0) | 189 (6) | 1356 (44) |
| Lipid treatment, N (%) | 0 (0) | 170 (5) | 1185 (38) |
| Cardiovascular disease, N (%) | 0 (0) | 12 (<1) | 393 (13) |
| Diabetes, N (%) | 0 (0) | 66 (2) | 469 (15) |
| Smoker, N (%) | 0 (0) | 583 (18) | 308 (10) |
The reference group further excluded participants with hypertension, diabetes, dyslipidemia, cardiovascular disease, current smoking or obesity as detailed in Methods.
Median (25th, 75th percentile)
Arterial properties in the reference group
The mean and 95% cutpoints for key hemodynamic variables in the reference group and prevalences of extreme values in the broad sample are shown in Table 2. Prevalences of extreme values in the younger group (<50 years of age) were higher than the 5% expected by definition for a number of hemodynamic variables, including systolic, diastolic and mean blood pressure, PWV and cardiac output. In contrast, prevalences of abnormal characteristic impedance and peripheral resistance, key determinants of pulsatile and steady flow load, respectively, were not increased relative to the reference value (Table 2). Prevalences of extreme values for most hemodynamic variables (except cardiac output) were considerably higher than the expected 5% in the older group (Table 2). For example, more than half of the older participants had elevated supine brachial systolic and central pulse pressure and CFPWV and 30% or more had elevated mean arterial pressure, characteristic impedance and forward wave amplitude and reduced reflected wave transit time.
Table 2.
Hemodynamic variables for the reference group and prevalence of abnormal values by age group.
| Variables | Reference Group* (N = 1547) |
Prevalence of Abnormal Values in the Broad Sample by Age, % |
|||
|---|---|---|---|---|---|
| Mean ± SD | Cutoff Values† | < 50 years (N = 3317) | ≥ 50 years (N = 3100) | P‡ | |
| Supine blood pressure, mm Hg | |||||
| Systolic | 115±11 | 134 | 13 | 57 | <0.0001 |
| Diastolic | 64±8 | 76 | 14 | 21 | <0.0001 |
| Mean | 84±9 | 98 | 16 | 45 | <0.0001 |
| Brachial pulse pressure | 51±9 | 68 | 7 | 47 | <0.0001 |
| Central pulse pressure | 47±10 | 64 | 9 | 51 | <0.0001 |
| Peripheral resistance, dyne × sec/cm5 | 1669±323 | 2230 | 5 | 28 | <0.0001 |
| Characteristic impedance, dyne × sec/cm5 | 172±45 | 259 | 5 | 31 | <0.0001 |
| Carotid-femoral pulse wave velocity, m/s | 6.4±0.9 | 8.1 | 12 | 69 | <0.0001 |
| Carotid-brachial pulse wave velocity, m/s | 7.7±1.4 | 10.0 | 9 | 23 | <0.0001 |
| Total arterial compliance, mL/mm Hg | 1.71±0.53 | 0.99 | 6 | 29 | <0.0001 |
| Forward wave, mm Hg | 42±9 | 59 | 8 | 37 | <0.0001 |
| Reflection factor, ratio | 0.34±0.06 | 0.44 | 4 | 11 | <0.0001 |
| Augmentation index, % | 6.3±12.1 | 23.9 | 8 | 21 | <0.0001 |
| Reflected wave transit time, ms | 143±19 | 115 | 8 | 31 | <0.0001 |
| Cardiac output, L/min | 4.1±0.8 | 5.6 | 10 | 7 | <0.0001 |
The reference group was defined as per Table 1 and Methods.
All values represent the 95th percentile of the reference group, except those for total arterial compliance and reflected wave transit time, which represent the 5th percentile.
Represents P-values for comparison of prevalence in age groups, adjusted for variables noted in Methods.
Cross-sectional relations between age and pulsatile hemodynamics
Key pulsatile hemodynamic variables are summarized by decades of age in Figures 1 and 2 and separately by sex in Figures S3 and S4. Slopes of the relations between age and hemodynamic variables for younger and older participants are presented in Table S1. Mean arterial pressure increased with age in the younger groups (<50 years of age); however, this age trend was attenuated by half after 50 years of age (Figure 1, Table S1). Systolic blood pressure had a relatively flat age profile across younger decades and then increased in parallel with pulse pressure. Diastolic pressure increased in parallel with mean pressure across younger decades and then fell as pulse pressure increased in the older decades (Figure 1BC, 2A, Table S1). Augmentation index increased as pulse pressure fell in younger participants and then fell as pulse pressure increased in older participants (Figure 1B, Table S1). Differences in characteristic impedance across decades paralleled differences in pulse pressure (Figure 1C). CFPWV was higher with age, particularly after 50 years of age when the age slope increased by four fold (Table S1). In contrast, differences in CBPWV with age were modest (Figure 1D), particularly in older participants (≥50 years, Table S1). On average, the reflected wave arrived in mid-systole in the youngest participants (<30 years of age, Figure 1C, 2B). The reflected wave arrived earlier with increasing age prior to 50 years of age and arrived later with increasing age thereafter (Table S1) despite major increments in CFPWV across the older decades (Figure 1D). Lower augmentation index with advancing age after 50 years of age contrasted with progressively higher pulse pressure, characteristic impedance and CFPWV across these same age decades (Figure 1).
Figure 1.
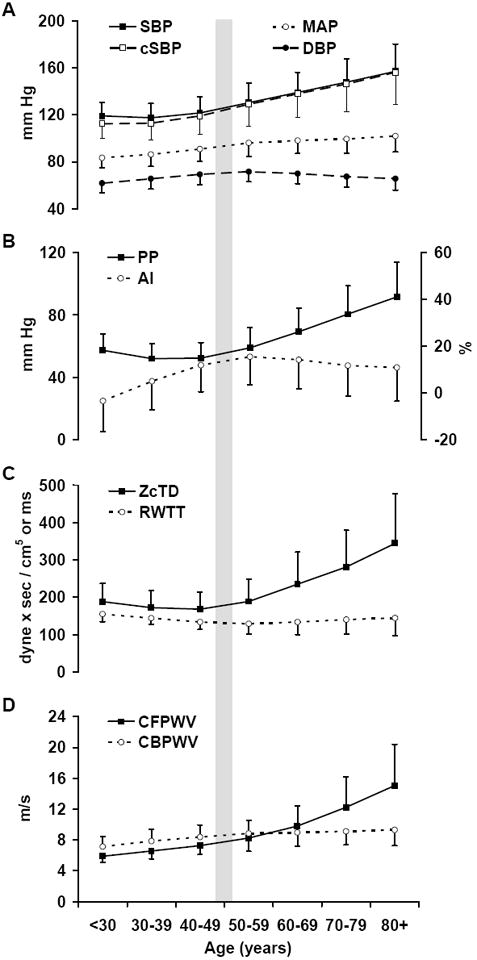
Key hemodynamic variables summarized by decades of age. A. Blood pressure components: brachial systolic (SBP), central systolic (cSBP), diastolic (DBP) and mean arterial (MAP) pressure. B. Peripheral pulse pressure (PP) and central augmentation index (AI). C. Characteristic impedance of the aorta computed in the time domain (ZcTD) and reflected wave transit time (RWTT). D. Carotid-femoral (CFPWV) and carotid-brachial (CBPWV) pulse wave velocities. The sample size per decade was 463 (<30), 1334 (30-39), 1521 (40-49), 1096 (50-59), 1103 (60-69), 689 (70-79) and 213 (≥80).
Figure 2.
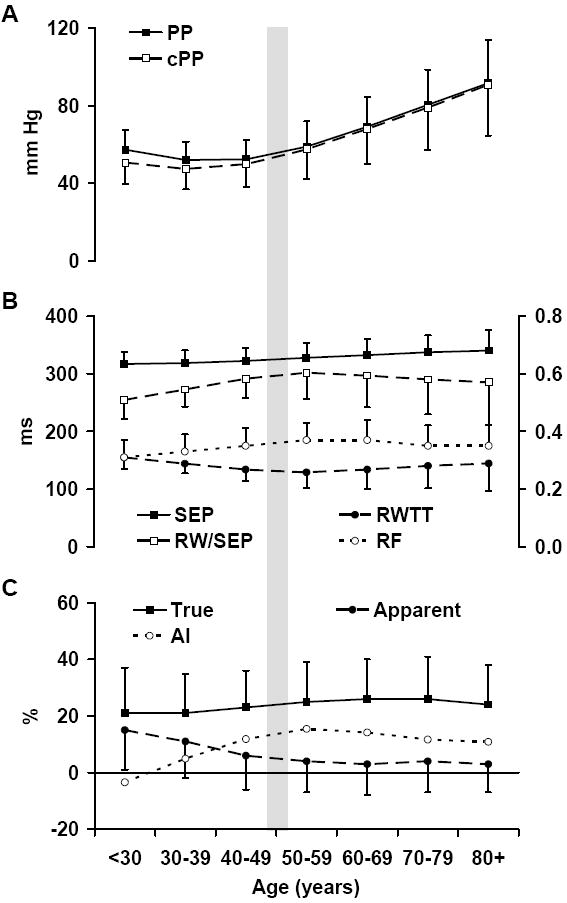
Pressure amplification and measures of wave reflection by decades of age. A. Brachial (PP) and central (cPP) pulse pressure. B. Systolic ejection period (SEP), reflected wave transit time (RWTT), overlap between reflected wave arrival and the systolic ejection period (RW/SEP) and the global reflection factor (RF). C. True and apparent amplification and augmentation index (AI).
Central and peripheral pulse pressure and pressure amplification are summarized by decades of age in Figure 2. Pulse pressure fell with age prior to 50 years of age and increased thereafter. Apparent amplification was maximal prior to 30 years of age, when central augmentation was minimal. Central augmentation was higher and apparent amplification lower across age decades through 60 years of age (Figure 2C). In contrast, true amplification differed relatively little across age decades.
Forward and reflected waves and pulse pressure
The contributions of waveform components to variability in central and peripheral pulse pressure in the younger and older participants are presented in Table 3. In the younger group, forward wave amplitude accounted for 80% of the variance in central pulse pressure and 66% of the variance in peripheral pulse pressure. In the older group, forward wave amplitude accounted for 90% of the variance in central pulse pressure and 84% of the variance in peripheral pulse pressure. Overall, the global reflection factor accounted for an additional 4-11% of variance, whereas overlap between forward and reflected waves accounted for 1% or less of the variance in pulse pressures (Table 3).
Table 3.
Hemodynamic correlates of pulse pressure in younger and older participants.
| Variables | Central Pulse Pressure |
Peripheral Pulse Pressure |
||||||
|---|---|---|---|---|---|---|---|---|
| Estimate* | P | Partial R2† | Model R2 | Estimate* | P | Partial R2† | Model R2 | |
| Age <50 years | ||||||||
| Forward pressure wave | 11.3±0.1 | <0.001 | 0.80 | 0.93 | 9.1±0.1 | <0.001 | 0.66 | 0.78 |
| Reflection factor | 3.4±0.1 | <0.001 | 0.11 | 2.1±0.1 | <0.001 | 0.04 | ||
| Reflected wave overlap | 1.3±0.1 | <0.001 | 0.01 | -0.2±0.1 | 0.03 | 0.0003 | ||
| Age ≥50 years | ||||||||
| Forward pressure wave | 21.5±0.1 | <0.001 | 0.90 | 0.97 | 18.3±0.1 | <0.001 | 0.84 | 0.89 |
| Reflection factor | 5.5±0.1 | <0.001 | 0.07 | 4.3±0.1 | <0.001 | 0.05 | ||
| Reflected wave overlap | 0.8±0.1 | <0.001 | 0.002 | -0.2±0.1 | 0.16 | 0.0001 | ||
Estimates expressed per 1 SD of the independent variable, adjusted for sex.
Represents the increment in response variance explained upon stepwise entry of specific regressor variables.
The statistical contribution of forward and reflected pressure waves to pulse pressure-age relations is presented in Table 4. A base model including only age variables and sex (Model 1) demonstrates the accelerated increase in pulse pressure with age in the older subgroup (Table 4). When forward wave amplitude entered (Model 2), late acceleration of the pulse pressure-age slope (Age if ≥50 years) was markedly attenuated and model R2 increased. When the global reflection factor (Model 3) and reflected wave overlap (Model 4) entered the model, further changes in residual pulse pressure-age relations and increments to model R2 were modest.
Table 4.
Hemodynamic correlates of the pulse pressure difference between younger and older participants.
| Model* | Variables | Central Pulse Pressure |
Peripheral Pulse Pressure |
||||||
|---|---|---|---|---|---|---|---|---|---|
| Central Pulse Pressure |
Peripheral Pulse Pressure |
||||||||
| Estimate† | P | Partial R2‡ | Model R2 | Estimate† | P | Partial R2‡ | Model R2 | ||
| 1 | Age | 1.8±0.4 | <0.001 | 0.39 | 0.39 | -1.5±0.4 | <0.001 | 0.43 | 0.43 |
| Age (if ≥50 years) | 10.4±0.4 | <0.001 | 12.5±0.4 | <0.001 | |||||
| 2 | Forward pressure wave | 17.1±0.1 | <0.001 | 0.89 | 0.91 | 13.8±0.1 | <0.001 | 0.84 | 0.87 |
| Age | 4.6±0.2 | <0.001 | 0.02 | 0.74±0.2 | <0.001 | 0.027 | |||
| Age (if ≥50 years) | -1.8±0.2 | <0.001 | 2.7±0.2 | <0.001 | |||||
| 3 | Forward pressure wave | 18.6±0.06 | <0.001 | 0.89 | 0.97 | 14.7±0.1 | <0.001 | 0.84 | 0.90 |
| Reflection factor | 4.9±0.05 | <0.001 | 0.072 | 3.3±0.1 | <0.001 | 0.045 | |||
| Age | 2.2±0.1 | <0.001 | 0.004 | -0.9±0.2 | <0.001 | 0.014 | |||
| Age (if ≥50 years) | -0.9±0.1 | <0.001 | 3.3±0.2 | <0.001 | |||||
| 4 | Forward pressure wave | 18.4±0.06 | <0.001 | 0.89 | 0.97 | 14.7±0.09 | <0.001 | 0.84 | 0.90 |
| Reflection factor | 4.6±0.05 | <0.001 | 0.072 | 3.3±0.08 | <0.001 | 0.045 | |||
| Age | 1.7±0.1 | <0.001 | 0.004 | -1.0±0.2 | <0.001 | 0.014 | |||
| Age (if ≥50 years) | -0.4±0.1 | <0.001 | 3.4±0.2 | <0.001 | |||||
| Reflected wave overlap | 0.86±0.05 | <0.001 | 0.001 | 0.15±0.08 | 0.056 | 0.0001 | |||
All models adjusted for sex. Age slope and slope difference for age ≥50 years are included in model 1; additional variables entered the model stepwise in the order shown.
Estimate ± SE expressed per 1 SD of continuous variables.
Represents the increment in response variance explained upon stepwise entry of specific regressor variable.
Discussion
The present study is a comprehensive noninvasive assessment of aortic input impedance and pulsatile hemodynamics in a large unselected community-based sample with participants spanning the adult age spectrum. The analyses document the known accelerated increase in systolic and pulse pressure with advancing age after midlife. Using combined assessment of central aortic pressure and flow, which is required in order to separate and quantify forward and reflected waves, we demonstrate that the overwhelming majority of the late life acceleration in the pulse pressure-age relation is attributable to differences in forward pressure wave amplitude. Furthermore, variability in forward wave amplitude accounts for the majority of the variability in central (80-90%) and peripheral (66-84%) pulse pressure within each age range when younger (<50 years) and older (≥50 years) participants are considered separately. As a result, the age profiles of forward wave amplitude, characteristic impedance and pulse pressure are concordant throughout the adult age spectrum (Figure 1BC). In contrast, the age profiles of wave reflection (global reflection factor or augmentation index) and pulse pressure are divergent throughout most of adulthood, with pulse pressure falling and wave reflection rising with age decade in younger participants and pulse pressure rising markedly as wave reflection falls after 50 years of age (Figure 1B, Table S1). Thus, across the adult age spectrum, forward pressure wave amplitude, which is closely related to characteristic impedance of the aorta, is by far the predominant correlate of central and peripheral pulse pressure at any age and the predominant correlate of the late increase in pulse pressure after midlife in our cross-sectional analysis of noninvasive hemodynamics in this large community-based sample.
Pressure wave reflection and amplification
Our findings regarding the contribution of wave reflection to pulse pressure differences with age contrast with prior studies that measured pressure only and considered augmented pressure amplitude rather than relative wave reflection, as assessed by the global reflection factor or augmentation index.6;17;18 Augmented pressure represents the product of forward wave amplitude and relative wave reflection. If forward wave amplitude increases and relative wave reflection remains the same or even falls, as we have shown after 50 years of age, reflected wave amplitude will increase as long as the increase in forward wave amplitude exceeds the reduction in relative wave reflection. We avoided the confounding effect of forward wave amplitude on the amplitude of the reflected wave by evaluating the global reflection factor. Using this approach, we have shown that in younger and older participants, differences in relative wave reflection account for a modest proportion of the variance in pulse pressure.
To assess the contribution of wave reflection to differences between central and peripheral pulse pressure, we evaluated true and apparent pressure amplification. True amplification quantifies the increase in amplitude of the pressure waveform relative to the initial forward wave whereas apparent amplification quantifies the net difference between central and peripheral pulse pressure. True amplification increases with increasing wave reflection whereas apparent amplification decreases because augmentation of the central pressure waveform by a late pressure peak obscures true amplification. The reciprocal relation between apparent amplification and augmentation was present before 50 years of age, when the reflection factor was higher and reflected wave transit time lower with age (Figure 2). However, after midlife, the increase in augmentation toward an upper limit represented by true amplification ceased and actually reversed. Reduced augmentation was in part a manifestation of reduced wave reflection arriving in the central aorta, as evidence by the reduction in reflection factor, suggesting that alterations in arterial structure in older people may reduce wave reflection or increase damping or dissipation of reflected waves in the periphery. In addition, reflected wave transit time reached a nadir in midlife and then increased slightly in older participants. Later reflected wave arrival reduces augmentation because of less overlap with the forward wave (RW/SEP in Figure 2B).
Our observations confirm that amplification, which has been estimated to be as high as 80%, may have been overestimated in prior studies,6;17;18 possibly because those studies calibrated the radial pressure waveform to brachial cuff pressure, which ignores brachial-radial amplification.19 Using direct noninvasive recording and calibration of the carotid and brachial waveforms, apparent amplification between the carotid and brachial arteries declined from a modest maximum (15%) in our youngest group to a negligible (3%) level beyond 50-60 years of age.
Timing of wave reflection
In contrast to a contemporary view,4 timing of wave reflection had relatively limited relations with central and peripheral pulse pressure. Reflected wave arrival in the proximal aorta, as indicated by an inflection point in the carotid waveform, was mid-systolic (not early diastolic) even in our youngest group (<30 years of age). Relatively constrained differences in timing of wave reflection across age decades thereafter contrasted sharply with substantial differences in CFPWV. For example, comparing the <30 versus 50-59 year old age groups, the reflected wave arrived 17% earlier whereas CFPWV was 40% higher. Comparing the 50-59 versus 70+ year old age groups, timing of wave reflection was actually 12% later in the older group even though CFPWV was 83% higher. If CFPWV is a valid surrogate for the average velocity between central aorta and reflecting sites, our observations suggest that the effective location of the dominant reflecting sites was more distal in older participants. The discrepancy between differences in CFPWV and timing of wave reflection across age groups is particularly marked after 50 years of age, when CFPWV reaches and subsequently exceeds muscular artery PWV (CBPWV). We have previously proposed that the associated impedance matching between the stiffened aorta and relatively unchanged muscular arteries reduces the component of wave reflection normally arising at this proximal interface and shifts the effective reflecting site distally.5 Our observation of a reduction in global wave reflection and an increase in reflected wave transit time despite a marked increase in CFPWV after 50 years of age is consistent with this hypothesis.
Characteristic impedance and CFPWV across adulthood
We observed nonlinear and at times divergent differences in characteristic impedance and CFPWV across age groups (Figure 1CD, Table S1). Prior to 50 years of age, characteristic impedance was lower and CFPWV higher with increasing age, whereas after 50 years of age, both variables were comparably higher with advancing age. As suggested previously,16;20 differing age relations for these related measures of aortic function suggest that aortic diameter may be involved. Characteristic impedance and CFPWV are related directly to wall stiffness and inversely to aortic diameter; however, characteristic impedance is markedly (5-fold) more sensitive to diameter. Thus, if wall stiffening is accompanied by a modest increase in diameter, characteristic impedance can fall even as PWV increases, similar to the pattern we found prior to 50 years of age. After 50 years of age, the parallel increase in characteristic impedance and CFPWV across age groups is consistent with an increase in wall stiffness with limited change in diameter. These observations raise the possibility that early increases in aortic diameter may be adaptive rather than pathologic, serving to stabilize pressure pulsatility in the wake of increasing aortic wall stiffness. However, adaptive aortic remodeling may be limited by the presence of vascular risk factors that accumulate with age, leading to parallel increases in CFPWV, characteristic impedance, forward wave amplitude and pulse pressure in older people.
We have defined reference values for a comprehensive family of key noninvasive hemodynamic variables and demonstrated heterogeneous differences in the prevalence of abnormal values for specific components of hemodynamic load in younger and older participants. In younger participants, abnormalities in mean arterial pressure predominate largely because of an increased prevalence of elevated cardiac output. After 50 years of age, when risk for developing hypertension and CVD is high, increased prevalence of elevated aortic impedance to pulsatile flow contributes to higher systolic and pulse pressure. These data underscore a need for interventions that target aortic stiffness and abnormal pulse pressure, particularly in older people. Most available antihypertensive drugs were designed to reduce mean arterial pressure, which changes relatively little (2 mm Hg/decade) during the age range (>50 years) when systolic (10 mm Hg/decade) and pulse pressure (12 mm Hg/decade) increase rapidly and hypertension and CVD become highly prevalent. This dissociation between hemodynamic abnormality and therapeutic effect may contribute to the high failure rate of antihypertensive therapy and the high prevalence of isolated systolic hypertension among treatment failures.21 The changing demographics of our aging society suggest that treatment failures may increase over the next few decades unless interventions effective at reducing or preventing aortic stiffening are developed and implemented.
Study Limitations
A number of potential limitations of our study need to be considered. Since the cohorts were comprised of white participants of European descent, we were unable to assess potential ethnicity-related differences in hemodynamics; thus, our findings may not be generalizable to other races or ethnicities. Our discussion of the relative effects of wall stiffness and diameter on characteristic impedance and PWV pertains to measurement at the same site. CFPWV represents the average properties of the entire aorta and the iliac and femoral arteries. Thus, a component of differing age relations of characteristic impedance, which measures proximal aortic properties, and CFPWV, which assesses the full length of the aorta, may be attributable to differences in distal aortic stiffness rather than proximal aortic diameter. However, prior work has demonstrated far greater age-related alterations in proximal as compared to distal large artery stiffness, making it unlikely that predominant distal stiffening explains our observations.22 The cross-sectional, observational design of our study limits our ability to infer that the observed differences in arterial function in various age groups are related to aging or risk factor accumulation per se. Other historical or generational factors may have contributed to the observed differences among age groups. Prospective studies with repeated assessment of arterial properties over time will be required to define age-related change in arterial function. Our study also has several strengths including a large sample size and routine ascertainment of a comprehensive noninvasive panel of arterial function measures and coexistent CVD risk factors in a community-based sample, which provides excellent power, facilitates adjustment for multiple covariates and limits referral biases. The Framingham cohort will also enable analysis of the relations between hemodynamics and various novel risk factors and biomarkers that are being assessed.
In summary, we have shown that forward wave amplitude, which is determined by characteristic impedance and peak flow in the proximal aorta, is the predominant hemodynamic correlate of pulse pressure across the adult age spectrum and that differences in forward wave amplitude account for an overwhelming majority of the accelerated increase in pulse pressure after midlife. Differences in relative wave reflection contribute modestly to variability in pulse pressure whereas variable timing of wave reflection plays a minimal role. In young adults, abnormalities in mean arterial pressure and cardiac output (steady flow load) have a predominant effect on blood pressure whereas abnormal pulsatile load plays an increasingly important role after 50 years of age. Prospective observational and interventional studies are needed to define mechanisms that contribute to aortic wall stiffening with advancing age and risk factor exposure and to clarify the role of aortic diameter in aortic function.
Supplementary Material
Acknowledgments
From the Framingham Heart Study of the National Heart Lung and Blood Institute of the National Institutes of Health and Boston University School of Medicine.
Funding Sources This work was supported by the National Heart, Lung and Blood Institute’s Framingham Heart Study (Contract No. N01-HC-25195) and by HL076784, AG028321, HL070100, HL060040, HL080124, HL071039, HL077447, 2-K24-HL04334 and a grant from the Donald W. Reynolds Foundation.
Footnotes
Disclosures G.F.M. is owner of Cardiovascular Engineering, Inc, a company that designs and manufactures devices that measure vascular stiffness. The company uses these devices in clinical trials that evaluate the effects of diseases and interventions on vascular stiffness. The remaining authors report no conflicts.
References
- 1.Burt VL, Whelton P, Roccella EJ, Brown C, Cutler JA, Higgins M, Horan MJ, Labarthe D. Prevalence of hypertension in the US adult population. Results from the Third National Health and Nutrition Examination Survey, 1988-1991. Hypertension. 1995;25:305–313. doi: 10.1161/01.hyp.25.3.305. [DOI] [PubMed] [Google Scholar]
- 2.Franklin SS, Gustin W, Wong ND, Larson MG, Weber MA, Kannel WB, Levy D. Hemodynamic patterns of age-related changes in blood pressure. The Framingham Heart Study. Circulation. 1997;96:308–315. doi: 10.1161/01.cir.96.1.308. [DOI] [PubMed] [Google Scholar]
- 3.Folkow B. Physiological aspects of primary hypertension. Physiol Rev. 1982;62:347–504. doi: 10.1152/physrev.1982.62.2.347. [DOI] [PubMed] [Google Scholar]
- 4.O’Rourke MF, Nichols WW. Aortic diameter, aortic stiffness, and wave reflection increase with age and isolated systolic hypertension. Hypertension. 2005;45:652–658. doi: 10.1161/01.HYP.0000153793.84859.b8. [DOI] [PubMed] [Google Scholar]
- 5.Mitchell GF, Parise H, Benjamin EJ, Larson MG, Keyes MJ, Vita JA, Vasan RS, Levy D. Changes in arterial stiffness and wave reflection with advancing age in healthy men and women: the Framingham Heart Study. Hypertension. 2004;43:1239–1245. doi: 10.1161/01.HYP.0000128420.01881.aa. [DOI] [PubMed] [Google Scholar]
- 6.McEniery CM, Yasmin, Hall IR, Qasem A, Wilkinson IB, Cockcroft JR. Normal vascular aging: differential effects on wave reflection and aortic pulse wave velocity: the Anglo-Cardiff Collaborative Trial (ACCT) J Am Coll Cardiol. 2005;46:1753–1760. doi: 10.1016/j.jacc.2005.07.037. [DOI] [PubMed] [Google Scholar]
- 7.Chobanian AV, Bakris GL, Black HR, Cushman WC, Green LA, Izzo JL, Jr, Jones DW, Materson BJ, Oparil S, Wright JT, Jr, Roccella EJ. Seventh report of the Joint National Committee on Prevention, Detection, Evaluation, and Treatment of High Blood Pressure. Hypertension. 2003;42:1206–1252. doi: 10.1161/01.HYP.0000107251.49515.c2. [DOI] [PubMed] [Google Scholar]
- 8.Kannel WB, Feinleib M, McNamara PM, Garrison RJ, Castelli WP. An investigation of coronary heart disease in families. The Framingham offspring study. Am J Epidemiol. 1979;110:281–290. doi: 10.1093/oxfordjournals.aje.a112813. [DOI] [PubMed] [Google Scholar]
- 9.Splansky GL, Corey D, Yang Q, Atwood LD, Cupples LA, Benjamin EJ, D’Agostino RB, Sr, Fox CS, Larson MG, Murabito JM, O’Donnell CJ, Vasan RS, Wolf PA, Levy D. The Third Generation Cohort of the National Heart, Lung, and Blood Institute’s Framingham Heart Study: design, recruitment, and initial examination. Am J Epidemiol. 2007;165:1328–1335. doi: 10.1093/aje/kwm021. [DOI] [PubMed] [Google Scholar]
- 10.Kelly R, Fitchett D. Noninvasive determination of aortic input impedance and external left ventricular power output: a validation and repeatability study of a new technique. J Am Coll Cardiol. 1992;20:952–963. doi: 10.1016/0735-1097(92)90198-v. [DOI] [PubMed] [Google Scholar]
- 11.Mitchell GF, Izzo JL, Jr, Lacourciere Y, Ouellet JP, Neutel J, Qian C, Kerwin LJ, Block AJ, Pfeffer MA. Omapatrilat reduces pulse pressure and proximal aortic stiffness in patients with systolic hypertension: results of the conduit hemodynamics of omapatrilat international research study. Circulation. 2002;105:2955–2961. doi: 10.1161/01.cir.0000020500.77568.3c. [DOI] [PubMed] [Google Scholar]
- 12.Murgo JP, Westerhof N, Giolma JP, Altobelli SA. Aortic input impedance in normal man: relationship to pressure wave forms. Circulation. 1980;62:105–116. doi: 10.1161/01.cir.62.1.105. [DOI] [PubMed] [Google Scholar]
- 13.Mitchell GF, Tardif JC, Arnold JM, Marchiori G, O’Brien TX, Dunlap ME, Pfeffer MA. Pulsatile hemodynamics in congestive heart failure. Hypertension. 2001;38:1433–1439. doi: 10.1161/hy1201.098298. [DOI] [PubMed] [Google Scholar]
- 14.Westerhof N, Sipkema P, Van Den Bos GC, Elzinga G. Forward and backward waves in the arterial system. Cardiovasc Res. 1972;6:648–656. doi: 10.1093/cvr/6.6.648. [DOI] [PubMed] [Google Scholar]
- 15.Liu Z, Brin KP, Yin FC. Estimation of total arterial compliance: an improved method and evaluation of current methods. Am J Physiol. 1986;251:H588–H600. doi: 10.1152/ajpheart.1986.251.3.H588. [DOI] [PubMed] [Google Scholar]
- 16.Mitchell GF, Lacourciere Y, Ouellet JP, Izzo JL, Jr, Neutel J, Kerwin LJ, Block AJ, Pfeffer MA. Determinants of elevated pulse pressure in middle-aged and older subjects with uncomplicated systolic hypertension: the role of proximal aortic diameter and the aortic pressure-flow relationship. Circulation. 2003;108:1592–1598. doi: 10.1161/01.CIR.0000093435.04334.1F. [DOI] [PubMed] [Google Scholar]
- 17.McEniery CM, Yasmin, McDonnell B, Munnery M, Wallace SM, Rowe CV, Cockcroft JR, Wilkinson IB. Central pressure: variability and impact of cardiovascular risk factors: the Anglo-Cardiff Collaborative Trial II. Hypertension. 2008;51:1476–1482. doi: 10.1161/HYPERTENSIONAHA.107.105445. [DOI] [PubMed] [Google Scholar]
- 18.Namasivayam M, McDonnell BJ, McEniery CM, O’Rourke MF. Does wave reflection dominate age-related change in aortic blood pressure across the human life span? Hypertension. 2009;53:979–985. doi: 10.1161/HYPERTENSIONAHA.108.125179. [DOI] [PubMed] [Google Scholar]
- 19.Verbeke F, Segers P, Heireman S, Vanholder R, Verdonck P, Van Bortel LM. Noninvasive assessment of local pulse pressure: importance of brachial-to-radial pressure amplification. Hypertension. 2005;46:244–248. doi: 10.1161/01.HYP.0000166723.07809.7e. [DOI] [PubMed] [Google Scholar]
- 20.Segers P, Rietzschel ER, De Buyzere ML, Vermeersch SJ, De Bacquer D, Van Bortel LM, De Backer G, Gillebert TC, Verdonck PR. Noninvasive (input) impedance, pulse wave velocity, and wave reflection in healthy middle-aged men and women. Hypertension. 2007;49:1248–1255. doi: 10.1161/HYPERTENSIONAHA.106.085480. [DOI] [PubMed] [Google Scholar]
- 21.Franklin SS, Jacobs MJ, Wong ND, L’Italien GJ, Lapuerta P. Predominance of isolated systolic hypertension among middle-aged and elderly US hypertensives: analysis based on National Health and Nutrition Examination Survey (NHANES) III. Hypertension. 2001;37:869–874. doi: 10.1161/01.hyp.37.3.869. [DOI] [PubMed] [Google Scholar]
- 22.Benetos A, Laurent S, Hoeks AP, Boutouyrie PH, Safar ME. Arterial alterations with aging and high blood pressure. A noninvasive study of carotid and femoral arteries. Arterioscler Thromb. 1993;13:90–97. doi: 10.1161/01.atv.13.1.90. [DOI] [PubMed] [Google Scholar]
Associated Data
This section collects any data citations, data availability statements, or supplementary materials included in this article.