

Abstract
Mutations that arise in HIV-1 protease after exposure to various HIV-1 protease inhibitors have proved to be a difficult aspect in the treatment of HIV. Mutations in the binding pocket of the protease can prevent the protease inhibitor from binding to the protein effectively. In the present study, the crystal structures of 68 HIV-1 proteases complexed with one of the nine FDA approved protease inhibitors from the Protein Data Bank (PDB) were analyzed by (a) identifying the mutational changes with the aid of a developed mutation map and (b) correlating the structure of the binding pockets with the complexed inhibitors. The mutations of each crystal structure were identified by comparing the amino acid sequence of each structure against the HIV-1 wild type strain HXB2. These mutations were visually presented in the form of a mutation map to analyze mutation patterns corresponding to each protease inhibitor. The crystal structure mutation patterns of each inhibitor (in vitro) were compared against the mutation patterns observed in in vivo data. The in vitro mutation patterns were found to be representative of most of the major in vivo mutations. We then performed a data mining analysis of the binding pockets from each crystal structure in terms of their chemical descriptors to identify important structural features of the HIV-1 protease protein with respect to the binding conformation of the HIV-1 protease inhibitors. Data mining analysis is performed using several classification techniques: Random Forest (RF), linear discriminant analysis (LDA), and logistic regression (LR). We developed two hybrid models, RF-LDA and RF-LR. Random Forest is used as a feature selection proxy, reducing the descriptor space to a few of the most relevant descriptors determined by the classifier. These descriptors are then used to develop the subsequent LDA, LR, and hierarchical classification models. Clustering analysis of the binding pockets using the selected descriptors used to produce the optimal classification models reveals conformational similarities of the ligands in each cluster. This study provides important information in understanding the structural features of HIV-1 protease which cannot be studied by other existing in vivo genomic datasets.
1 Introduction
The human immunodeficiency virus (HIV) is a retrovirus that can lead to Acquired Immune Deficiency Syndrome (AIDS). In 2008, an estimated 33.4 million people in the world were living with HIV, with two million deaths resulting from AIDS.1 The extensive genetic variation and replicatory dynamics of the virus within human hosts has led to a high mutation rate during the reverse transcriptase process, resulting in drug resistances which frustrate the anti-HIV drug development process.2–4
HIV-1 protease is a major viral target for the development of new chemotherapeutics. Inhibition of HIV-1 protease prevents the virus from maturing into its infectious form. More than half a dozen commercially available drugs are HIV-1 protease inhibitors which are used for the treatment of AIDS. However, mutations arising in HIV-1 protease resulting from the use of current drug regimens is a major pitfall for the efficacy of the drugs. Hence, the quest for the development of new intelligent HIV-1 protease inhibitors tolerable to mutations is still on. This requires a thorough understanding of the various mutation patterns occurring in the HIV-1 protease protein as these mutations may result in binding pocket conformational changes which can affect inhibitor binding. To study mutation patterns of HIV-1 protease, large genomic datasets from clinical DNA sequences have resulted in the development of several HIV mutation databases which are used by researchers to study mutation patterns in HIV proteins.
The two most noteworthy HIV mutation databases are the Stanford HIV Drug Resistance Database5 and the UCLA HIV Positive Selection Mutation Database.6 The Stanford database makes use of genomic datasets to produce mutation frequency information in HIV proteins and infer resistances to various anti-HIV drugs. The UCLA database uses genomic datasets to develop detailed mutation pressure maps in order to study the interrelated mutation selection effects between amino acid positions. In addition to these genomic datasets, the International AIDS Society-USA releases an annual to semi-annual mutation map of HIV resistances to popular clinical drug combinations observed in vivo.7 These mutation maps were designed to understand mutation patterns as a clinical guide for drug treatment.
Mutation patterns inferred from these genomic sequences has led to hundreds of crystallization studies involving HIV-1 protease proteins complexed with various inhibitor molecules, including the FDA approved HIV-1 protease inhibitors, and are analyzed for their physiochemical properties. It would be valuable to study the mutations present in the HIV-1 protease crystal structures reported in the Protein Data Bank (PDB) to identify mutation patterns existing with the complexed inhibitors. In the first part of our study, we analyze HIV-1 protease crystal structures which are complexed to one of the FDA approved HIV-1 protease inhibitors to identify mutation patterns and visually present these mutations in the form of a mutation map. Furthermore, we perform a comparative analysis of the in vitro (crystal structures) mutations with the mutations identified in vivo (genomic datasets).
The mutations present in the HIV-1 protease protein can cause changes in the binding pockets in terms of their geometrical shape and physiochemical properties. In the second part of our study, we investigate the relationship between the HIV-1 protease binding pocket structure in terms of its chemical descriptors with its complexed protease inhibitor. Chemical descriptors computed from the crystal structures of molecules based on their atomic makeup are used for the development of classification models to establish a relationship between the binding pocket structure and complexed inhibitor in terms of their chemical descriptors.
The number of these chemical descriptors can range in the hundreds and usually exceeds the number of samples available. In order to develop robust QSPR based models, optimization of the descriptor space is required.8 Common linear modeling techniques in QSPR, such as multiple linear regression (MLR)9–11 and linear discriminant analysis (LDA),12 require a decreased pool of the most relevant descriptors in order to train high predictive models. Other commonly used nonlinear techniques with high predictive performance in QSPR modeling include artificial neural networks (ANN),8,13,14 decision trees,15 and support vector machines (SVM).13,14 However these techniques are also inefficient in dealing with high dimensional data without dimensionality reduction or feature selection techniques.
Various dimensionality reduction techniques have been used to decrease the number of descriptors and extract the most relevant data in order to construct reliable models.16 Hybrid methods involving genetic algorithms17 and particle swarm optimization18 have been used to tackle the high dimensionality problem by acting as a feature selection proxy prior to training ANN based QSPR models. However, these techniques often require a large sample size to train effective models.
Random Forest is a relatively new technique applied in QSPR modeling. In a chemometrics case study by Svetnik et al., Random Forest was found to be one of the top classification methods, being able to handle high dimensional data while ignoring redundant and irrelevant descriptors.19 Random Forest has a unique feature of measuring feature relevance in its classification models called the variable importance measure. A study by Li et al. has shown that Random Forest's ability to rank chemical descriptors based on their relevance serves as an important feature selection technique prior to training effective SVM-based classification models.20
We evaluated the use of several hybrid classification modeling techniques, Random Forest-LDA and Random Forest-logistic regression (LR), for the classification of HIV-1 protease crystal structures to an FDA approved HIV-1 protease inhibitor. The Random Forest classifier is used as a feature selection proxy which is used to select the most relevant chemical descriptors for the development of LDA and LR based classification models. Model validation of the LDA and LR models is performed by a cross validation scheme. Hierarchical clustering also used to classify the HIV-1 protease proteins with the subset of descriptors used to develop the most optimal LDA and LR models. The results from these classification models support each other with few deviations. This study captures the conformational changes of the HIV-1 protease binding pockets due to both the mutations present in the structure and the protein-ligand interactions in terms of a few quantitative descriptors. These descriptors will provide insight for the design of new inhibitor molecules.
2 Methods
In this two part study, we first study the mutation patterns of the HIV-1 protease crystal structures by developing a mutation map (Figure 1). Secondly, we perform data mining analysis on the chemical descriptors calculated from the binding pocket structures of these crystal structures through the use of classification models and hierarchical clustering to correlate the structural features of the HIV-1 binding pocket with its complexed ligands (Figure 2).
Figure 1.
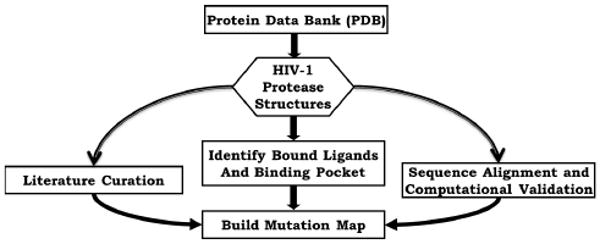
HIV-1 protease mutation map development scheme. HIV-1 protease crystal structures complexed with one of the nine FDA approved protease inhibitors are selected and verified through the literature. Each qualified HIV-1 protease crystal structure then has the binding pocket identified and its amino acid sequence aligned against the HXB2 sequence (most commonly used laboratory viral sequence in HIV-1 mutation studies).21 The mutations are then aggregated by ligand to build the mutation map.
Figure 2.

Flowchart of the classification model development scheme.
2.1 Dataset
The PDB was searched for all HIV-1 protease crystal structures complexed with an FDA approved protease inhibitor.22 The PDB is a crystal structure repository database for large biological macromolecules and provides information regarding the experimental method used to obtain the crystal structure, the molecule class, fragment description, any ligands complexed with the biological molecules, and any amino acid residue mutations that exist within the structure.
The structures were selected based on the molecular classification and fragment descriptions provided by the PDB entry. Of the approximately 200 HIV protease crystal structures deposited in the PDB (Figure 3), a total of 68 crystal structures were found to be HIV-1 complexed with one of the nine FDA approved protease inhibitors (Table 1): Darunavir (017), Nelfinavir (1UN), Amprenavir (478), Lopinavir (AB1), Atazanavir (DR7), Indinavir (MK1), Ritonavir (RIT), Saquinavir (ROC), and Tipranavir (TPV).
Figure 3.
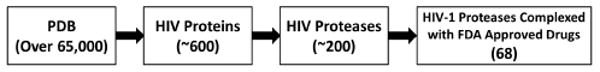
HIV-1 protease statistics from the Protein Data Bank (PDB) repository.
Table 1.
Number of HIV-1 Protease PDB crystal structures complexed with an FDA approved protease inhibitor.
| PDB-ID | Inhibitor Name | Number of Structures |
|---|---|---|
| 017 | Darunavir | 14 |
| 1UN | Nelfinavir | 7 |
| 478 | Amprenavir | 2 |
| AB1 | Lopinavir | 8 |
| DR7 | Atazanavir | 4 |
| MK1 | Indinavir | 13 |
| RIT | Ritonavir | 5 |
| ROC | Saquinavir | 10 |
| TPV | Tipranavir | 5 |
During our research on the PDB crystal structures of HIV-1 protease, the molecular classification for some of the structures were found to be inconsistent. We noticed that the molecular classification varied widely from “pol protein” to “ASPARTYLPROTEASE”, in addition to inconsistencies in the fragment description, which varied from a correct description of “Protease” to an inconsistent residue numbering with “57-155”, “69-167”, and “500-598” as possible entries in the database. We also observed that some crystal structures were given an incorrect classification of “Gag-Pol polyprotein (Pr160Gag-Pol)” with no fragment description, which would imply that the crystal structure is the Gag-Pol precursor polyprotein which, if cleaved, would produce the following mature proteins: the matrix, capsid, p2, nucleocapsid, transframe protein, protease, reverse transcriptase, and integrase.23 Furthermore, we found that the crystal structure of PDB-ID 1HSH was reported to be HIV-1 protease when it was in fact a crystal structure of HIV-2 protease.
To create our dataset, we addressed these inconsistencies by searching for all structures complexed with the specific inhibitor of interest and using verification methods such as sequence alignment (discussed later in this section) and literature verification to validate that each crystal structure is indeed HIV-1 protease. All of the PDB queried HIV-1 protease proteins complexed with one of the nine FDA approved protease inhibitors used in our dataset with their molecular classification, fragment description, and reported mutations are provided in Supplementary Table S1.
2.2 Mutation Map Development
2.2.1 Sequence Alignment
All protein sequences in our dataset (Supplementary Table S1) were aligned and compared against a base strain sequence to verify the structure and eliminate the inconsistencies as discussed earlier. We used the HXB2 sequence as it was proposed by researchers at the Los Alamos National Laboratory to address a similar kind of variation in HIV DNA and protein sequences in the HIV literature.24 HXB2 is also one of the most commonly used laboratory viral sequences in HIV-1 mutation studies.21 An example of sequence alignment between the PDB-ID 1T7J protein and HXB2 is shown in Figure 4. The amino acid differences between the two sequences are identified as mutations. Supplementary Table S2 lists the mutations in each crystal structure after alignment with the HXB2 amino acid sequence. The mutation list is then adjusted to take into account for crystallized mutations which is discussed in the next section.
Figure 4.

Sequence alignment example. Comparison of PDB-ID 1T7J and the HXB2 protein sequence. Amino acid differences are identified (underlined) which is then compared against the list of crystallized mutations. Any mutations found in the list of artificial mutations required for viable crystal structures (Q7K) are then removed to obtain the final list of mutations for 1T7J.
2.2.2 Mutation Map
Amino acid mutations occurring in the binding pocket results in conformational changes and have the most direct effect on the binding affinity of the HIV-1 protease protein towards a specific inhibitor.25 Hence it becomes significant to highlight the mutations occurring in the binding pocket. We define the binding pocket as the set of amino acid residues within a six angstrom radius of the complexed inhibitor as non-covalent interactions found within this distance, such as cation-π and π-π interactions, are important in the protein-ligand binding recognition process.26–30 The amino acid makeup of the binding pocket was determined using the PyMOL Molecular Viewer.31 In the development of the mutation map, we consider all the mutations based on sequence alignment and whether these mutations are found within the binding pocket (Figure 1). In the mutation map, we have grouped all the mutations across all the crystal structures by ligand.
Some mutations reported in the PDB are artificially created due to necessary experimental conditions to produce viable crystal structures. We call these mutations crystallized mutations. From the corresponding literature associated with each of the crystal structures, we determined that the following three types of mutations are introduced into the crystal structure for a variety of experimental necessities: the Q7K, L33I, and L63I mutations are created to minimize autoproteolysis,32 the C67A and C95A mutations are to prevent cysteine-thiol oxidation,32 and the D25N mutation allows for the study of inhibitor binding without interference of the cleavage reaction by the protease.33 While the Q7K, L33I, L63I, C67A, and C95A mutations are often necessary to create crystal structures of HIV-1 protease, the kinetic parameters are indistinguishable from their native enzyme which makes these crystal structures viable for research.34 Although D25 is a member of the catalytic triad in the active site of HIV-1 protease, a study by Sayer et al. reveals that the D25N mutant results in very subtle structural differences from the wild type at the active site and dimer-interface geometry, however binding Darunavir with the mutant results in a less favorable binding constant.35 We assumed that as we are only interested in the structure of the protease to obtain information on the amino acid positions which define the binding pocket, these subtle structural differences would not affect the binding pocket extraction. Thus in the development of the mutation map, we have discounted these necessary experimental mutations from the individual ligand mutation maps. This final mutation map is shown in Figure 5.
Figure 5.

HIV-1 protease crystal structures mutation map.
α While most amino acid residues within the binding pocket when mutated still lie within the binding pocket, the M46L mutation of Lopinavir and I54V of Saquinavir lie outside the binding pocket.
2.3 Data Mining Analysis
2.3.1 Chemical Descriptor Calculations
Chemical descriptors are quantitative measurements derived from chemical structures which describe its physiochemical and structural properties. To compute the quantum-chemical descriptors of the binding pocket, calculations of the molecular electronic structure must be computed. The Austin Model 1 (AM1) energy calculation of each pocket structure using the atomic coordinates of the crystal structure was computed using AMPAC.36 A set of 562 constitutional, geometrical, electrostatic, topological, and quantum-chemical descriptors were derived from the binding pocket structures and their AM1 energy calculations using Codessa.37 To reduce the descriptor space, we eliminated any descriptors with null or constant values across the majority of the samples. Null values occur because the descriptor is specific for atoms which are not present in the structure. This resulted in a total of 456 descriptors in the dataset. All descriptor values were recentered to have a zero mean and a standard deviation of one.
If multiple ligands were found to be complexed in the crystal structure, then multiple binding pockets will be extracted from the structure. The PDB structures 1N49, 2AVV, 2R5P, and 2R5Q each had two ligands complexed in the binding pocket region and as such have two binding pockets used in this classification study. The extracted binding pocket structures have also been checked for completeness; HIV-1 protease is a dimer structure which cleaves the nascent polypeptide at the dimer interface and is the target site of HIV-1 protease inhibitors.38 Thus any pocket structures which do not contain atoms from both dimers were eliminated from the dataset; PDB-ID 1FB7 was eliminated for not meeting this criterion. In addition, PDB-ID 1RV7 was eliminated from the dataset as the chemical descriptors were not successfully computed for the structure. This quality assurance check resulted in a total of 70 binding pocket structures in the dataset.
2.3.2 Descriptor Selection
Random Forest is a decision tree based ensemble learning technique which consists of a collection of unpruned trees used collectively to determine the output for a given observation.39 Ensemble learners utilize multiple models in combination which may result in an improved predictive model over a standalone model. A Random Forest classification model is a collection of classification tree predictors
where Θk are independent identically distributed random vectors which each cast a vote for a class for a given input vector x.39 For each tree, a bootstrap sampling of the dataset is selected as the training set for the model building process. In the tree growing steps of Random Forest, a small random sampling of the variables are considered for each nodal split. Each of the classification tree models are grown fully without pruning as to keep bias at a minimum. Bootstrap sampling of the observations and random variable sampling ensures no two trees are identical. The Gini measure of impurity is used to determine the variable selected to make the nodal split. The Gini impurity measure at node t is defined as
where i and j are the outcome categories for the variable. The subsequent Gini criterion for determining a split with variable s at node t is defined as
where pL and pR are the proportion of observations in t in the left and right child nodes respectively. The variable s which maximizes Φ(s, t) is selected for the nodal split.
In the statistical computing environment R,40 there are two major parameters used to train the Random Forest classifier model: nTree, the number of classification trees to train, and mtry, the number of variables to randomly consider at each node of each tree. In R, 63.2% of the observations in the dataset are selected by bootstrap sampling for model building with the remainder used as a test set to measure the performance of the trained tree. As each classification tree is built, an estimate of the Random Forest classifier performance is measured, called the Out-of-Bag (OOB) error. The OOB error is the misclassification measurement of all of the trained classification trees in the Random Forest model using the non-selected bootstrapped samples as the test set.
Random Forest includes an implicit measure of variable importance when determining classification which is obtained by two quantitative measurements, the Gini importance and the mean decrease in accuracy measurements.41 The Gini importance measures the improvement of each variable in the Gini criterion selected to split at each classification tree node. In R, the Gini importance measure is referred to as the mean decrease in Gini. As each split occurs during the tree growing process, the Gini impurity measure decreases. The mean decrease in Gini for each variable is computed by measuring the sum of decreases in the Gini impurity measure divided by the number of trees in the Random Forest model. The variables with the largest decrease in the Gini impurity measure are deemed the most significant. The mean decrease in accuracy measurement involves measuring the error of a trained classifier by randomly permuting a variable's values. The mean decrease in accuracy measure for each variable is defined as
where ROOB is the OOB error at each tree in the model with the full dataset, and RPerm is the OOB error at each tree for the full dataset with permuted values for the variable i; The mean decrease in accuracy of the variable i is the average difference between the OOB error of the full dataset and the full dataset with the permuted variable over all the trees.19 A significant decrease in the performance of the Random Forest classifier as a result of permuting the values of i signifies its importance in the classification model. This combination of a classifier tool with an implicit variable relevance measurement makes Random Forest a highly desirable technique for use as a standalone classifier or in conjunction with other classification techniques as a preprocessing filter to develop improved models.
Random Forest is used to classify each of the 70 HIV-1 protease binding pockets to one of the nine FDA approved HIV-1 protease inhibitors in order to determine an optimal subset of descriptors to be used in other classification modeling techniques more suitable for small datasets. For the determination of the optimal tree size with the lowest OOB error, a Random Forest classifier is trained with parameters nTree = 20000 and the default parameter of mtry. The default parameter of mtry in a Random Forest classifier is equal to the square root of the number of variables available. In R, as each tree is generated in a single Random Forest model, the OOB error is computed, enabling the determination of the optimal tree size. 40,000 Random Forest models were generated from which the average OOB error is determined at each tree size. The optimal value of mtry at the optimal nTree value is determined by the minimum average OOB error from a simulation of 10 Random Forest models at each mtry value from 1 to 456.
A final Random Forest model is generated with the optimal nTree and mtry parameters. A list of variables deemed to be the most important set of chemical descriptors in building the classifier is determined by the mean decrease in Gini and the mean decrease in accuracy criteria.
2.4 Classification Modeling
LDA is a statistical technique used to determine a linear combination of features that best separates multiple classes of objects, whereas LR predicts the class of an object by assuming a logistic relationship exists between the probability of class membership and its variables.42 A thorough discussion of LDA and LR in the context of QSPR modeling is provided by Worth and Cronin.43 The MATLAB implementation of Fisher's discriminant analysis and nominal multinomial LR was used to develop the LDA and LR models respectively.44 Hierarchical clustering is a partitioning method which uses similarity measures to cluster objects into optimal homogeneous groups.45,46 The R implementation of hierarchical clustering was used to perform the clustering analysis.
To determine the optimal model for LDA and LR, we used recursive elimination on the top group of descriptors as determined by the Random Forest variable importance measure. For model evaluation, cross validation was used as a strategy for estimating model performance when exposed to unseen data.47 Due to the small nature of the dataset, leave-one-out cross validation was used.
Hierarchical clustering of the binding pockets is performed with the optimal subsets of descriptors as determined by the LDA and LR model performance. It is expected that a good set of descriptors would have each of the binding pockets clustered together by their complexed ligands. Several combinations of distance metrics and hierarchical clustering linkage methods in R were computed on the set of descriptors determined by the optimal LDA and LR classification models. The Pearson correlation distance metric with the Ward linkage method was observed to produce the best groupings of the data points, whereas the data appeared to be grouped randomly with the other methods. The Pearson distance metric between two data samples xi and xj for a given variable k is defined by one minus the Pearson correlation coefficient:
The Ward linkage method produces a hierarchical tree which form clusters such that the sum of squares error of the distance matrix is at a minimum between each cluster. A detailed explanation of the algorithm is provided by Ward.48
3 Results and Discussion
3.1 Mutation Map Development
3.1.1 Mutation Map Analysis
Mutations at the 82nd and 84th positions are well known binding pocket mutations associated with HIV-1 protease inhibitors. In depth analysis of our mutation map (Figure 5) shows that all inhibitors have at least one crystal structure with a mutation at the 82nd position (V82A, V82F, V82L, and V82T) and the I84V mutation, except for Nelfinavir for which no crystal structures were studied with an amino acid mutation at those two positions. Besides these two mutations, several other binding pocket mutations were found to be unique to specific inhibitors. Atazanavir was found to have the unique binding pocket mutation L10I, Indinavir with I54V, and Saquinavir with I54M. Lopinavir was found to have mutations at the 47th position unique to itself with the I47A and I47V mutations. In general, all amino acid mutations at a position collectively lie either inside or outside the binding pocket. However, for Lopinavir, although the M46V mutation resides inside the binding pocket, the M46L mutation does not. Similarly, for Saquinavir, the I54M mutation resides inside the binding pocket, whereas the I54V mutation does not. While most of the crystal structures are missense mutation studies, one crystal structure, PDB-ID 2RKG, studied the effects of a frameshift mutation with Lopinavir, an insertion mutation E35EE where an extra glutamate is inserted after the 35th position.49
Further analysis of the mutation map did find the crystallographic D25N mutation to reside within the binding pocket of crystal structures complexed with Darunavir, which could explain the less favorable binding constant observed in the study by Sayer et al. due to physiochemical changes as a result of the amino acid substitution.35 It was also found that D25N resides within the binding pocket of crystal structures complexed with Ritonavir and Lopinavir.
The binding pocket of HIV-1 protease is known to be hydrophobic in nature,50 which is observed by the hydrophobic residues of the wild type sequence. Many hydrophobicity scales for amino acid residues have been developed.51 For our analysis of the hydrophobic changes in the binding pockets due to mutations, we use the hydrophobicity scale developed by Rose et al. which describes the hydrophobic nature of amino acid residues in globular proteins.52 In general, the hydrophobic residues are mutated to a different hydrophobic residue. A common interchange occurs between isoleucine and valine, which is observed at the 13th, 32nd, 47th, 50th, 54th, 64th, and 84th positions. Mutations at the 82nd position trend towards residues of a less hydrophobic nature, whereas mutations at other positions trend towards residues of a more hydrophobic nature as observed at the 10th, 46th, and 48th positions. Thus, we believe these trends in hydrophobic residue exchanges maintain a level of hydrophobicity necessary to retain protease function while consequently affecting the binding pocket shape which determines whether a protease inhibitor can bind to the active site with ease. The changes in the hydrophobic nature of the binding pockets may lead to a decrease in the binding affinity of currently existing HIV-1 protease inhibitors, thus a new complimentary inhibitor molecule suited for the new hydrophobic environment would be needed for inhibition.
3.1.2 In vivo and in vitro Mutations Comparison
Binding pocket mutations have the most direct effect on the binding affinity of the HIV protein towards an inhibitor.25 The International AIDS Society-USA classifies mutations considered to be major as those shown to arise first in the presence of the drug or play a significant role in binding inhibition.7 To draw a comparison of the mutations between the in vivo genomic datasets and the in vitro crystal structures, we used the December 2008 in vivo mutation map developed by the International AIDS Society-USA.7 We compared the major mutations of each drug combination in the in vivo mutation map with the binding pocket mutations of the crystal structures by combining the mutation maps of the crystal structures by each drug combination and compared the binding pocket mutations collectively with the in vivo major mutations.
We have used the information obtained from the Amprenavir crystal structures to represent Fosamprenavir in this comparison study. Fosamprenavir is the prodrug of Amprenavir, which when orally administered is hydrolyzed in the gut epithelium of the body into Amprenavir.53 The NEAT clinical study in which antiretroviral therapy naïve patients were administered unboosted Fosamprenavir were found to have the same mutation profile as previous studies with Amprenavir.54 In Table 2, we present the in vivo data and the combined inhibitor binding pocket mutations.
Table 2.
In vivo and in vitro comparison of binding pocket mutations of FDA approved HIV-1 protease drug combinations.
| Drug Combination | Major Mutations | Binding Pocket Mutations |
|---|---|---|
| Atazanavir/Ritonavir | I50L, I84V, N88S | L10I, V32I, V82A, V82F, I84V |
| Darunavir/Ritonavir | I50V, I54L, I54Mα, I76V, I84V | D30N, V32I, M46L, I50V, V82A, V82T, I84V |
| Fosamprenavir/Ritonavir | I50V, I84V | V32I, V82A, V82T, I84V |
| Indinavir/Ritonavir | M46Iα, M46L, V82A, V82F, V82T, I84V | V32I, I50V, I54V, V82A, V82T, I84V |
| Lopinavir/Ritonavir | V32I, I47A, I47V, V82A, V82F, V82T, V82S | V32I, M46V, I47A, I47V, V82A, V82T, I84V |
| Nelfinavir | D30N, L90Mα | D30N |
| Saquinavir/Ritonavir | G48V, L90Mα | V32I, G48V, I50V, I54M, V82A, V82T, I84V |
| Tipranavir/Ritonavir | L33Fα, I47V, Q58E, T74P, V82L, V82T, I84V | V32I, I50V, V82F, V82L, I84V |
Amino acid mutations shown in bold are located in both the binding pocket of the crystal structures and found to be major mutations arising in clinical studies as described by the International AIDS Society-USA.7
Mutations identified as major by the International AIDS Society-USA which are not located in the binding pockets of the crystal structures, but exist in at least one crystal structure.
Of the in vivo drug combinations, the most important observations are that the following major mutations are represented by at least one crystal structure:
Ataznavir/Ritionavir has the I84V mutation,
Darunavir/Ritionavir has the I50V and I84V mutations,
Fosamprenavir/Ritonavir has the I84V mutation,
Indinavir/Ritonavir has the V82A, V82T, and I84V mutations,
Lopinavir/Ritonavir has the V32I, I47A, I47V, V82A, and V82T mutations,
Nelfinavir has the D30N mutation,
Saquinavir/Ritonavir has the G48V mutation,
Tipranavir/Ritonavir has the V82L and I84V mutations.
We also observed that several of the in vivo major mutations not found in the binding pockets of the crystal structures but found in at least one crystal structure are the I54M mutation of Darunavir/Ritonavir, M46I of Indinavir/Ritonavir, L90M of Nelfinavir and Saquianvir/Ritonavir, and L33F of Tipranavir/Ritonavir.
Comparison of the full list of major mutations listed in Table 2 with the mutation map in Figure 5 shows that the I50L and N88S mutation of Atazanavir/Ritonavir, I54L and I76V of Darunavir/Ritonavir, M46L and V82F of Indinavir/Ritonavir, V82F and V82S of Lopinavir/Ritonavir, and I47V, Q58E, T74P, and V82T of Tipranavir/Ritonavir are not represented by any crystal structure.
3.2 Data Mining Analysis
3.2.1 Descriptor Selection
In our Random Forest simulations, we determined the optimal parameters for nTree, the number of trees in the model, and mtry, the number of variables to randomly consider for splitting at each tree node. From the simulation of 40,000 Random Forest models, each of the classification trees were built using a default parameter of . In Figure 6a, we observe the behavior of the Random Forest algorithm on the dataset to converge quickly towards an error of 40%. The optimal tree size with the minimum error was determined to be at nTree = 10586 with an average OOB error of 40.113%. Next, the optimal mtry parameter was determined. Ten Random Forest models were generated using nTree = 10586 at each varying value of mtry from 1 to 456. In Figure 6b, we observe the performance of Random Forest is sensitive to the value of mtry, with the minimal average OOB error occurring near the default value of mtry. Although the OOB error converges relatively quickly, we observed it was less likely for the top ranked descriptors to deviate as more classification trees were introduced. This indicates that a large tree size stabilizes the ranking of the top group of descriptors that best influence the classification ability of the Random Forest model.
Figure 6.
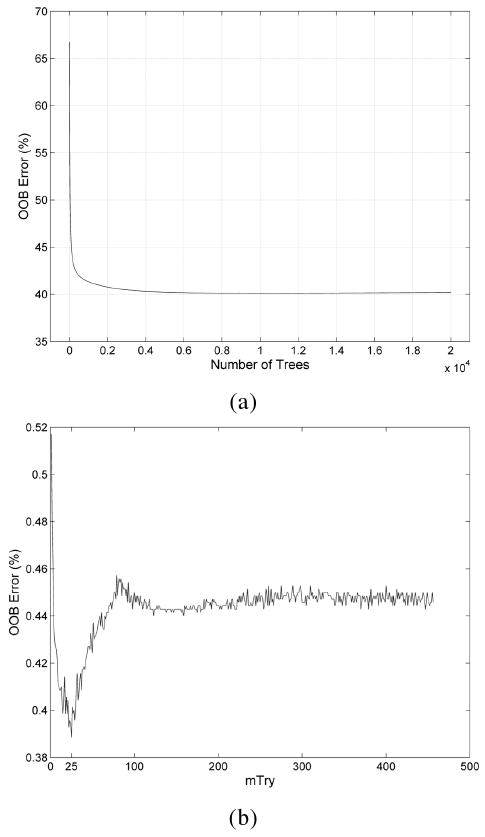
Random Forest simulation results. (a) The average Out-of-Bag (OOB) error for each tree size in a simulation of 20,000 trees over 40,000 runs for the determination of the optimal tree size (nTree). The optimal tree size is nTree = 10586 with an average OOB error of 40.113%. (b) The average OOB error for each value of mtry in a simulation of 10586 classification trees over 10 runs for the optimal mtry determination. The optimal value of mtry with the smallest OOB error occurs near the default parameter of mtry = 21.
A final Random Forest model was generated using the parameters nTree = 10586 and mtry = 21. The list of the most importance descriptors determined by the mean decrease in accuracy and the mean decrease in Gini measurement of this model is shown in Figure 7. Here, we observe that most of the top group of descriptors in the mean decrease in accuracy plot are also the top group in the mean decrease in Gini plot. Based on the natural break in the elbow curve of the mean decrease in Gini plot, the top 12 descriptors are used to generate the LDA and LR classification models (Table 3).
Figure 7.

Variable importance measure of the optimal Random Forest classifier using the (a) mean decrease in accuracy and (b) mean decrease in Gini importance measurements. Due to the natural break in the curve, the top 12 descriptors determined by the mean decrease in Gini importance measure have been considered to determine the final optimal set of descriptors to be used in classification modeling.
Table 3.
Top 12 descriptors as selected by the Random Forest mean decrease in Gini importance measurement.
| Rank | Descriptor | Category |
|---|---|---|
| 1 | exch. eng. + e-e rep. for a C-N bond | Quantum-Chemical |
| 2 | Max resonance energy for a C-C bond | Quantum-Chemical |
| 3 | Molecular volume / XYZ Box | Geometrical |
| 4 | Min (>0.1) bond order of a C atom | Quantum-Chemical |
| 5 | Max total interaction for a C-C bond | Quantum-Chemical |
| 6 | Relative number of benzene rings | Constitutional |
| 7 | Average Information content (order 1) | Topological |
| 8 | exch. eng. + e-e rep. for a C-C bond | Quantum-Chemical |
| 9 | Max e-n attraction for a C-N bond | Quantum-Chemical |
| 10 | Relative number of C atoms | Constitutional |
| 11 | YZ Shadow/YZ Rectangle | Geometrical |
| 12 | Number of benzene rings | Constitutional |
3.2.2 Classification Modeling
The LDA and LR models were trained using the full dataset and evaluated for their predictive ability using leave-one-out cross validation (LOO-CV). Cross validation is used to ensure a model is not being overfitted to the dataset. The desired model is one whose apparent error and cross validated error difference is smallest regardless of error percentage.55 The optimal descriptor set was determined to be the top eight descriptors for the LDA model (Table 4) and the top five descriptors for the LR model (Table 5). For the optimal LDA model, using the top eight descriptors resulted in correctly classifying 49 of the 70 (70% correct classification rate) binding pockets in the full model, while correctly classifying 39 of the 70 binding pockets when using LOO-CV. For the optimal LR model, using the top five descriptors resulted in correctly classifying 50 of the 70 (71.429% correct classification rate) binding pockets in the full model, while correctly classifying 41 of the 70 binding pockets when using LOO-CV. These two models were considered optimal due to the low error delta between the full model and LOO-CV performances while maintaining a high predictive performance. While LDA and LR have similar classification performances, the LR model has a slightly lower overall misclassification error and cross validation misclassification error.
Table 4.
Performance of linear discriminant analysis models by recursive elimination of descriptors.
| Top Descriptors | Full Model | LOO-CV | Delta |
|---|---|---|---|
| 12 | 53/70 (0.75714) | 36/70 (0.51429) | 0.24286 |
| 11 | 52/70 (0.74286) | 36/70 (0.51429) | 0.22857 |
| 10 | 50/70 (0.71429) | 35/70 (0.5) | 0.21429 |
| 9 | 50/70 (0.71429) | 38/70 (0.54286) | 0.17143 |
| 8a | 49/70 (0.7) | 39/70 (0.55714) | 0.14286 |
| 7 | 48/70 (0.6851) | 39/70 (0.55714) | 0.12857 |
| 6 | 46/70 (0.65714) | 34/70 (0.48571) | 0.17143 |
| 5 | 44/70 (0.62857) | 33/70 (0.47143) | 0.15714 |
| 4 | 45/70 (0.64286) | 36/70 (0.51429) | 0.12857 |
| 3 | 43/70 (0.61429) | 37/70 (0.52857) | 0.085714 |
| 2 | 34/70 (0.48571) | 31/70 (0.44286) | 0.042857 |
The model utilizing the top eight descriptors is considered to be the optimal model with its overall performance and predictability performance relative to the other 10 models.
Table 5.
Performance of logistic regression models by recursive elimination of descriptors.
| Top Descriptors | Full Model | LOO-CV | Delta |
|---|---|---|---|
| 12 | 69/70 (0.98571) | 33/70 (0.47143) | 0.51429 |
| 11 | 64/70 (0.91429) | 33/70 (0.47143) | 0.44286 |
| 10 | 60/70 (0.85714) | 34/70 (0.48571) | 0.37143 |
| 9 | 55/70 (0.78571) | 32/70 (0.45714) | 0.32857 |
| 8 | 54/70 (0.77143) | 31/70 (0.44286) | 0.32857 |
| 7 | 51/70 (0.72957) | 35/70 (0.5) | 0.22857 |
| 6 | 52/70 (0.74296) | 38/70 (0.54286) | 0.2 |
| 5a | 50/70 (0.71429) | 41/70 (0.58571) | 0.12857 |
| 4 | 49/70 (0.7) | 40/70 (0.57143) | 0.12857 |
| 3 | 46/70 (0.65714) | 37/70 (0.52857) | 0.12857 |
| 2 | 37/70 (0.52857) | 32/70 (0.45714) | 0.071429 |
The model utilizing the top five descriptors is considered to be the optimal model with its low overfitting effects and good predictability based on leave-one-out cross validation.
Confusion matrices were developed to compare the model performances of each classification method. In Figure 8, each column of the confusion matrix represents the predicted class, whereas each row represents the actual class. This matrix provides information regarding the correct and incorrect predictions of each model. Assessing the confusion matrices of the three classification models (Figure 8), we observe that LR focuses its classification on small and large sample sizes, whereas LDA performs better than LR on mid-sized samples. In comparison with LDA and LR, the training of Random Forest is biased towards the large sample sizes, completely misclassifying the two ligands with the smallest sample sizes, Amprenavir (478) and Atazanavir (DR7). We also observed that LR is a more balanced classifier compared to Random Forest and LDA as every ligand is correctly classified at least once.
Figure 8.

Confusion matrices for the (a) Random Forest model with parameters nTree = 10586, mtry = 21, (b) linear discriminant analysis model using the top eight descriptors, and (c) logistic regression model using the top five descriptors.
Hierarchical clustering of the binding pockets with the top five and top eight descriptors was performed (Figure 9). The Pearson distance metric with the Ward agglomerative method was found to produce the best clustering result with which many of the binding pockets are clustered together by their complexed ligands. As expected, the ligands which have very few samples would not be clustered well, whereas the ligands with the most samples, Indinavir (MK1) and Darunavir (017), are within close proximity with one another. Both hierarchical trees showed similar groupings of the binding pockets. We observed that the ligands were primarily grouped into one of the first two branches. If we consider only two groups of ligands: DR7, MK1, and ROC would belong to cluster one; whereas 017, 1UN, 478, AB1, RIT, and TPV would belong to cluster two.
Figure 9.

Hierarchical clustering of the binding pockets with the (a) top five descriptors and (b) top eight descriptors. The Pearson distance metric with the Ward agglomerative method was used to produce the dendrograms.
We analyzed the binding conformation of each of the ligands by extracting the ligand structures from the crystal structures. For each ligand class, we selected one crystal structure to represent the general binding conformation. For each selected structure, we performed structure alignment using PyMOL. The following PDB crystal structures were used to represent each class of ligands: 1T3R (017), 1OHR (1UN), 1HPV (478), 2Q5K (AB1), 2FXD (DR7), 2AVO (MK1), 1HXW (RIT), 2NNP (ROC), and 2O4N (TPV). We superimposed the ligand structures in each of the clusters and observed they all had similar conformation poses within their individual clusters, with the exception of Ritonavir (RIT) and Tipranavir (TPV) in cluster two (Figure 10). Ritonavir, while being grouped into cluster two, appeared to have a conformational pose which closely matches the conformation of Saquinavir in cluster one. Tipranavir, although designated in cluster two, was observed to fill the space occupied by both cluster one and two.
Figure 10.

Superimposed ligand structures. (a) DR7, MK1, and ROC of cluster one. (b) 017, 1UN, 478, and AB1 of cluster two. (c) RIT (green) superimposed with 017, 1UN, 478, and AB1 of cluster two (red). (d) RIT (green) superimposed with ROC (red). (e) TPV (blue) superimposed with DR7, MK1, and ROC of cluster one (red) and 017, 1UN, 478, and AB1 of cluster two (green).
3.2.3 Chemical Descriptor Interpretations
The top 12 ranked descriptors as determined by the Random Forest variable importance measure (Table 3) are exchange energy + electron-electron repulsion for a C-N bond, max resonance energy for a C-C bond, molecular volume/XYZ box, min >0.1 bond order of a C atom, max total interaction for a C-C bond, relative number of benzene rings, average information content (order 1), exchange energy + electron-electron repulsion for a C-C bond, maximum electron-nuclear attraction for a C-N bond, relative number of C atoms, YZ Shadow/YZ rectangle, and the number of benzene rings.
The physical shape of the binding pocket is emphasized by the geometrical descriptors YZ Shadow/YZ rectangle and molecular volume/XYZ box. The atomic connectivity of the binding pocket is described by the topological descriptor average information content.
The HIV-1 protease active site is known to be hydrophobic in nature and thus protease inhibitors with hydrophobic side chains have a higher binding affinity.50 The hydrophobic binding site may be reflected by the two number of benzene rings descriptors as three of the amino acid residues with a hydrophobic side chain contain an aromatic ring (phenylalanine, tryptophan, and tyrosine). Analysis of the mutation map in Figure 5 reveals that none of the wild type amino acid residues in the binding pocket are phenylalanine, tryptophan, or tyrosine; and most are not mutated to either of these three amino acids. Among the binding pocket mutations, most of the mutations involving a hydrophobic amino acid in the wild type sequence are often replaced by another hydrophobic amino acid. In the case of the 82nd and 84th positions which have valine and isoleucine respectively as the wild type amino acid, based on the hydrophobicity scale by Rose et al.,52 these two amino acid residues are among the most hydrophobic and are being replaced by amino acids which are less hydrophobic with the exception of the V82F mutation in Atazanavir and Tipranavir where phenylalanine is considered to be more hydrophobic than valine.
The quantum-chemical descriptors reveals interactions between C-C and C-N atoms play a role in the binding pocket structure. The exchange energy + electron-electron repulsion descriptors signify that non-covalent London-van der Waals interactions with these atoms play a role in the ligand's ability to bind to the active site. The max resonance energy for a C-C bond descriptor reveals that the presence of benzene rings also play a major role in the protein-ligand binding process. These few selected quantitative descriptors captures the conformational changes of the HIV-1 protease binding pockets due to the mutations and the protein-ligand interactions at the geometric and atomic interaction level which can provide insight for the design of new inhibitor molecules.
4 Conclusions
There are a sufficient number of crystal structures in the PDB to represent most of the identified major in vivo mutations. It is important to study crystal structures as they are the basis of understanding the structural features of HIV-1 protease. The present study concerns the mutations in the HIV-1 protease crystal structures reported in PDB complexed to an FDA approved protease inhibitor.
In the first part of this study, we have shown how combining in vivo with in vitro mutation information of HIV-1 protease crystal structures provides useful information to drive the HIV drug discovery and design process. The mutations in each of the HIV protease crystal structures were identified by aligning the amino acid sequence against a standard strain, HXB2. We identified the mutations in the binding pocket and compared them with the identified major mutations of in vivo data as mutations in the binding pocket have been reported to have the most direct effect on the proteins' binding affinity towards a particular drug.25 It has been observed that although there appears to be some major differences between the identified major in vivo mutations and the binding pocket mutations of the crystal structures, most of these major mutations seem to have no direct effect in the binding mechanism of the drug combinations with HIV-1 protease as they do not reside in the active site. In addition, most of the identified major mutations are represented by at least one PDB crystal structure. Analysis of the mutation patterns in the binding pocket region reveals the tendency of the virus to maintain a hydrophobic active site.
In the second part of this study, we have utilized crystal structures to construct QSPR classification models to understand the binding conformational mode of the HIV-1 protease protein with their respective complexed ligands. We have applied several machine learning methods to build an appropriate classification model for predicting complexed HIV-1 protease binding pocket structures to one of the nine FDA approved HIV-1 protease inhibitors. Based on the results of the LR classification model, Random Forest has performed proficiently in selecting relevant descriptors for classification modeling. Out of the three classification models, the Random Forest-LR model outperformed the stand alone Random Forest and Random Forest-LDA models, having lower overfitting effects and a better predictive ability. We also simulated a Random Forest-Random Forest hybrid model, with the second Random Forest model trained with the top 12 descriptors; however we observed no significant improvement in its classification performance as the average OOB error was 38%. Hierarchical clustering of the binding pockets with the optimal subset of descriptors results in two significant clusters. Analysis of the shape profile of each of these ligands reveals similarities in the binding conformation among each of the clusters. Here we find that all of these models support each other based on their results and chemical interpretation.
The top ranked descriptors reflect the geometric shape and atomic makeup of the binding site. The quantum-chemical descriptors signify the London-van der Waals interactions between the C-C and C-N atoms which play a role in the protein-ligand binding process. The importance of benzene rings is signified by the max resonance for a C-C bond descriptor and its contributions in terms of physiochemical interactions which were revealed by an analysis of mutation patterns which showed that HIV-1 protease maintains its hydrophobicity in the active site through various point mutations. These descriptors provide a means of quantifying the geometric and electronic properties of the HIV-1 protease binding pocket which can be used to design novel HIV-1 protease inhibitors.
Supplementary Material
Acknowledgments
G.M. Ko was supported as a trainee by the NIH RoadMap Initiative award T90 DK07015.
Footnotes
Supporting Information Available: Table S1: PDB queried information of the HIV-1 protease crystal structures used in the dataset.
Table S2: Sequence alignment of the dataset with the HXB2 strain.
This material is available free of charge via the Internet at http://pubs.acs.org/.
References
- 1.UNAIDS. 2009 AIDS Epidemic Update. World Health Organization; Geneva: 2009. [Google Scholar]
- 2.Mansky LM, Temin HM. Lower in vivo Mutation Rate of Human Immunodeficiency Virus Type 1 than that Predicted from the Fidelity of Purified Reverse Transcriptase. J Virol. 1995;69:5087–5094. doi: 10.1128/jvi.69.8.5087-5094.1995. [DOI] [PMC free article] [PubMed] [Google Scholar]
- 3.Perelson AS, Neumann AU, Markowitz M, Leonard JM, Ho DD. HIV-1 Dynamics in Vivo: Virion Clearance Rate, Infected Cell Life-Span, and Viral Generation Time. Science. 1996;271:1582–1586. doi: 10.1126/science.271.5255.1582. [DOI] [PubMed] [Google Scholar]
- 4.Levy DN, Aldrovandi GM, Kutsch O, Shaw GM. Dynamics of HIV-1 Recombination in its Natural Target Cells. Proc Natl Acad Sci U S A. 2004;101:4204–4209. doi: 10.1073/pnas.0306764101. [DOI] [PMC free article] [PubMed] [Google Scholar]
- 5.Shafer RW. Rationale and Uses of a Public HIV Drug-Resistance Database. J Infect Dis. 2006;194:S51–S58. doi: 10.1086/505356. [DOI] [PMC free article] [PubMed] [Google Scholar]
- 6.Pan C, Kim J, Chen L, Wang Q, Lee C. The HIV Positive Selection Mutation Database. Nucleic Acids Res. 2006;35:D371–D375. doi: 10.1093/nar/gkl855. [DOI] [PMC free article] [PubMed] [Google Scholar]
- 7.Johnson VA, Brun-Vézinet F, Clotet B, Günthard HF, Kuritzkes DR, Pillay D, Schapiro JM, Richman DD. Update of the Drug Resistance Mutations in HIV-1: December 2008. Top HIV Med. 2008;16:138–145. [PubMed] [Google Scholar]
- 8.Reddy AS, Kumar S, Garg R. Hybrid-Genetic Algorithm Based Descriptor Optimization and QSAR Models for Predicting the Biological Activity of Tipranavir Analogs for HIV Protease Inhibition. J Mol Graphics Modell. 2010;28:852–862. doi: 10.1016/j.jmgm.2010.03.005. [DOI] [PMC free article] [PubMed] [Google Scholar]
- 9.Garg R, Gupta SP, Gao H, Babu MS, Debnath AK, Hansch C. Comparative Quantitative Structure-Activity Relationship Studies on Anti-HIV Drugs. Chem Rev. 1999;99:3525–3602. doi: 10.1021/cr9703358. [DOI] [PubMed] [Google Scholar]
- 10.Kurup A, Mekapati SB, Garg R, C H. HIV-1 Protease Inhibitors: A Comparative QSAR Analysis. Curr Med Chem. 2003;10:1679–1688. doi: 10.2174/0929867033457070. [DOI] [PubMed] [Google Scholar]
- 11.Garg R, Bhhatarai B. In: QSAR and Molecular Modeling Studies of HIV Protease Inhibitors. Gupta SP, editor. Vol. 3. Springer-Verlag; Berlin Heidelberg: 2006. pp. 181–271. [Google Scholar]
- 12.Bakken GA, Jurs PC. Classification of Multidrug-Resistance Reversal Agents Using Structure-Based Descriptors and Linear Discriminant Analysis. J Med Chem. 2000;43:4534–4541. doi: 10.1021/jm000244u. [DOI] [PubMed] [Google Scholar]
- 13.Byvatov E, Fechner U, Sadowski J, Schneider G. Comparison of Support Vector Machine and Artificial Neural Network Systems for Drug/Nondrug Classification. J Chem Inf Comput Sci. 2003;43:1882–1889. doi: 10.1021/ci0341161. [DOI] [PubMed] [Google Scholar]
- 14.Yao XJ, Panaye A, Doucet JP, Zhang RS, Chen HF, Liu MC, Hu ZD, Fan BT. Comparative Study of QSAR/QSPR Correlations Using Support Vector Machines, Radial Basis Function Neural Networks, and Multiple Linear Regression. J Chem Inf Comput Sci. 2004;44:1257–1266. doi: 10.1021/ci049965i. [DOI] [PubMed] [Google Scholar]
- 15.Blower PE, Cross KP. Decision Tree Methods in Pharmaceutical Research. Curr Top Med Chem. 2006;6:31–9. doi: 10.2174/156802606775193301. [DOI] [PubMed] [Google Scholar]
- 16.Dudek AZ, Arodz T, Gálvez J. Computational Methods in Developing Quantitative Structure-Activity Relationships (QSAR): A Review. Comb Chem High Throughput Screen. 2006;9:213–228. doi: 10.2174/138620706776055539. [DOI] [PubMed] [Google Scholar]
- 17.Fernández M, Caballero J. Ensembles of Bayesian-Regularized Genetic Neural Networks for Modeling of Acetylcholinesterase Inhibition by Huprines. Chem Biol Drug Des. 2006;68:201–212. doi: 10.1111/j.1747-0285.2006.00435.x. [DOI] [PubMed] [Google Scholar]
- 18.Cedeño W, Agrafiotis DK. Feature Selection for Structure-Activity Correlation Using Binary Particle Swarms. J Med Chem. 2002;45:1098–1107. doi: 10.1021/jm0104668. [DOI] [PubMed] [Google Scholar]
- 19.Svetnik V, Liaw A, Tong C, Culberson JC, Sheridan RP, Feuston BP. Random Forest: A Classification and Regression Tool for Compound Classification and QSAR Modeling. J Chem Inf Comput Sci. 2003;43:1947–1958. doi: 10.1021/ci034160g. [DOI] [PubMed] [Google Scholar]
- 20.Li S, Fedorowicz A, Andrew ME. A New Descriptor Selection Scheme for SVM in Unbalanced Class Problem: A Case Study Using Skin Sensitisation Dataset. SAR QSAR Environ Res. 2007;18:423–441. doi: 10.1080/10629360701428474. [DOI] [PubMed] [Google Scholar]
- 21.Shafer RW, Rhee SY, Pillay D, Miller V, Sandstrom P, Schapiro JM, Kuritzkes DR, Bennett D. HIV-1 Protease and Reverse Transcriptase Mutations for Drug Resistance Surveillance. AIDS. 2007;21:215–223. doi: 10.1097/QAD.0b013e328011e691. [DOI] [PMC free article] [PubMed] [Google Scholar]
- 22.Berman HM, Westbrook J, Feng Z, Gilliland G, Bhat TN, Weissig H, Shindyalov IN, Bourne PE. The Protein Data Bank. Nucleic Acids Res. 2000;28:235–242. doi: 10.1093/nar/28.1.235. [DOI] [PMC free article] [PubMed] [Google Scholar]
- 23.Hill M, Tachedjian G, Mak J. The Packaging and Maturation of the HIV-1 Pol Proteins. Curr HIV Res. 2005;3:73–85. doi: 10.2174/1570162052772942. [DOI] [PubMed] [Google Scholar]
- 24.Korber BT, Foley BT, Kuiken CL, Pillai SK, Sodroski JG. In: Numbering Positions in HIV Relative to HXB2CG. Korber B, Kuiken CL, Foley B, Hahn B, McCutchan F, Mellors JW, Sodroski J, editors. Theoretical Biology and Biophysics Group, Los Alamos National Laboratory; Los Alamos: 1998. pp. III–102–III–111. [Google Scholar]
- 25.Clavel F, Hance AJ. HIV Drug Resistance. N Engl J Med. 2004;350:1023–1035. doi: 10.1056/NEJMra025195. [DOI] [PubMed] [Google Scholar]
- 26.Gallivan JP, Dougherty DA. Cation-π Interactions in Structural Biology. Proc Natl Acad Sci U S A. 1999;96:9459–9464. doi: 10.1073/pnas.96.17.9459. [DOI] [PMC free article] [PubMed] [Google Scholar]
- 27.Zacharias N, Dougherty DA. Cation-π Interactions in Ligand Recognition and Catalysis. Trends Pharmacol Sci. 2002;23:281–287. doi: 10.1016/s0165-6147(02)02027-8. [DOI] [PubMed] [Google Scholar]
- 28.Reddy AS, Sastry GN. Cation [M = H+, Li+, Na+, K+, Ca2+, Mg2+, NH4+, and NMe4+] Interactions with the Aromatic Motifs of Naturally Occurring Amino Acids: A Theoretical Study. J Phys Chem A. 2005;109:8893–903. doi: 10.1021/jp0525179. [DOI] [PubMed] [Google Scholar]
- 29.Reddy AS, Vijay D, Sastry GM, Sastry GN. From Subtle to Substantial: Role of Metal Ions on π-π Interactions. J Phys Chem B. 2006;110:2479–2481. doi: 10.1021/jp060018h. [DOI] [PubMed] [Google Scholar]
- 30.Reddy AS, Sastry GM, Sastry GN. Cation-Aromatic Database. Proteins: Struct, Funct Bioinf. 2007;67:1179–1184. doi: 10.1002/prot.21202. [DOI] [PubMed] [Google Scholar]
- 31.The PyMOL Molecular Graphics System, version 1.1. DeLano Scientific LLC; Palo Alto, CA: 2009. [Google Scholar]
- 32.Kovalevsky AY, Liu F, Leshchenko S, Ghosh AK, Louis JM, Harrison RW, Weber IT. Ultra-high Resolution Crystal Structure of HIV-1 Protease Mutant Reveals Two Binding Sites for Clinical Inhibitor TMC114. J Mol Biol. 2006;363:161–173. doi: 10.1016/j.jmb.2006.08.007. [DOI] [PMC free article] [PubMed] [Google Scholar]
- 33.Prabu-Jeyabalan M, Nalivaika EA, King NM, Schiffer CA. Viability of a Drug-Resistant Human Immunodeficiency Virus Type 1 Protease Variant: Structural Insights for Better Antiviral Therapy. J Virol. 2003;77:1306–1315. doi: 10.1128/JVI.77.2.1306-1315.2003. [DOI] [PMC free article] [PubMed] [Google Scholar]
- 34.Mahalingam B, Louis JM, Hung J, Harrison RW, Weber IT. Structural Implications of Drug-Resistant Mutants of HIV-1 Protease: High-Resolution Crystal Structures of the Mutant Protease/Substrate Analogue Complexes. Proteins: Struct, Funct Genet. 2001;43:455–464. doi: 10.1002/prot.1057. [DOI] [PubMed] [Google Scholar]
- 35.Sayer JM, Liu F, Ishima R, Weber IT, Louis JM. Effect of the Active Site D25N Mutation on the Structure, Stability, and Ligand Binding of the Mature HIV-1 Protease. J Biol Chem. 2008;283:13459–13470. doi: 10.1074/jbc.M708506200. [DOI] [PMC free article] [PubMed] [Google Scholar]
- 36.AMPAC, version 8.16.8. Semichem, Inc.; Shawnee, KS: 2007. [Google Scholar]
- 37.Codessa, version 2.7.10. Semichem, Inc.; Shawnee, KS: 2007. [Google Scholar]
- 38.Pettit SC, Gulnik S, Everitt L, Kaplan AH. The Dimer Interfaces of Protease and Extra-Protease Domains Influence the Activation of Protease and the Specificity of GagPol Cleavage. J Virol. 2003;77:366–374. doi: 10.1128/JVI.77.1.366-374.2003. [DOI] [PMC free article] [PubMed] [Google Scholar]
- 39.Breiman L. Random Forests. Mach Learn. 2001;45:5–32. [Google Scholar]
- 40.The R Project for Statistical Computing, version 2.8.1. R Foundation for Statistical Computing; Vienna, Austria: 2008. [Google Scholar]
- 41.Archer KJ, Kimes RV. Empirical Characterization of Random Forest Variable Importance Measures. Comput Stat Data Anal. 2008;52:2249–2260. [Google Scholar]
- 42.Izenman AJ. Modern Multivariate Statistical Techniques: Regression, Classification, and Manifold Learning. Springer-Verlag; New York: 2008. [Google Scholar]
- 43.Worth AP, Cronin MTD. The use of Discriminant Analysis, Logistic Regression and Classification Tree Analysis in the Development of Classification Models for Human Health Effects. J Mol Struct Theochem. 2003;622:97–111. [Google Scholar]
- 44.MATLAB, version R2009a. The MathWorks, Inc.; Natick, MA: 2009. [Google Scholar]
- 45.Johnson SC. Hierarchical Clustering Schemes. Psychometrika. 1967;32:241–254. doi: 10.1007/BF02289588. [DOI] [PubMed] [Google Scholar]
- 46.Fraley C, Raftery AE. How Many Clusters? Which Clustering Method? Answers Via Model-Based Cluster Analysis. Comput J. 1998;41:578–588. [Google Scholar]
- 47.Hawkins DM, Basak SC, Mills D. Assessing Model Fit by Cross-Validation. J Chem Inf Comput Sci. 2003;43:579–586. doi: 10.1021/ci025626i. [DOI] [PubMed] [Google Scholar]
- 48.Ward JH., Jr Hierarchical Grouping to Optimize an Objective Function. J Am Stat Assoc. 1963;58:236–244. [Google Scholar]
- 49.Kozisek M, Saskova KG, Rezacova P, Brynda J, Van Maarseveen NM, De Jong D, Boucher CA, Kagan RM, Nijhuis M, Konvalinka J. Ninety-Nine is Not Enough: Molecular Characterization of Inhibitor-Resistant Human Immunodeficiency Virus Type 1 Protease Mutants with Insertions in the Flap Region. J Virol. 2008;82:5869–5878. doi: 10.1128/JVI.02325-07. [DOI] [PMC free article] [PubMed] [Google Scholar]
- 50.Kelly MD, Mancera RL. A New Method for Estimating the Importance of Hydrophobic Groups in the Binding Site of a Protein. J Med Chem. 2005;48:1069–1078. doi: 10.1021/jm049524q. [DOI] [PubMed] [Google Scholar]
- 51.Biswas KM, DeVido DR, Dorsey JG. Evaluation of Methods for Measuring Amino Acid Hydrophobicities and Interactions. J Chromatogr, A. 2003;1000:637–655. doi: 10.1016/s0021-9673(03)00182-1. [DOI] [PubMed] [Google Scholar]
- 52.Rose GD, Geselowitz AR, Lesser GJ, Lee RH, Zehfus MH. Hydrophobicity of Amino Acid Residues in Globular Proteins. Science. 1985;229:834–838. doi: 10.1126/science.4023714. [DOI] [PubMed] [Google Scholar]
- 53.Chapman TM, Plosker GL, Perry CM. Fosamprenavir: A Review of its Use in the Management of Antiretroviral Therapy-Naive Patients with HIV Infection. Drugs. 2004;64:2101–2124. doi: 10.2165/00003495-200464180-00014. [DOI] [PubMed] [Google Scholar]
- 54.Rodriguez-French A, Boghossian J, Gray GE, Nadler JP, Quinones AR, Sepulveda GE, Millard JM, Wannamaker PG. The NEAT Study: A 48-Week Open-Label Study to Compare the Antiviral Efficacy and Safety of GW433908 Versus Nelfinavir in Antiretroviral Therapy-Naive HIV-1-Infected Patients. J Acquir Immune Defic Syndr. 2004;35:22–32. doi: 10.1097/00126334-200401010-00003. [DOI] [PubMed] [Google Scholar]
- 55.Spycher S, Nendza M, Gasteiger J. Comparison of Different Classification Methods Applied to a Mode of Toxic Action Data Set. QSAR Comb Sci. 2004;23:779–791. [Google Scholar]
Associated Data
This section collects any data citations, data availability statements, or supplementary materials included in this article.