

Abstract
The gallotannin penta-O-galloyl-beta-D-glucose (PGG) has many biological activities including in vivo anti-cancer efficacy. We present in this paper a scaled-up protocol for its preparation in high purity from tannic acid by acidic methanolysis with typical yield of 15%. We also describe a method for the analysis of PGG in mouse plasma by HPLC and its application in preliminary pharmacokinetic studies. A liquid–liquid extraction (LLE) protocol was optimized for the extraction of PGG from mouse plasma. The extraction efficiency for PGG at 1 μg/mL in mouse plasma was 70.0 ± 1.3% (n=5). The limit of detection (LOD) for PGG was approximately 0.2 μg/mL. Preliminary pharmacokinetic parameters of PGG following a single i.p. injection with 5% ethanol/saline vehicle in mice were established. The peak plasma PGG concentrations (Cmax) were approximately 3–4 μM at a dose of 0.5 mg per mouse (~20 mg/kg) at 2 h post-injection (Tmax).
Keywords: Penta-galloyl glucose, Acidic methanolysis, HPLC, Liquid-liquid extraction, Mouse plasma, Pharmacokinetics
1. Introduction
1, 2, 3, 4, 6-penta-O-galloyl- β-D-glucose (PGG) is a naturally occurring polyphenolic compound with multiple biological activities (See our comprehensive review [1]. Several in vivo experiments by us and others have shown that PGG has inhibitory activities against prostate, lung and breast cancer. For example, Hu et al reported that daily i.p. injection of 20 mg/kg PGG suppressed the growth of DU145 xenograft in an athymic nude mouse model [2]. Huh et al demonstrated strong dose-dependent suppressing effect of PGG against Lewis lung cancer allograft with 4 or 20 mg/kg daily i.p. administration [3]. Recently, PGG was shown to suppress the in vitro invasion and in vivo xenograft growth of intra-tibially inoculated PC-3 human prostate cancer cells at a dose of 25 mg/kg via i.p. injection, every other day for 28 days [4]. Cell culture based studies revealed that PGG might be involved in anti-cancer activities such as proapoptosis, anti-proliferation, anti-angiogenesis, anti-metastasis and inhibition of P-glycoprotein [1]. However, it is unclear whether the in vivo anti-cancer activities are direct actions of PGG and/or its metabolites or through other indirect mechanisms. To address the in vivo anti-cancer mechanism of PGG, it is both necessary and essential to obtain knowledge of its absorption, distribution, metabolism and excretion (ADME). Though there are a handful of publications on the analysis of PGG in herbal extracts by HPLC, neither the methodology for PGG analysis in biological matrixes nor in vivo pharmacokinetics of PGG has ever been reported. Here, we report a practical method for the analysis of PGG in mouse plasma by liquid–liquid extraction and HPLC-UV.
Botanically, PGG can exist as either free form or as the core structure of tannic acids. Though it is present at sufficient levels to allow direct isolation from a number of Oriental herbs and other plants such as Rhus chinensis Mill [3], Paeonia suffruticosa [5], Paeonia lactiflora [6] and Schinus terebinthifolius [7], the amount of free PGG varies among different plant species and the extraction yield tended to be low. Indeed, PGG is predominantly found in plants as the core structure of the higher galloyl glucoses which are commercially available as tannic acids. In tannic acids, the depside bonds between galloyl groups are less stable than the aliphatic ester bonds between galloyl groups and glucose core. Treating tannic acids in weak acid (usually acetate buffer at pH 5.0) and methanol generates PGG and methyl gallate. A Japanese group [8] and Hagerman’s group [9] have established the methodology for PGG preparation by methanolysis of tannic acid (Fig. 1). We report here a scaled-up and refined protocol that allows the reproducible preparation of multi-gram quantity of high purity PGG (>99%) from 100 g batches of tannic acid with a yield of 15%.
Figure 1.

(A) Methanolysis of tannic acid to yield PGG under weak acidic condition; (B) Structure of PGG and EGCG.
2. Materials and methods
2.1. Reagents and chemicals
Epigallocatechin gallate (EGCG), L-ascorbic acid, sodium acetate, ethyl acetate and acetonitrile were purchased from Sigma-Aldrich Co. (St. Louis, MO, USA). Tannic acid (Fischer Chemical, batch # A310-500) and methanol were from Fisher Scientific (Pittsburgh, PA, USA). Glacial acetic acid was from EMD Chemicals Inc. (Gibbstown, NJ, USA). All reagents used were of HPLC grade except where indicated. The water was double distilled and filtered before use. C57BL/6 mouse plasma was obtained from Innovative Research (Novi, Michigan, USA) for method development.
2.2. PGG preparation by methanolysis of tannic acid for 100 g batches
Tannic acid (100 g) was dissolved in the methanolysis solution (800 mL of methanol and 360 mL of sodium acetate buffer, 0.25 M, pH 5), which was then heated at 65 °C for 5 days. The reaction was monitored by 1H NMR as tannic acid and PGG do not resolve well by TLC. Once the methanolysis reaction was complete, the pH of the reaction mixture was raised to pH 6 by adding 0.25 M NaOH solution. After that, methanol was removed under reduced pressure. The resulting residue was dissolved in 100 mL of distilled water and then extracted with ethyl ether (5 × 500 mL). The ether extract contains methyl gallate which is the byproduct of the methanolysis reaction of tannic acid. The aqueous layer was then extracted with ethyl acetate (5×100 mL) with 20-30 min sonication. The ethyl acetate extract containing PGG was combined and the volume was reduced to half under reduced pressure. Following that, 100 mL distilled water was added. This step was repeated 4-5 times, leading to complete ethyl acetate removal and an aqueous PGG sample ~500-600 mL (milkly suspension). The suspension was then centrifuged for 15 min at 3000 rpm, and the resulting pellet containing mostly PGG was washed with distilled water 3-4 times until there was no brown color in the wash. As the last step, PGG was recrystallized by using 2% aqueous methanolic solution.
2.3. Treatment of animals and plasma sample preparation
The animal study was approved by the Institutional Animal Care and Use Committee of the University of Minnesota and was carried out at the Hormel Institute animal facility. All animals used in this study were maintained on the AIN-93M purified diet for a minimum of 1 week prior to treatment. Male and female C57BL/6 mice (Jackson labs) at the age of 7-8 weeks were given a single dose of 0.5 mg (20mg/kg) PGG by intra-peritoneal injection in two pilot studies. The vehicle used was saline containing 5% ethanol (v/v) according to Nishizawa et al[10] and the injection volume for each mouse was 0.2 mL. At indicated time points after injection, mice were anesthetized by isoflurane, and blood was taken from retro-orbital sinus through heparinized capillary tubes. Blood samples were kept on ice immediately after collection and centrifuged to recover plasma 10 min later. For each time point, 4 mice were used. All plasma samples were stored at −70□ until analysis.
2.4. Sample Extraction
Considering the structural similarity between PGG and EGCG, we set out to adapt a published extraction method for EGCG to PGG [11]. However, our initial attempt showed very poor recovery of PGG from mouse plasma by direct extraction with ethyl acetate. To optimize the extraction efficiency of PGG from mouse plasma, we first compared acidification using either 100 mM sodium phosphate buffer (pH 3.2) or 2% acetic acid. In brief, mouse plasma (100 μL) was spiked with 1 μg PGG and 2.5 μg EGCG as internal standard (IS). An equal volume of phosphate buffer or 2% acetic acid or nothing was added to the spiked samples. The samples were then mixed well by vortexing and ethyl acetate was added to extract PGG/EGCG.
We finalized the sample extraction protocol as follows. Plasma (100 μL) was mixed with 1 μL of ascorbic acid solution (20%, as anti-oxidant) and spiked with 10 μL of IS solution (250 μg/mL EGCG). Acetic acid solution (2%, 100 μL) was added to acidify the sample, which was then thoroughly mixed by vortexing and left at room temperature for 2 min. Ethyl acetate (800 μL) was added and mixed by vortexing vigorously for 2 min to extract PGG and EGCG. The sample was then centrifuged briefly and 500 μL of ethyl acetate layer was transferred to a clean Eppendorf tube containing 1 μL of 1% ascorbic acid solution. A second extraction was performed by adding 500 μL of ethyl acetate to the plasma-containing tube, and vortexing for another 2 min. The sample was further centrifuged at 5000 rpm for 2 min. The ethyl acetate supernatant was collected and combined with the first fraction. The combined supernatant was dried through a Speedvac (Labconco, Kansas City, MO, USA) at ambient temperature. The pellet was reconstituted in 70 μL of 50% methanol/water/0.01% ascorbic acid and vortexed for 2 min. The solution was centrifuged at 16000 g for 10 min and the supernatant (~65 μL) was transferred to an autosampler vial for injection.
2.5. HPLC system
A Beckman System Gold liquid chromatographic system was utilized for PGG analysis. The system consisted of a 126 solvent module, a 507e autosampler and a diode array detector module 168. The sample was separated on a 5 μm Zorbax Eclipse plus C18 column (250mm×4.6mm, Agilent). The mobile phase used was 0.3% acetic acid (solvent A) and 95% acetonitrile containing 0.3% acetic acid (solvent B). The chromatographic separation was done by a linear gradient from 0% B to 50% B in 20 min, and kept at 50% B for 5 min. The flow rate was set as 1.0 mL/min. The detection wavelength used for both PGG and EGCG was 280 nm.
2.6. Calibration, internal standards and quality controls
The EGCG (IS) stock solution (2.5 mg/mL) was prepared in 95% methanol containing 1% ascorbic acid. PGG stock solution (25 mg/mL) was prepared in methanol, and the concentration was confirmed by measuring its UV absorbance at 280nm [12]. Both of the stock solutions were stored at −20°C. The EGCG working solution (250 μg/mL) was prepared daily on ice by diluting the stock solution with 50% methanol containing 0.1% ascorbic acid. The PGG working solutions at 500, 100 and 10 μg/mL were freshly prepared by sequentially diluting the stock solution in 50% methanol containing 0.01% or 0.1% ascorbic acid. These serial dilutions were then used to spike the commercial C57BL/6 mouse plasma for generating a calibration curve at 0.4, 1, 2.5, 5, 10, 25 and 50 μg/mL PGG in mouse plasma.
2.7. Method validation
Method validation was carried out following FDA guidelines with respect to specificity, recovery, within- and between-day precision, lower limit of detection (LOD), lower limit of quantification (LLOQ) and sample stability.
3. Results and discussion
3.1. Chemical characterization of isolated PGG
The isolated PGG was verified by HPLC, specific rotation, 1H NMR and mass spectral analyses. All data closely matched published work [13-15].
3.2. Typical yield of preparation
Table 1 presents yield of PGG based on different amount of starting tannic acid in several runs. Overall, 15% yield was obtained regardless of the quantity of the starting material (5-100 g). It is essential to verify that the starting material tannic acid has the correct core structure to yield the desired final product. It is also very important that mild methanolysis condition in weak acid (usually acetate buffer at pH 5.0) and methanol be followed faithfully. Methanolysis with strong inorganic acid leads to the formation of methyl gallate [16].
Table 1.
Yield of PGG is not affected by the starting quantity of tannic acid
| Tannic acid Input (gram) |
PGG from first precipitation (gram) |
PGG recovered from washes (gram) |
Yield *(%) |
|---|---|---|---|
| 5 | 0.39 | 0.07 | 15.4 |
| 5 | 0.37 | 0.06 | 15.0 |
| 10 | 0.94 | 0.05 | 18.0 |
| 25 | 1.64 | 0.15 | 13.0 |
| 50 | 2.5 | 1.7 | 15.1 |
| 100 | 7.4 | 1.2 | 15.5 |
| 100 | 7.7 | 1.0 | 15.9 |
| 100 | 7.05 | 1.2 | 15.0 |
| 100 | 7.2 | 1.0 | 14.9 |
| 100 | 6.7 | 1.3 | 14.4 |
Theoretical PGG content in 100 g tannic acid is ~55 g.
3.3. Specificity
Both PGG and the internal standard EGCG have UV absorbance peaks at 220 and 280 nm. We chose to use 280 nm because this wavelength provides better selectivity and not at the sacrifice of the sensitivity comparing to 220 nm. Under the gradient elution condition used, EGCG and PGG were well separated from the matrix impurities, with retention times at 14.45 and 16.20 min, respectively (Fig. 2A).
Figure 2.
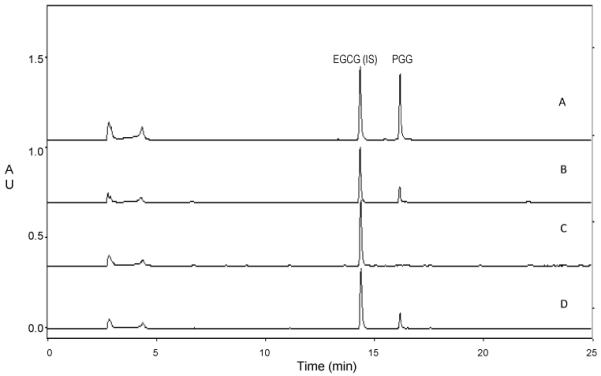
Representative chromatograms: (A) EGCG (IS) and PGG standard; (B) Commercial C57BL/6 mouse plasma spiked with EGCG (IS) at 25 μg/mL and PGG at 5 μg/mL; (C) Commercial C57BL/6 mouse plasma spiked with EGCG (IS) at 25 μg/mL; (D) Typical chromatogram from C57BL/6 mouse plasma after i.p. injection of 0.5 mg PGG (~20mg/kg). Before extraction, EGCG was spiked at 25 μg/mL as IS.
C57BL/6 mouse plasma was processed using the method described above to determine any possible interference from endogenous compounds in biological matrices. Representative chromatograms of PGG and EGCG standards and C57BL/6 mouse plasma spiked with EGCG only or with both EGCG and PGG were shown in Fig. 2B. Endogenous peaks were absent at the retention times of PGG.
3.4. Optimization of extraction method
The similarity between PGG and EGCG in the form of gallate prompted us to adapt a published extraction method for EGCG to PGG [11]. However, our initial attempt showed very poor recovery of PGG from mouse plasma by direct extraction with ethyl acetate. We then tested acidification of the plasma samples with an equal volume of 100 mM sodium phosphate (pH3.2) or 2% acetic acid vs. no acidification before applying ethyl acetate for extraction. As shown in Fig. 3, addition of either phosphate buffer or acetic acid provided a better recovery of PGG when compared to direct extraction with ethyl acetate that has only a recovery of 43%. Acetic acid works slightly better than phosphate buffer, with a recovery of 72% versus 65%, respectively. On the other hand, acidification by phosphate buffer vs. acetic acid solution showed a trend of negatively affecting the recovery of EGCG. Therefore, we chose to use the 2% acetic acid solution to acidify the plasma samples that permits an acceptable recovery of both PGG and EGCG by ethyl acetate as the final extraction method.
Figure 3.

Impact of acidification solutions on extraction efficiency for PGG and EGCG from spiked C57BL/6 mouse plasma. PO4: 0.1 M Na2HPO4 buffer, pH 3.2; AA: 2% acetic acid solution; none: nothing added.
3.5. Recovery
The absolute recovery of PGG and EGCG was determined by comparing the amount measured in processed commercial plasma samples spiked with standard solutions relative to unprocessed standard solutions at the same level. The recovery of PGG in C57BL/6 mouse plasma was carried out in quintuplet at concentrations of 1, 10 and 50 μg/mL in commercial mouse plasma using the method described above. The results were shown in Table 2. The absolute recovery of spiked PGG ranged from 63% to 70% at the three concentrations tested.
Table 2.
Absolute recovery of PGG from spiked C57BL/6 mouse plasma (n=5)
| Nominal concentration (μg/ml) |
Absolute recovery (%) |
SD (n=5, %) |
|---|---|---|
| 1 | 70.0 | 1.3 |
| 10 | 64.2 | 2.7 |
| 50 | 63.7 | 4.9 |
3.6. Range and linearity of the calibration curve
A seven-point calibration curve was constructed for PGG at the concentrations indicated above. The linear range was 0.4-50 μg/mL, and the equation of calibration curve was y = 1.676 x, with R square = 0.999. The PGG standards for the calibration curve were freshly prepared during each individual analytical run for the purpose of quantization.
3.7. Lower limit of detection (LOD) and lower limit of quantification (LLOQ)
LOD is defined as the amount that can be detected with a signal to noise ratio of 3, and LLOQ is defined as the amount that can be determined with a precision better than 20% and an accuracy between 80 and 120%. Commercial mouse plasma was spiked with 10, 20 or 40 ng PGG to assess the LOD and LLOQ. We estimated LOD was about 0.2 μg/mL in mouse plasma when using 100 μL plasma, and 0.1 μg/mL when using 200 μL mouse plasma. The lower limit of quantification was determined to be 0.4 μg/mL. At this LLOQ the accuracy was 80% ± 5.1% (n=3) and the precision was 16%.
3.8. Accuracy, within- and between-run precision
Commercial mouse plasma samples were spiked in three to five replicates with PGG at 1, 5, 50 μg/mL and immediately processed at ambient temperature. This was repeated for three different days. Accuracy was calculated as the grand mean of all the measurements across the runs over the nominal/actual concentration. The within run precision was displayed as the relative standard deviation (RSD) from five repeats in a single run. The between day precision was the RSD from the mean measurements among three different runs.
The results of accuracy, within-run and between-run precision were shown in Table 3. The accuracy of mean measured concentration was within ± 10% of the known concentration. The within-run and between-run RSDs were within the acceptable range of 15%.
Table 3.
Measurement accuracy and precision for PGG in spiked C57BL/6 mouse plasma
| Nominal concentration (μg/ml) |
Measured concentration (μg/ml) |
Accuracy (%) |
WDP1 (%) |
BDP2 (%) |
|---|---|---|---|---|
| 1 | 1.06 | 105.7 | 12.0 | 7.6 |
| 10 | 10.75 | 107.5 | 8.0 | 6.4 |
| 50 | 53.51 | 107.0 | 6.9 | 5.9 |
WDP (%), Within day precision
BDP (%), Between day precision
3.9. Sample stability
PGG and EGCG stock solutions were stable at least 6 months at − 20°C (data not shown). We assessed the stability of PGG in plasma under freezer storage, repeated freeze-thaw cycles and at ambient temperature. The blank mouse plasma were spiked with PGG at 10 μg/mL in triplicate, and stored at −70 °C. To examine the stability of PGG during freezer storage, the samples were stored at −70 °C for 1 day or 8 days before being processed. To evaluate the effect of freeze-thaw, the samples were stored at −70 °C for 1 day, and on the second day, the samples were freeze-thawed three times. For the stability of the PGG at ambient temperature, the PGG spiked plasma samples were kept at ambient temperature for 3 h, and then stored at −70 °C. The samples were then processed as usual. We also assessed the stability of the processed samples on the autosampler. The blank mouse plasma were spiked with PGG at 10 μg/mL in triplicate, processed, and then put on autosampler. The samples were injected into HPLC either immediately, or 24 h and 48 h later.
Unprocessed commercial C57BL/6 mouse plasma samples spiked with PGG at 10 μg/mL were stable at ambient temperature for at least 3 h (9.7±0.5μg/mL, n=3), when stored at −70 °C for at least 8 days (9.6±0.6μg/mL, n=3), and were also stable after freeze-thaw cycles (10.1±0.7μg/mL, n=3). Processed commercial mouse plasma samples spiked with PGG and EGCG at 10 and 25 μg/ml, respectively, were stable in the autosampler at ambient temperature for at least 48 h (10.3 μg/mL) under the condition used in this study.
3.10. Determination of PGG levels in C57BL/6 mouse plasma after i.p. administration
To demonstrate the applicability of the established method, we performed two preliminary pharmacokinetic studies of PGG in C57BL/6 mice. Male and female mice were used in the first and second studies, respectively. The mice were given a single i.p. injection of 0.5 mg per mouse (~20 mg/kg) of PGG. The dosage of PGG used here has been reported to be effective against Lewis lung cancer allograft [3], DU145 and PC3 prostate cancer xenograft [2, 4]. Representative chromatograms from C57BL/6 mouse plasma samples were shown in Fig. 2C and D.
The plasma PGG level followed a single peak pattern in both male and female mice (Fig. 4). The peak plasma PGG concentration (Cmax) was approximately 3-4 μM at Tmax (time to reach maximal plasma concentration) of ~2 h (Fig. 4) in both sexes. The absorption kinetic behavior of PGG appeared quite similar in both genders. The post-peak fall of PGG (clearance from plasma compartment) in females appeared to be slightly faster than in males. It is also noteworthy that in spite of the sharp post-peak fall, the plasma PGG level remained unchanged from 6 to 24 hours, ~1/3 of Cmax. Incubation of plasma with glucuronidase and sulfatase at 37°C for 30 min did not change extractable PGG (Fig 5), suggesting that PGG exists in mouse plasma mostly as the free extractable form.
Figure 4.

Plasma pharmacokinetic characteristics of injected PGG (0.5 mg per mouse, i.p.) in male (squares) and female (triangles) C57BL/6 mice. Each data point represents mean ± SE, n = 4 mice.
Figure 5.

Lack of effect of glucuronidase and sulfatase on the extractable level of PGG in plasma. Plasma samples were from C57BL/6 mice subjected to one dose of 2 mg PGG by i.p. injection.
In addition, we failed to detect PGG in plasma of mouse after 2 mg PGG per mouse was delivered by oral garage. This was very likely due to the limited sensitivity of the UV (DAD) detector described above. Our preliminary experiments with MS/MS as detector (QTRAP2000) suggested that plasma PGG levels after oral administration were in the sub-micromolar range .
In terms of the pharmacokinetic features of PGG through i.p. injection, it is noteworthy that it took longer time for PGG to reach plasma Cmax than did other polyphenolic compounds. For example, Long et al reported the Tmax of EGCG in rats (2 mg/kg) after intraperitoneal injection was just 11 min [17]. The Tmax of other phenolics such as gallic acid, chlorogenic acid, caffeic acid and anthocyanins were less than 2 h even when they were orally administrated to humans [18]. One obvious difference is that the molecular weight of PGG is 3-6 times greater than the compounds mentioned above. Another difference is that the binding between PGG and proteins or other molecules is stronger than that for the other phenolic compounds. It is well-known that PGG can bind to a wide range of molecules, especially proteins and phospholipids such as albumin and lecithin [19]. Studies with model compounds indicated that macromolecules such as albumin and polymers were cleared more slowly from the cavity compartment and remained there at higher concentrations than small molecules such as mitomycin C and doxorubicin [20]. The plasma concentrations of macromolecules are usually lower and Tmax longer than small molecules. Though the binding of PGG with proteins may slow down its absorption, this interaction may on the other hand prevent PGG from further metabolism and excretion. So the binding activity of PGG may explain, at least partially, its pharmacokinetic characteristics.
Since we observed slow absorption and clearance of PGG in single dose experiments (Fig. 4), one might speculate that PGG could accumulate upon repeated dosing. Also, we noticed that the absorption of PGG was greatly reduced when administered in 2% Tween 80-water vehicle compared with that in 5% ethanol/saline (data not shown). All these issues should be considered in future animal studies.
4. Conclusion
In summary, we reported a scaled-up protocol for preparation of highly pure PGG from methanolysis of tannic acid and, to our knowledge for the first time, a methodology for PGG analysis in plasma. The extraction protocol and HPLC elution condition described provide a practical and specific means to analyze PGG in biological fluids. We have built a solid foundation for extending and optimizing the extraction protocol to other biological matrices such as solid tissues. The limited sensitivity of the diode-array detector could be replaced with more sensitive detection modules such as electrochemical or tandem mass spectrometric detectors to enable the establishment of pharmacokinetic parameters of PGG delivered through oral/diet and drinking water.
Acknowledgements
The authors thank Professor Ann Hagerman, Department of Chemistry & Biochemistry, Miami University, Oxford OH 45056 for providing initial protocol, reference compounds and valuable advices. The assistance of Ellen Kroc and animal facility staff and Todd Schuster of Shared Instruments Core facility is gratefully acknowledged. This work was supported by NIH grant CA136953.
Footnotes
Publisher's Disclaimer: This is a PDF file of an unedited manuscript that has been accepted for publication. As a service to our customers we are providing this early version of the manuscript. The manuscript will undergo copyediting, typesetting, and review of the resulting proof before it is published in its final citable form. Please note that during the production process errors may be discovered which could affect the content, and all legal disclaimers that apply to the journal pertain.
References
- [1].Akkina SK, Zhang Y, Nelsestuen GL, Oetting WS, Ibrahlm HN. J. Proteome Res. 2009;8:94–103. doi: 10.1021/pr800646j. [DOI] [PMC free article] [PubMed] [Google Scholar]
- [2].Hu H, Lee HJ, Jiang C, Zhang J, Wang L, Zhao Y, Xiang Q, Lee EO, Kim SH, Lu J. Mol. Cancer Ther. 2008;7:2681–2691. doi: 10.1158/1535-7163.MCT-08-0456. [DOI] [PubMed] [Google Scholar]
- [3].Huh JE, Lee EO, Kim MS, Kang KS, Kim CH, Cha BC, Surh YJ, Kim SH. Carcinogenesis. 2005;26:1436–1445. doi: 10.1093/carcin/bgi097. [DOI] [PubMed] [Google Scholar]
- [4].Kuo PT, Lin TP, Liu LC, Huang CH, Lin JK, Kao JY, Way TD. J. Agric. Food Chem. 2009;57:3331–3339. doi: 10.1021/jf803725h. [DOI] [PubMed] [Google Scholar]
- [5].Oh GS, Pae HO, Oh H, Hong SG, Kim IK, Chai KY, Yun YG, Kwon TO, Chung HT. Cancer Lett. 2001;174:17–24. doi: 10.1016/s0304-3835(01)00680-2. [DOI] [PubMed] [Google Scholar]
- [6].Lee SJ, Lee HK, Jung MK, Mar W. Biol. Pharm. Bull. 2006;29:2131–2134. doi: 10.1248/bpb.29.2131. [DOI] [PubMed] [Google Scholar]
- [7].Cavalher-Machado SC, Rosas EC, Brito Fde A, Heringe AP, de Oliveira RR, Kaplan MA, Figueiredo MR, Henriques MG. Int. Immunopharmacol. 2008;8:1552–1560. doi: 10.1016/j.intimp.2008.06.012. [DOI] [PubMed] [Google Scholar]
- [8].H T, Yoshizawa S, Suganuma M, Nishiwaki S, Yatsunami J, Okabe S, Okuda T, Muto Y, Frenkel K, Troll W, Fujiki H. Penta-O-galloyl-beta-D-glucose and (-)-epigallocatechin gallate. In: H C-T, Huang M-T, Lee CY, editors. Phenolic Compounds in Food and Their Effect on Health II. USA: 1992. pp. 316–325. ACS Symposium Series 507. [Google Scholar]
- [9].Chen Y, Hagerman AE. J. Agric. Food Chem. 2004;52:4008–4011. doi: 10.1021/jf035536t. [DOI] [PubMed] [Google Scholar]
- [10].Nishizawa M, Yamagishi T, Nonaka G, Nishioka I, Nagasawa T, Oura H. Chem. Pharm. Bull. 1983;31:2593–2600. doi: 10.1248/cpb.31.2593. [DOI] [PubMed] [Google Scholar]
- [11].Lee MJ, Wang ZY, Li H, Chen L, Sun Y, Gobbo S, Balentine DA, Yang CS. Cancer Epidemiol. Biomarkers Prev. 1995;4:393–399. [PubMed] [Google Scholar]
- [12].Chen Y, Hagerman AE. Free Radic. Res. 2005;39:117–124. doi: 10.1080/10715760400013789. [DOI] [PubMed] [Google Scholar]
- [13].Khanbabaee K, Lotzerich K. Tetrahedron. 1997;53:10725–10732. [Google Scholar]
- [14].Nishizawa M, Yamagishi T, Nonaka G, Nishioka I, Bando H. Chem. Pharm. Bull. 1982;30:1094–1097. [Google Scholar]
- [15].Ren Y, Himmeldirk K, Chen X. J. Med. Chem. 2006;49:2829–2837. doi: 10.1021/jm060087k. [DOI] [PubMed] [Google Scholar]
- [16].Hartzfeld PW, Forkner R, Hunter MD, Hagerman AE. J. Agric. Food Chem. 2002;50:1785–1790. doi: 10.1021/jf0111155. [DOI] [PubMed] [Google Scholar]
- [17].Long H, Zhu Y, Cregor M, Tian F, Coury L, Kissinger CB, Kissinger PT. J. Chromatogr. 2001;763:47–51. doi: 10.1016/s0378-4347(01)00365-6. [DOI] [PubMed] [Google Scholar]
- [18].Manach C, Williamson G, Morand C, Scalbert A, Remesy C. Am. J. Clin. Nutr. 2005;81:230S–242S. doi: 10.1093/ajcn/81.1.230S. [DOI] [PubMed] [Google Scholar]
- [19].Takechi M, Tanaka Y. Phytochemistry. 1987;26:95–97. [Google Scholar]
- [20].Kimura M, Konno T, Miyamoto Y, Kojima Y, Maeda H. Anticancer Res. 1998;18:2547–2550. [PubMed] [Google Scholar]