Abstract
Quantifying patterns of temporal trends in species assemblages is an important analytical challenge in community ecology. We describe methods of analysis that can be applied to a matrix of counts of individuals that is organized by species (rows) and time-ordered sampling periods (columns). We first developed a bootstrapping procedure to test the null hypothesis of random sampling from a stationary species abundance distribution with temporally varying sampling probabilities. This procedure can be modified to account for undetected species. We next developed a hierarchical model to estimate species-specific trends in abundance while accounting for species-specific probabilities of detection. We analysed two long-term datasets on stream fishes and grassland insects to demonstrate these methods. For both assemblages, the bootstrap test indicated that temporal trends in abundance were more heterogeneous than expected under the null model. We used the hierarchical model to estimate trends in abundance and identified sets of species in each assemblage that were steadily increasing, decreasing or remaining constant in abundance over more than a decade of standardized annual surveys. Our methods of analysis are broadly applicable to other ecological datasets, and they represent an advance over most existing procedures, which do not incorporate effects of incomplete sampling and imperfect detection.
Keywords: temporal trends, species abundance, null model, hierarchical model, stream fishes, grassland insects
1. Introduction
Quantifying change in the structure of plant and animal communities is an important challenge for ecology in the twenty-first century (Walther et al. 2002). Species composition and abundance can respond directly to long-term changes in abiotic factors (Dunson & Travis 1991) and indirectly to changes in the occurrence or abundance of other species (White et al. 2006). Dramatic and rapid changes in community structure may result from the addition or loss of keystone species (Mills et al. 1993), foundation species (Ellison et al. 2005), ecosystem engineers (Jones et al. 1994) and some (but not all) non-native species (Manchester & Bullock 2000). Other changes may be more subtle, because the abundance of individual species can gradually increase or decrease over long periods of time, as in scenarios of a ‘shifting baseline’ (Pauly 1995). Long-term trends may be difficult to detect because of substantial short-term noise and variability in abundances between consecutive samples.
However, not all observed changes in community structure through time are biologically relevant. Most measures of community structure and diversity are sensitive to sampling effort and to the number of individuals counted (Gotelli & Colwell 2001). These quantities are rarely constant through time, even with standardized monitoring programmes. Rare species, in particular, are expected to occur more often when sampling is more thorough (Chao et al. 2009). Even the appearance of a previously unrecorded species need not signal a true change in community structure. Biodiversity sampling is labour intensive and notoriously incomplete (Lawton et al. 1998), and ‘new’ species occurrence records—especially of plants and invertebrates—are routinely made, even in sites that have been well-sampled for many years (e.g. Longino et al. 2002).
A variety of univariate and multivariate methods have been proposed to quantify the degree of community change through time (Collins et al. 2000; Fujiwara & Mohr 2009), and to detect temporal trends in community structure (Clarke 1993; Solow 1994). However, with few exceptions (e.g. Dorazio et al. 2010), existing methods do not account for incomplete sampling and imperfect detection. Instead, most methods assume that the absence of a species from a sampling period represents a ‘true’ zero, and not a detection error (Royle & Dorazio 2008). Most procedures also ignore species that may have been present in a region, but were never detected in any of the samples (Colwell & Coddington 1994).
In this study, we develop new methods for quantifying temporal trends in species abundances that account for errors in detection of individuals. Our methods are appropriate for analysing species-specific counts of individuals recorded from repeated surveys of a single site. We first develop a bootstrap procedure for testing a null hypothesis in which the counts are assumed to have arisen from sampling a stationary distribution of relative species abundances with temporally varying sampling probabilities. We then develop a hierarchical model of the counts to estimate species-specific trends in abundance while accounting for species-specific probabilities of detection. Both methods of analysis are illustrated for two long-term datasets on stream fishes and grassland insects.
2. Material and methods
(a). Data structure
The data for our analyses may be organized as a matrix of counts of individuals of S species (rows) recorded during T successive sampling periods (columns). The matrix entry yij is the number of individuals of species i that were observed at sampling time j (i = 1, …, S; j = 1, …, T). This simple data structure arises in many ecological studies in which species assemblages are repeatedly sampled at a site. Although the samples do not have to be evenly spaced in time, our methods are intended for analysis of long-term trends in abundance, not for short-term or periodic changes in abundance (e.g. seasonality). We illustrate our methods with two datasets: a 13-year record of annual counts of 55 fish species seined from a mid-western USA stream (Grossman et al. 1982), and a 14-year record of annual counts of nine insect species collected from sticky traps in a successional grassland plot at the USA Kellogg Biological Station (KBS 1995). Table 1 summarizes sampling details for each of these studies.
Table 1.
Empirical details of two data matrices and null model results for temporal change analysis. See text for definitions of variables.
| source | Grossman et al. (1982) | KBS (1995) |
|---|---|---|
| taxon | stream fishes | grassland insects |
| study site | central Illinois stream reach | successional grassland plot |
| sampling method | seining | sticky traps |
| observed number of species | 55 | 9 |
| estimated number of undetected species (Chao 1984) | 16 | 0 |
| sampling interval | ∼ annual | annual |
| timespan | September 1963–September 1974 | 1989–2002 |
| number of sampling dates (T) | 15 | 14 |
| average count per sample (minimum, maximum) | 914 (87, 5344) | 401 (71, 1152) |
| average count per species (minimum, maximum) | 266 (1, 4304) | 624 (2, 2793) |
| total count (N) | 14 142 | 5614 |
| observed temporal change index (TC) | 0.256 | 156.90 |
| average of 1000 simulated values of TC (95% confidence interval) | 0.095 (0.082, 0.111) | 39.16 (31.81, 47.22) |
| P(observed TC| null model) | <0.001 | <0.001 |
The sampling design and collecting methods for the stream fish study have been described previously (Whittaker 1976; Grossman et al. 1982, 1985) and are only summarized here. A 120 m long × 23 m wide section of Otter Creek, Vigo County, IN, USA, was surveyed annually between 1962 and 1974. The site contained a diversity of substrata and depths and can be considered representative of many streams in the midwestern USA. During the study period, the site retained a relatively stable physical structure. Fishes were sampled using a seine, and all collections were supervised by a single investigator, so effort was relatively consistent. There was some minor variation present in sampling efficiency produced by differences in stream depth among years, although the investigators always attempted to keep the area sampled constant. All fishes captured were identified to species and counted, except in a few cases in which a species was extremely abundant. In those cases, numerical estimates were derived from subsamples of the total catch. All fishes were immediately returned live to the site, except for voucher specimens, which were preserved for later identification (Grossman et al. 1982, 1985).
The insect data were collected as part of the Long Term Ecological Research (LTER) network (LTER 2007) at the KBS in northern Michigan, USA. At KBS, a set of seven 1 ha crop rotational treatments have been replicated in six blocks on a single 60 ha plot (KBS 1995). We used data from treatment 7, a native successional treatment that was abandoned after spring plowing in 1989. The plots are surveyed with yellow sticky traps that are replaced weekly from May to August. These traps collect insect predators, many of which are identified only to family level (Chrysopidae and Lampyridae). We used data for nine taxa that were identified to species and were sampled in all years of the study. Within each sampling season, we pooled data from all sticky traps and all plots to generate annual counts for each species.
(b). Null model analysis
In this section we describe a null model for detecting temporal trends in species' abundances. We use the term ‘null model’ to represent a model wherein an S × T matrix of counts of individuals is assumed to arise by randomly selecting individuals from the species assemblage according to each species' relative abundance and a set of temporally varying sampling probabilities. The key issue is that no particular ecological process or mechanism is assumed to have generated the matrix of counts; thus the model incorporates simple sampling effects, but is ‘null’ with respect to processes that might induce trends in species abundance (Gotelli & Graves 1996). The total number of individuals of species i in all sampling periods is
 |
(2.1) |
The total number of individuals of all species observed during sampling period j is
 |
(2.2) |
Let N equal the total number of individuals summed across all species and samples
 |
(2.3) |
We define the relative abundance of species i in the source pool of N individuals as
| (2.4) |
Similarly, we define the relative sampling intensity during the jth survey as
| (2.5) |
Under the assumptions of the null model, si is regarded as the probability that an individual drawn from the source pool of N individuals belongs to species i and qj is regarded as the probability that an individual is observed in the jth sampling period, regardless of species.
To conduct a bootstrap test of the null model, we first randomly assign each of the N individuals in the total collection to a particular sample, with probability qj. Once all the individuals are assigned, we then assign them species identities by sampling randomly with replacement from the distribution of si values. This two-step process does not depend on the order of conditioning; the same distribution would be obtained by first assigning individuals to species using the si values, and then assigning these individuals to particular samples using the qj values.
This null model describes a multinomial sampling process that is conditional on N, the total number of individuals observed. The simulated number of individuals yij of species i in sample j depends on si, the proportional representation of species i in the source pool, qj, the proportion of individuals sampled at time j, and N. The null hypothesis is that variability among species in temporal trends is no greater than would be expected from this simple model of sampling with replacement from an underlying stationary distribution of relative abundance. The alternative hypothesis is that at least some species in the assemblage are systematically increasing or decreasing, leading to changes in relative abundance that cannot be accounted for entirely by sampling effects.
The null hypothesis is defined by the following hierarchical model:
| (2.6) |
and
| (2.7) |
and our randomization procedure is entirely consistent with this model. Based on this model, the marginal distribution of the counts is multinomial
 |
(2.8) |
Therefore, under the null hypothesis the expected value of each count is proportional to the product of species relative abundance and year-specific sampling probability.
To estimate temporal trends from the observed data, we first fit a simple linear model to the count data for each species i
| (2.9) |
where tj is time (in arbitrary units of years, months, or time-steps), β0i is the intercept, β1i is the slope of the regression for species i and the error term  has a normal distribution
  .
.
We are interested in β1i, because it measures the simple temporal trend in abundance for species i. Temporal change (TC) in the entire assemblage can then be quantified as the sample variance of the estimated β1i values
 |
(2.10) |
The larger the TC, the more heterogeneity there is in the temporal trends of the component species, and the more change in composition of the assemblage that will be seen at future sampling dates. As described below, the number of species generated in the null assemblages was not constant. However, for both the real and the simulated matrices, TC was calculated only for species that were present at least once in the matrix. Following standard procedures for resampling tests (Manly 2009), we generated 1000 null assemblages, and calculated TC for each. We estimate the probability of obtaining TC if the null hypothesis were true by comparing the observed TC to the histogram of simulated TC values.
Because the results are potentially sensitive to the assumption of simple linear trends in yij, we fit two alternative regression models based on log–log and log-linear transformations of (yij + 1) and tj. The same transformations were applied to the real and the simulated data. Although these alternative models incorporated nonlinear trends in species temporal trajectories, the transformations had no qualitative effect on the outcome of the null model tests. Therefore, we present results only from analyses of the untransformed data fit with a linear trend line.
(c). Undetected species
The construction of the null matrix is similar to a simulation of rarefaction (Sanders 1968; Hurlbert 1971), in which a small assemblage is simulated by random draws of subsamples of nj individuals from the larger sample of N. However, in rarefaction, sampling is done without replacement (Simberloff 1978). Because our null model treats the source pool as a permanent stationary distribution, we sampled from it with replacement. In practice, the results will not differ unless the sample sizes are so small that nj is a relatively large fraction of N, which is not the case for these datasets. Rarefaction also conditions on nj, the observed count in a particular sample, whereas our multinomial model conditions on N, the total number of individuals.
This procedure implicitly addresses detection error because species (especially rare ones) that are present in the aggregated collection N may not be represented in any particular sample nj. In some null assemblages, species that were very rare in the original dataset may be missing from all nj samples. Because biodiversity sampling is notoriously incomplete, there are also likely to be rare species in the assemblage that were never encountered in the original samples (Colwell & Coddington 1994). We expanded our null model to incorporate these undetected species. We first estimated the minimum number of undetected species,  using a bias-corrected version of the familiar Chao2 estimator (Chao 1984; eqn (2.4) in Colwell 2009)
 |
(2.11) |
where Q1 is the number of species represented in exactly 1 time period (‘uniques’), Q2 is the number of species represented in exactly two time periods (‘duplicates’) and T is the number of samples. The Chao2 index estimates the number of undetected species in the entire assemblage, not the number that may be undetected in any single sample. For the stream fish matrix, the estimated number of undetected species (rounded to the nearest whole integer) was 16. For the insect matrix, sampling was restricted to nine common species, and the estimated number of undetected species was 0.
Once the number of undetected species was estimated, it was necessary to assign them each a relative abundance si, so they could be included in the simulation. Estimating these si values would require knowledge of the precise form of the species abundance distribution, a long-standing unsolved problem in ecology (McGill et al. 2007). As a simplifying first approximation, we assumed that si for each undetected species was equal to 0.5·si for the least abundant species observed in the assemblage. The reasoning is that if any of these undetected species occurred at a frequency greater than this, they would probably have been detected at least once in the original sample. For the stream fish data, si for each of the 16 undetected species was set at 3.414135 × 10⁻⁵. Because many of the undetected species are probably much more rare than this, our procedure allows for the greatest possible influence of undetected species. Nevertheless, the results for the stream fish matrix were identical with and without the inclusion of undetected species. However, because the observed number of species is always a biased under-estimator of true species richness, we present the full analyses here with the undetected species included in the null model.
If the observed value of TC is larger than those of 950 of the 1000 simulated TC values (p < 0.05, one-tailed test), then the temporal trends in the set of observed species are more heterogeneous than can be accounted for by the null model: at least some species are either increasing or decreasing more rapidly than would be expected from sampling effects and undetected species. The null model was programmed and implemented in the statistical language R (R Development Core Team 2008; see electronic supplementary material, appendix A).
(d). Hierarchical model of trend in abundances
The null model provides a simple test for heterogeneity in species trends. If this null hypothesis is rejected, the next step is to estimate the rate of change in abundance of each species. As before, yij is the count of species i in sample j. We assume that the count yij depends on the abundance Nij present during the jth survey and on each individual's probability of capture pij, as follows:
| (2.12) |
To estimate trend, we assume population abundances can be described as
| (2.13) |
and
| (2.14) |
where λij denotes mean abundance of species i during survey j and where tj denotes the year of the jth survey. Trend in λij values is specified using the familiar exponential growth model (equation (2.14)), which includes a species-specific intercept parameter λi0 and a net population growth rate parameter ri.
Note that Nij is not actually observed. Nij is a parameter of the model that represents the number of individuals of species i which are present and available to be captured during the jth survey. The observation yij can be interpreted as a negatively biased estimator of Nij, with the level of bias depending on the magnitude of pij, the unknown probability of capture for individuals of species i.
In the absence of replicated observations, we cannot estimate temporal changes in both Nij and pij. Therefore, we assume that capture probabilities vary among species but not among surveys (i.e. we assume pij = pi). Even with this simplifying assumption, the hierarchical model composed of equations (2.12)–(2.14) contains more parameters than can be estimated from the data. To solve this problem, Nij may be eliminated from the model by integrating the joint distribution of yij and Nij. This integration can be done analytically to obtain the following marginalized version of the hierarchical model:
| (2.15) |
Note that this model may be viewed conceptually as a Poisson regression model. For example, let μij denote the Poisson mean for yij. The logarithm of μij is a linear combination of the marginal model's parameters
| (2.16) |
However, pi and λi0 are not identifiable parameters in equation (2.16) (i.e. both parameters cannot be estimated); therefore, we combine these parameters into a common regression intercept parameter (say, ai = log(piλi0)) to obtain
| (2.17) |
From this equation, the T observations,  , can be used to estimate the parameters ai and ri. We are interested primarily in the latter parameter ri, which denotes the trend in abundance of species i; however, our formulation of the intercept parameter ai reveals explicitly the combined roles of mean abundance and capture probability in the model.
The model specified by equations (2.15) and (2.17) can be fitted to each species separately. However, doing so may produce estimates of trend that are unstable or highly imprecise for species whose abundance appears to be low (as indicated by counts that contain several zeros and ones). Therefore, we extend the model as follows:
| (2.18) |
where β denotes the average trend in abundance among species in this assemblage and σ denotes the level of variation in ri values among species. This distributional assumption allows the counts of all species to be analysed jointly so that information associated with species of moderate or high abundance can be used to stabilize the estimates of trend for species of low apparent abundance. Nevertheless, even with this assumption, there were not enough data to reliably estimate trends for very rare species that were represented by less than 10 individuals in the entire survey (25 of 55 stream fish species, and two of nine insect species).
Equation (2.18) implies an exchangeability of trend parameters among species. This exchangeability formalizes the notion that although abundances may be increasing, decreasing or constant for any particular species, each is also a member of a common assemblage. We expect that the temporal trends of the species in the stream fish assemblage are more similar to one another than they are to, say, the temporal trends of the species in the grassland insect assemblage. A restricted version of this model that corresponds to the null model assumes an identical growth rate ri = β for all species, so that σ = 0. We can fit this restricted model and compare it with the unrestricted model to assess whether the data support the null hypothesis that all species abundances have an identical trend.
(e). Method of estimation
The hierarchical model described by equations (2.15), (2.16) and (2.18) may be fitted by maximizing the likelihood function obtained by integrating away the latent trend parameters. In our situation, however, this approach is counter-productive. In addition to the minor technical challenges of computing the integrals numerically, the trend parameters ri are the quantities of primary scientific interest. Estimates of these parameters and their uncertainties are actually needed to solve the inference problem. We therefore adopt a Bayesian approach to inference, which allows every parameter in the model to be estimated directly, including the species-specific trends in abundance.
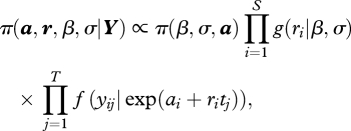
In a Bayesian analysis, all inferences are based on the joint posterior distribution of model parameters. In our case the unnormalized, probability density function (pdf) of this distribution is
 |
(2.19) |
where  , and
, and  . Here, g(·|β, σ) denotes the pdf of a normal distribution with mean β and variance σ2, f(·|μij) denotes the probability mass function of a Poisson distribution with mean μij, and π(β, σ, a) denotes the pdf of the prior distribution of the parameters β, σ, and a.
The posterior pdf cannot be written in closed form owing to the analytically intractable integrals in the normalizing constant (not shown in equation (2.19)). Therefore, we estimated the model's parameters using Markov chain Monte Carlo algorithms (Robert & Casella 2004) to obtain an arbitrarily large sample of the joint posterior distribution. Specifically, we fit the model using the WinBUGS software (Lunn et al. 2000), which is an implementation of the BUGS language for specifying models and doing Bayesian analyses (Gilks et al. 1994).
To obtain the posterior sample, we assumed a set of mutually independent noninformative prior distributions for β, σ and a. We assumed normal (0, 1002) priors for β and ai and a uniform(0, 10) prior for σ. Each of five Markov chains was independently initialized and computed for a total of 21 000 draws. The first 1000 draws in each chain were discarded as ‘burn-in’, and every fifth draw in the rest of each chain was retained to form the posterior sample. Consequently, these calculations yielded a posterior sample of 20 000 draws, which was used to compute estimates of the model's parameters and their 95% credible intervals (see electronic supplementary material, appendix B).
3. Results
(a). Null model analysis
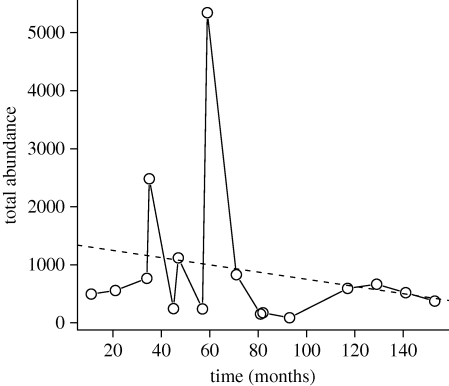
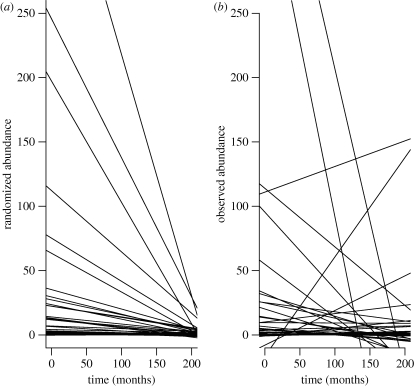
For the stream fish data, there was a non-significant decreasing trend in total abundance (figure 1), caused primarily by extremely high abundances in the November 1966 sample (n8 = 5344 individuals). For the null model analysis, this decreasing trend leads to the expectation of negative slopes for individual species, with a moderate amount of variation among species (figure 2a). However, the observed slopes were much more heterogeneous than this expectation: several species showed sharply increasing or decreasing trend lines (figure 2b), and the observed TC index was larger than that of all 1000 simulated assemblages (table 1).
Figure 1.
Temporal trends in total abundance for the stream fish samples of Grossman et al. (1982). The dashed line indicates the regression line for a simple linear model (nt = 1371–6.212 tj; r2 = 0.04; p = 0.446).
Figure 2.
Observed and simulated trend lines for the stream fish data of Grossman et al. (1982). (a) Results of a single replicate of the null model simulation, in which total abundances for each species are sampled randomly from the abundance distribution of all species pooled through time. See text for details of the simulation model. Each line is the least-squares regression for one of the simulated species. (b) Same graph for the observed data.
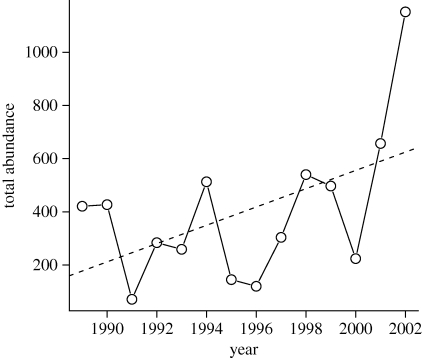
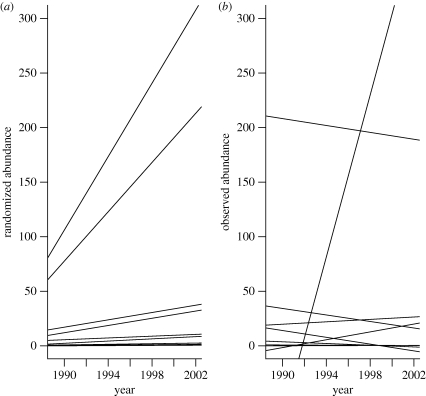
For the insect data, there was a marginally non-significant increasing trend in total abundance (figure 3), with systematically greater abundances during the final sampling years. For the null assemblages created from this matrix, most species had increasing trend lines (figure 4a). However, the observed slopes were again much more heterogeneous than expected (figure 4b). As with the stream fish data, the observed heterogeneity among slopes (TC) was greater than that of any of the simulated assemblages (table 1).
Figure 3.
Temporal trends in total abundance for the insect samples of the successional plot. The dashed line indicates the regression line for a simple linear model (nt = −68 253.0 + 34.4 tj; r2 = 0.27; p = 0.057).
Figure 4.
Observed and simulated trend lines for the insect data from the successional plot. Details as in figure 2.
(b). Trends in abundances
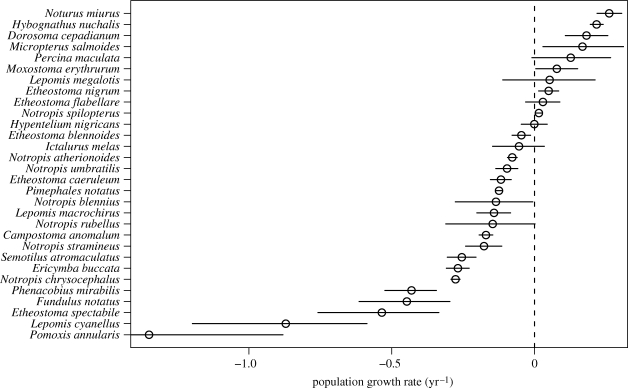
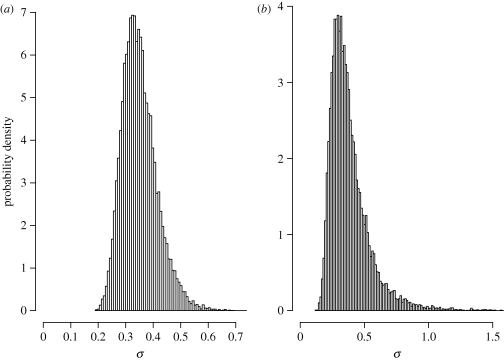
For the stream fish data, the hierarchical model identified seven species with significant increases in abundance, 17 species with significant declines in abundance and six species with no significant trend (figure 5). A negative estimate of average trend,  (95% credible interval: (−0.289, −0.024)), also indicates that species with declining abundances outnumbered those with increasing abundances. There is little doubt that trends in population abundance differed substantially among species. The posterior distribution of σ (figure 6a) provides virtually no support for the hypothesis that σ = 0.
Figure 5.
Hierarchical model estimates of ri, the intrinsic rate of increase (= ln(λ)) for 30 species of stream fishes. Each circle represents the estimated ri, and the error bar is the asymmetrical 95% credible interval.
Figure 6.
Posterior distribution of σ, the variation among species in temporal trends, estimated from the hierarchical model (equation (2.19)) by Markov chain Monte Carlo simulation. (a) Stream fishes. (b) Grassland insects.
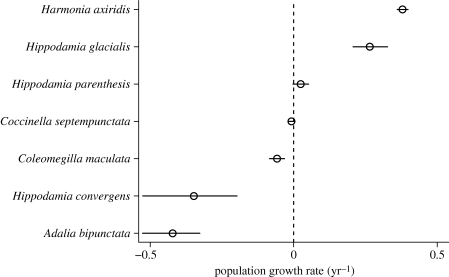
For the grassland insect data, the hierarchical model identified two species with significant increases in abundance, three species with significant declines in abundance and two species with no significant trend (figure 7). The estimate of average trend,  (95% credible interval: (−0.352, 0.297)), reflects the nearly equal numbers of species with increasing and decreasing abundances. As with the stream fish data, the posterior distribution of σ (figure 6b) does not support the null hypothesis (σ = 0) of identical trend lines for these seven species.
Figure 7.
Hierarchical model estimates of ri, the intrinsic rate of increase (= ln(λ)) for seven species of grassland insects. Details as in figure 5.
4. Discussion
The null model and the hierarchical model provide complementary information on temporal trends, and they both point to strong temporal re-organization of stream fish and insect grassland assemblages over periods greater than a decade. Because the insects were sampled in a successional plot, it is no surprise that strong temporal trends would be detected, as vegetation structure and arthropod prey assemblages were systematically changing through time. In fact, the two most rapidly increasing species, Harmonia axiridis and Hippodamia glacialis, never appeared in any of the traps until 6 and 7 years, respectively, after the sampling began. This is exactly the pattern that would be expected in a classic facilitation model of succession (Connell & Slatyer 1977). On the other hand, the abundance of the most common species in the samples, Coccinella septempunctata ( individuals per year), did not change significantly during the 14-year successional sequence (figure 7).
The pattern for the stream fishes is more complex. Although no obvious physical changes were observed in the habitat during the 15-year sampling period, 17 species showed significant declines, whereas only seven species increased in abundance. The causal mechanisms behind these patterns are unclear because both generalist and specialist species were found in both categories, as were representatives of most North American taxonomic groups. Perhaps the preponderance of declining populations suggests that some species successfully invaded the site early in the time series, but were not able to sustain populations through local reproduction and began to decline. It is probable that flow variation plays some role in these trends, perhaps facilitating establishment of species in benign periods and causing substantial mortality during periods of high water (Grossman et al. 1982, 1998). High flow events may cause substantial mortality in stream fishes, especially if they occur during the reproductive period and destroy an entire year-class (Grossman et al. 1982, 1998). However, there was no evidence during the sampling period of declining flows or increased numbers of extreme flow events that might be linked to the decreasing abundance of 17 of the 55 species (Grossman & Sabo 2010). The decreasing trends in abundance of many stream fish species (figure 5) are consistent with a shifting baseline scenario, but the causes of these declines are still unknown.
The results of both the null model and the hierarchical model are potentially sensitive to the functional form that is used to describe temporal trends. For the null model analysis, the results for these datasets were the same when the trends were fit with linear, semi-logarithmic, or log–log transformations of the original data. The estimated heterogeneity among species in temporal trends does not seem to be sensitive to the fitting procedure, perhaps because deviations caused by extreme sample numbers (such as the high counts in the stream fish dataset in 1966) are also incorporated into the pattern in the null assemblages. Both the null model and the hierarchical model assume that species are independent of one another. However, it is unclear how the violation of this assumption (from strong species interactions) would systematically affect the estimates of temporal trends in abundance.
Because the hierarchical model is being used for parameter estimates of change (rather than just a simple dichotomous null model test), it is potentially more sensitive to violation of its assumptions. As we noted, one important assumption in this model is that capture probabilities are constant through time. Although this assumption may not be true, it probably matches the perspective of most field biologists, who typically assume that long-term monotonic changes in species counts with standardized sampling methods primarily reflect changes in abundance, rather than changes in detection or capture probabilities.
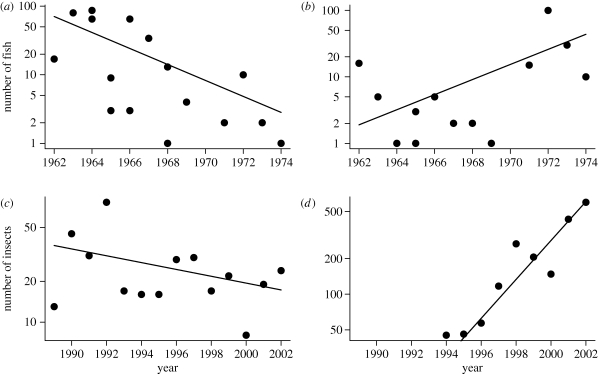
If species-specific capture probabilities are not constant, the magnitude of the deviations between observed and expected counts may be inflated. As long as these deviations do not vary systematically with time, the point estimates of trend will not be affected, although the credible intervals may be too narrow. Alternatively, if the deviations between expected and observed counts vary systematically with time, say changing from positive to negative values, the trend estimates will be very sensitive to an incorrect assumption of constant capture probability. For the datasets we analysed, there was no evidence of a systematic lack of fit (figure 8).
Figure 8.
Estimated trends for representative stream fish and insect species. (a,b) Estimated trends in captures of stream fish (shown by lines) of two species ((a) Ericymba buccata and (b) Noturus miurus) superimposed on the observed counts of these species. Ordinate is logarithmically scaled. Three zero-valued counts (for years 1964, 1966 and 1968) of N. miurus are not shown. (c,d) Trends for insect species: (c) Coleomegilla maculata and (d) Harmonia axiridis. Five zero-valued counts (for years 1989–1993) of H. axiridis are not shown.
In the hierarchical model, the assumption of constant sampling probabilities was necessary only because of the extremely simple and unreplicated structure of the data matrix. With replication, it may be possible to estimate parameters for temporal trends in both abundance and detection probabilities. For example, the KBS insect data actually consist of weekly sticky trap counts collected from six replicated plots. Rather than pooling the data as we have done in this analysis, the individual trap records could be fit to a more complex hierarchical model (Royle & Dorazio 2008; Kery et al. 2009). The hierarchical model could also be expanded to incorporate species-specific covariates Z (such as body size, geographical range size, or degree of habitat specialization) that might be of interest for conservation purposes. Species-specific covariates could be used to model either the mean structure of the elements of r in equation (2.18) or their covariances.
Both the bootstrap test and the hierarchical model assume that changes in abundance through time are monotonic. If species show more complex patterns of temporal change (such as periodic fluctuations), these could be accommodated by fitting polynomial or sine functions to the time series. However, at least for these datasets, diagnostic analysis of residuals indicated little evidence for departures from linearity over the time periods that were sampled. Moreover, a monotonic function is appropriate for very short data series such as these (T = 15 samples for stream fishes and T = 14 samples for grassland insects).
Finally, the frequent occurrence of rare species in natural assemblages continues to pose statistical challenges. In the null model, all species, no matter how rare, are included in the analysis, and the null assemblages even incorporate the possibility of species that were never detected in any of the samples. In theory, rare species can contribute to the size of the observed TC index. For example, if all of the rare species occurred in only the very first or the very last sample, the sample variance in the trend lines would tend to be large compared to that found for the null assemblages. However, less extreme distributions of rare species look very similar to those generated by the null model, and therefore would not contribute substantially to the TC index.
In the hierarchical model, the assumption of exchangeability of ri values allowed us to use information from common species to estimate trends for less common species. Nevertheless, when abundance is so low that there are fewer than 10 individuals counted in 14 or more consecutive annual samples, estimating temporal trends with any statistical model is a dubious exercise. For these cases, auxiliary information, stratified sampling and additional data may be necessary (Dixon et al. 2005).
In summary, quantifying temporal trends in species abundances is an important forecasting problem. Given the accelerating rates of habitat alteration and global climate change, the strong heterogeneity that we detected in the stream fish and grassland insect datasets (figures 5 and 7) may be typical; it seems unlikely to us that most long-term temporal trends will be accounted for entirely by the sampling effects in our null model. In these cases, the hierarchical models provide a sensible framework for predicting what the future may hold.
Acknowledgements
We thank Anne Chao and two anonymous reviewers for comments that improved the manuscript. N.J.G. was supported by the U.S. National Sciences Foundation (NSF DEB-0541936) and the U.S. Department of Energy (022 821). G.D.G. was supported by the Warnell School of Forestry and Natural Resources and U.S. Department of Agriculture (USDA) Forest Service McIntire-Stennis program grant GEO-00 144-MS. Portions of this work represent a contribution from the Harvard Forest Long-Term Ecological Research Site, supported by NSF 06-20 443. This work was also facilitated by meetings at the Binary Matrices Working Group at the National Institute for Mathematical and Biological Synthesis, sponsored by NSF, the U.S. Department of Homeland Security, and the USDA through NSF Award no. EF-0832858, with additional support from the University of Tennessee, Knoxville.
Footnotes
One contribution of 16 to a Discussion Meeting Issue ‘Biological diversity in a changing world’.
References
- Chao A.1984Non-parametric estimation of the number of classes in a population. Scand. J. Statist. 11, 265–270 [Google Scholar]
- Chao A., Colwell R. K., Lin C.-W., Gotelli N. J.2009Sufficient sampling for asymptotic minimum species richness estimators. Ecology 90, 1125–1133 (doi:10.1890/07-2147.1) [DOI] [PubMed] [Google Scholar]
- Clarke K. R.1993Non-parametric multivariate analyses of changes in community structure. Aust. J. Ecol. 18, 117–143 [Google Scholar]
- Collins S. L., Micheli F., Hartt L.2000A method to determine rates and patterns of variability in ecological communities. Oikos 91, 285–293 (doi:10.1034/j.1600-0706.2000.910209.x) [Google Scholar]
- Colwell R. K.2009Estimates: statistical estimation of species richness and shared species from samples, v. 8.2. User's Guide and application published at: http://purl.oclc.org/estimates [Google Scholar]
- Colwell R. K., Coddington J. A.1994Estimating terrestrial biodiversity through extrapolation. Phil. Trans. R. Soc. Lond. B 345, 101–118 (doi:10.1098/rstb.1994.0091) [DOI] [PubMed] [Google Scholar]
- Connell J. H., Slatyer R. O.1977Mechanisms of succession in natural communities and their role in community stability and organization. Am. Nat. 111, 1119–1144 [Google Scholar]
- Dixon P. M., Ellison A. M., Gotelli N. J.2005Improving the precision of estimates of the frequency of rare events. Ecology 86, 1114–1123 (doi:10.1890/04-0601) [Google Scholar]
- Dorazio R. M., Kery M., Royle J. A., Plattner M.2010Models for inference in dynamic metacommunity systems. Ecology 91, 2466–2475 (doi:10.1890/09-1033.1) [DOI] [PubMed] [Google Scholar]
- Dunson W. A., Travis J.1991The role of abiotic factors in community organization. Am. Nat. 138, 1067–1091 [Google Scholar]
- Ellison A. M., et al. 2005Loss of foundation species: consequences for the structure and dynamics of forested ecosystems. Front. Ecol. Environ. 3, 479–486 (doi:10.1890/1540-9295(2005)003[0479:LOFSCF]2.0.CO;2) [Google Scholar]
- Fujiwara M., Mohr M. S.2009Identifying environmental signals from population abundance data using multivariate time-series analysis. Oikos 118, 1712–1720 (doi:10.1111/j.1600-0706.2009.17570.x) [Google Scholar]
- Gilks W. R., Thomas A., Spiegelhalter D. J.1994A language and program for complex Bayesian modelling. Statistician 43, 169–178 (doi:10.2307/2348941) [Google Scholar]
- Gotelli N. J., Colwell R. K.2001Quantifying biodiversity: procedures and pitfalls in the measurement and comparison of species richness. Ecol. Lett. 4, 379–391 (doi:10.1046/j.1461-0248.2001.00230.x) [Google Scholar]
- Gotelli N. J., Graves G. R.1996Null models in ecology. Washington, DC: Smithsonian Institution Press [Google Scholar]
- Grossman G. D., Sabo J. L.2010Incorporating environmental variation into models of community stability: examples from stream fish assemblages. In Community ecology of stream fishes (eds Gido K., Jackson D.), Washington, DC: American Fisheries Society [Google Scholar]
- Grossman G. D., Moyle P. B., Whittaker J. O., Jr1982Stochasticity in structural and functional characteristics of an Indiana stream fish assemblage: a test of community theory. Am. Nat. 120, 423–454 [Google Scholar]
- Grossman G. D., Freeman M. C., Moyle P. B., Whittaker J. O., Jr1985Stochasticity and assemblage organization in an Indiana stream fish assemblage. Am. Nat. 126, 275–285 [Google Scholar]
- Grossman G. D., Ratajczak R. E., Crawford M. K., Freeman M. C.1998Assemblage organization in stream fishes: effects of environmental variation and interspecific interactions. Ecol. Monogr. 68, 395–420 (doi:10.1890/0012-9615(1998)068[0395:AOISFE]2.0.CO;2) [Google Scholar]
- Hurlbert S. H.1971The nonconcept of species diversity: a critique and alternative parameters. Ecology 52, 577–585 (doi:10.2307/1934145) [DOI] [PubMed] [Google Scholar]
- Jones C. G., Lawton J. H., Shachak M.1994Organisms as ecosystem engineers. Oikos 69, 373–386 (doi:10.2307/3545850) [Google Scholar]
- Kellogg Biological Station Sampling Protcols. 1995. See http://lter.kbs.msu.edu/protocols/36 .
- Kery M., Dorazio R. M., Soldaat L., van Strien A., Zuiderwijk A., Royle J. A.2009Trend estimation in populations with imperfect detection. J. Appl. Ecol. 46, 1163–1172 [Google Scholar]
- Lawton J. H., et al. 1998Biodiversity inventories, indicator taxa, and effects of habitat modification in tropical rain forest. Nature 391, 72–76 (doi:10.1038/34166) [Google Scholar]
- Longino J. T., Coddington J., Colwell R. K.2002The ant fauna of a tropical rain forest: estimating species richness three different ways. Ecology 83, 689–702 (doi:10.1890/0012-9658(2002)083[0689:TAFOAT]2.0.CO;2) [Google Scholar]
- LTER 2007The US Long Term Ecological Research Network. See http://www.lternet.edu/ [Google Scholar]
- Lunn D. J., Thomas A., Best N., Spiegelhalter D.2000WinBUGS—a Bayesian modelling framework: concepts, structure, and extensibility. Statist. Comput. 10, 325–337 See http://www.mrc-bsu.cam.ac.uk/bugs/ [Google Scholar]
- Manchester S. J., Bullock J. M.2000The impacts of non-native species on UK biodiversity and the effectiveness of control. J. Appl. Ecol. 37, 845–864 (doi:10.1046/j.1365-2664.2000.00538.x) [Google Scholar]
- Manly B. J.2009Randomization, bootstrap and Monte Carlo methods in biology, 3rd edn.Boca Raton, FL: Chapman and Hall/CRC [Google Scholar]
- McGill B. J., et al. 2007Species abundance distributions: moving beyond single prediction theories to integration within an ecological framework. Ecol. Lett. 10, 995–1015 (doi:10.1111/j.1461-0248.2007.01094.x) [DOI] [PubMed] [Google Scholar]
- Mills L. S., Soule M. E., Doak D. F.1993The keystone species concept in ecology and conservation. BioScience 43, 219–224 (doi:10.2307/1312122) [Google Scholar]
- Pauly D.1995Anecdotes and the shifting baseline syndrome of fisheries. Trends Ecol. Evol. 10, 430 (doi:10.1016/S0169-5347(00)89171-5) [DOI] [PubMed] [Google Scholar]
- R Development Core Team 2008R: a language and environment for statistical computing. Vienna, Austria: R Foundation for Statistical Computing [Google Scholar]
- Robert C. P., Casella G.2004Monte Carlo statistical methods, 2nd edn New York, NY: Springer [Google Scholar]
- Royle J. A., Dorazio R. M.2008Hierarchical modeling and inference in ecology. Amsterdam, The Netherlands: Academic Press [Google Scholar]
- Sanders H.1968Marine benthic diversity: a comparative study. Am. Nat. 102, 243–282 [Google Scholar]
- Simberloff D.1978Use of rarefaction and related methods in ecology. In Biological data in water pollution assessment: quantitative and statistical analyses (eds Dickson K. L., Jr, Cairns J., Jr, Livingston R. J.), pp. 150–165 Philadelphia, PA: American Society for Testing and Materials [Google Scholar]
- Solow A. R.1994Detecting change in the composition of a multi-species community. Biometrics 50, 556–565 (doi:10.2307/2533401) [PubMed] [Google Scholar]
- Walther G.-R., Post E., Convey P., Menzel A., Parmesan C., Beebee T. J. C., Fromentin J.-M., Hoegh-Guldberg O., Bairlein F.2002Ecological responses to recent climate change. Nature 416, 389–395 (doi:10.1038/416389a) [DOI] [PubMed] [Google Scholar]
- White E. M., Wilson J. C., Clarke A. R.2006Biotic indirect effects: a neglected concept in invasion biology. Divers. Distrib. 12, 443–455 (doi:10.1111/j.1366-9516.2006.00265.x) [Google Scholar]
- Whittaker J. O.1976Fish community changes at one Vigo County locality over a twelve-year period. Proc. Indiana Acad. Sci. 85, 191–207 [Google Scholar]


